. 2021 Jun 29;35(13):109330.
doi: 10.1016/j.celrep.2021.109330.

Principles of 3D compartmentalization of the human genome

Affiliations

Principles of 3D compartmentalization of the human genome

Michael H Nichols et al. Cell Rep. .

Abstract

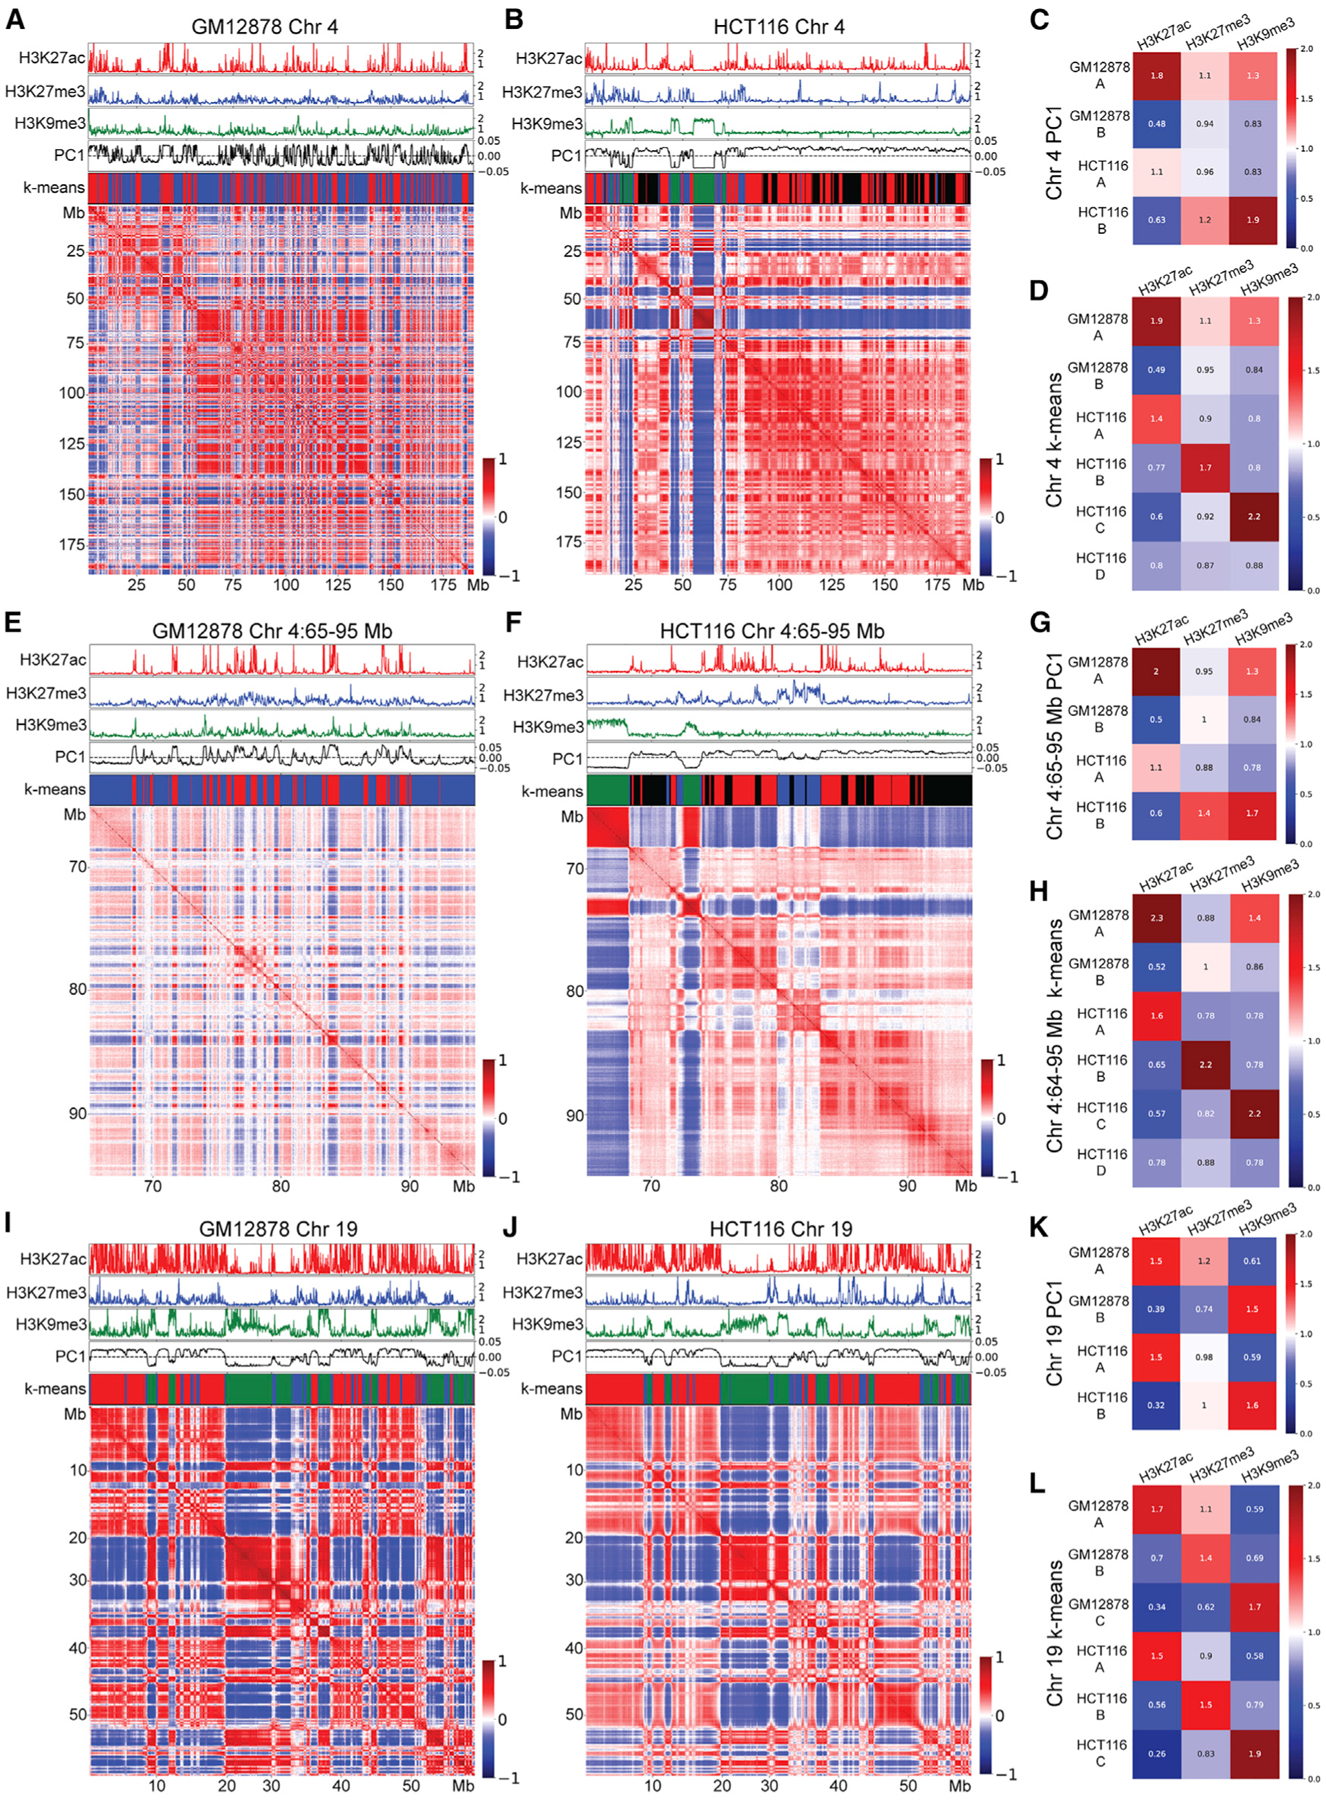
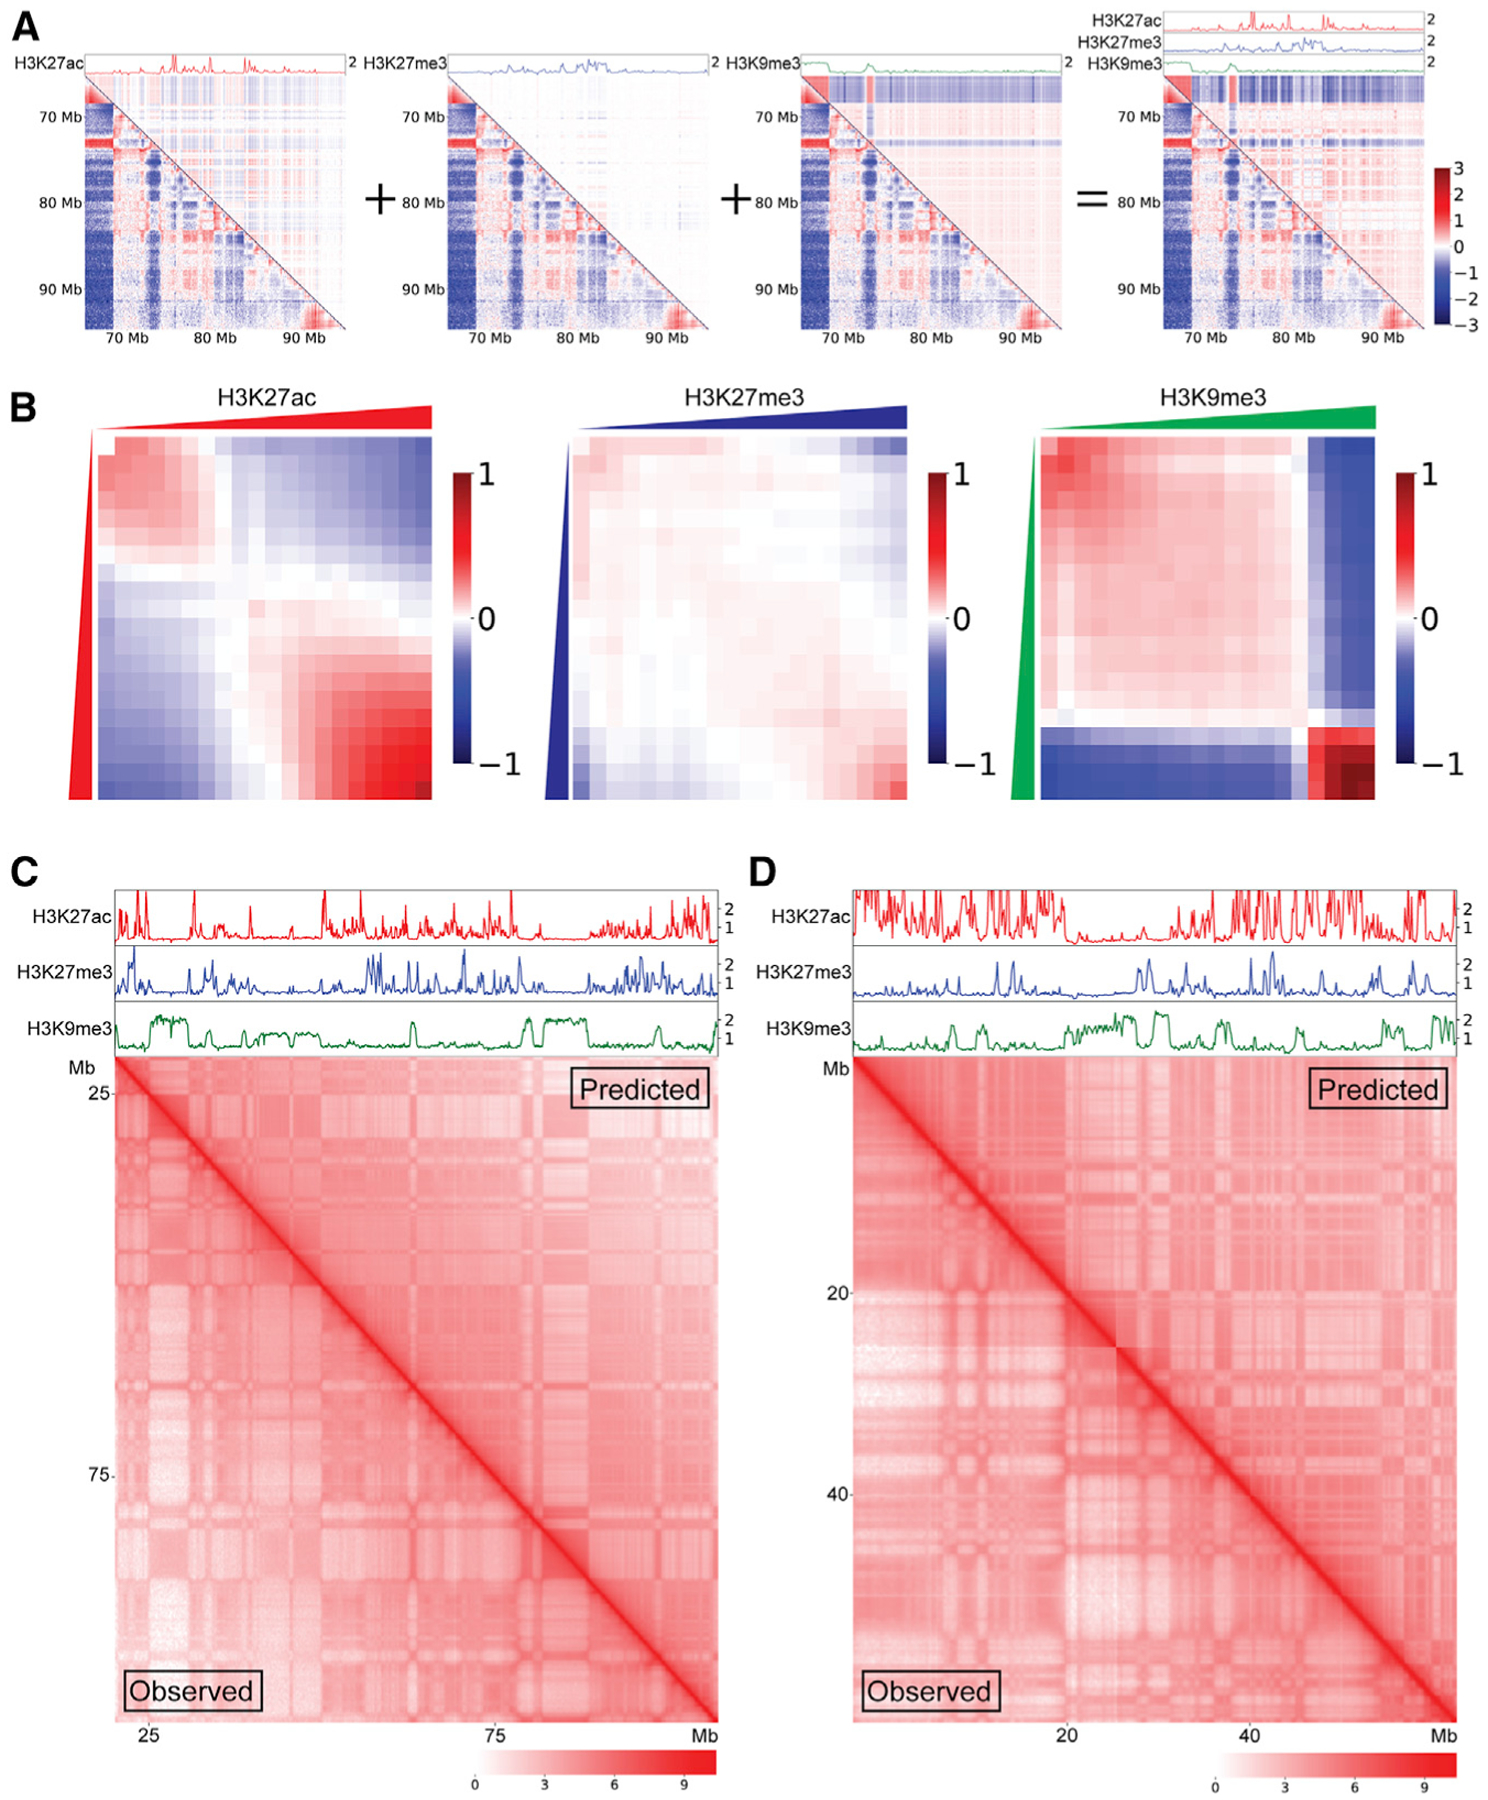
Chromatin is organized in the nucleus via CTCF loops and compartmental domains. Here, we compare different cell types to identify distinct paradigms of compartmental domain formation in human tissues. We identify and quantify compartmental forces correlated with histone modifications characteristic of transcriptional activity and previously underappreciated roles for distinct compartmental domains correlated with the presence of H3K27me3 and H3K9me3, respectively. We present a computer simulation model capable of predicting compartmental organization based on the biochemical characteristics of independent chromatin features. Using this model, we show that the underlying forces responsible for compartmental domain formation in human cells are conserved and that the diverse compartmentalization patterns seen across cell types are due to differences in chromatin features. We extend these findings to Drosophila to suggest that the same principles are at work beyond humans. These results offer mechanistic insights into the fundamental forces driving the 3D organization of the genome.

Keywords: 3D organization; CTCF; chromatin; cohesin; enhancer; nucleus; transcription.


Conflict of interest statement

Declaration of interests The authors declare no competing interests.

Figures

Figure 1.
Figure 1.. GM12878 and HCT-116 cells show different compartmental patterns
Pearson correlations of distance-normalized Hi-C interaction frequency maps corresponding to various chromosome regions in GM12878 and HCT-116 cells. On top of each Hi-C map from top to bottom: fold change over control shown for H3K27ac (red), H3K27me3 (blue), and H3K9me3 (green); PC1 component from PCA (black), and k-means cluster classifications corresponding to compartments A (red), B (blue), C (green), and D (black). (A) Chromosome 4 from GM12878 cells. (B) Chromosome 4 from HCT-116 cells. (C) Fold enrichment of each histone modification within each compartment defined by PCA in chromosome 4 from GM12878 and HCT-116 cells. (D) Fold-enrichment of each histone modification within each compartment defined by k-means clustering on chromosome 4 from GM12878 and HCT-116 cells. (E) Region spanning 65–95 Mb of chromosome 4 from GM12878 cells. (F) Region spanning 65–95 Mb of chromosome 4 from HCT-116 cells. (G) Fold enrichment of each histone modification within each compartment defined by PCA on the region spanning 65–95 Mb of chromosome 4 from GM12878 and HCT-116 cells. (H) Fold enrichment of each histone modification within each compartment defined by k-means clustering on the region spanning 65–95 Mb of chromosome 4 from GM12878 and HCT-116 cells. (I) Chromosome 19 from GM12878 cells. (J) Chromosome 19 from HCT-116 cells. (K) Fold enrichment of each histone modification within each compartment defined by PCA on chromosome 19 from GM12878 and HCT-116 cells. (L) Fold enrichment of each histone modification within each compartment defined by k-means clustering on chromosome 19 from GM12878 and HCT-116 cells.
Figure 2.
Figure 2.. Results from sorting sequences from chromosome 14 of HCT-116 cells based on the magnitude of PC1 and the levels of various histone modifications
Pearson correlations of distance-normalized Hi-C interaction frequency map of chromosome 14 from HCT-116 cells. Shown above each Hi-C map from top to bottom are the following: fold change over control for H3K27ac (red), H3K27me3 (blue), and H3K9me3 (green); PC1 (black), and k-means cluster classifications A (red), B (blue), and C (green). (A) Interactions among sequences from chromosome 14 arranged in natural order. (B) Interactions among sequences from chromosome 14 sorted according to PC1 values from lowest to highest. (C) Interactions among sequences from chromosome 14 sorted according to H3K9me3 levels from lowest to highest. (D) Interactions among sequences from chromosome 14 sorted according to H3K27ac levels from lowest to highest. (E) Interactions among sequences from chromosome 14 sorted according to H3K27me3 levels from lowest to highest.
Figure 3.
Figure 3.. Histone modifications can predict compartmentalization using learned attraction-repulsion relationships
(A) Log(observed/expected) of Hi-C interaction maps showing the 65- to 95-Mb region of chromosome 4 from HCT-116 cells. Bottom left triangles are observed Hi-C interaction maps, while upper right triangles are simulations using only the components shown above as tracks. From left to right H3K27ac (red), H3K27me3 (blue), H3K9me3 (green), and all 3 combined. (B) Average of attraction-repulsion relationship maps learned by maximum likelihood estimation from every chromosome of HCT-116 cells. (C) Comparison of HCT-116 chromosome 8 logged Hi-C interaction maps. The bottom left below the diagonal corresponds to observed interactions and the upper right above the diagonal represents simulated contacts. (D) Comparison of HCT-116 chromosome 19 logged Hi-C interaction maps. The bottom left below the diagonal corresponds to observed interactions and the upper right above the diagonal represents simulated contacts.
Figure 4.
Figure 4.. Attraction-repulsion relationships are consistent across cell types
(A) Average of attraction-repulsion relationship maps learned by maximum likelihood estimation from every chromosome of GM12878 cells. (B) Comparison of GM12878 chromosome 8-logged Hi-C interaction maps. The bottom left below the diagonal corresponds to observed interactions and the upper right above the diagonal represents simulated contacts using attraction-repulsion maps learned from GM12878. (C) Comparison of GM12878 chromosome 19-logged Hi-C interaction maps. The bottom left below the diagonal corresponds to observed interactions and the upper right above the diagonal represents simulated contacts using attraction-repulsion maps learned from GM12878. (D) Comparison of GM12878 chromosome 8-logged Hi-C interaction maps. The bottom left below the diagonal corresponds to observed interactions and the upper right above the diagonal represents simulated contacts using attraction-repulsion maps learned from HCT-116. (E) Comparison of GM12878 chromosome 19-logged Hi-C interaction maps. The bottom left below the diagonal corresponds to observed interactions and the upper right above the diagonal represents simulated contacts using attraction-repulsion maps learned from HCT-116.
Figure 5.
Figure 5.. Attraction-repulsion relationships explain compartmentalization in Drosophila
(A) Average of attraction-repulsion relationship maps learned by maximum likelihood estimation from chromosomes 2 and 3 of Kc167 cells. (B) Comparison of Kc167 chromosome 2-logged Hi-C interaction maps. The bottom left below the diagonal corresponds to observed interactions and the upper right above the diagonal represents simulated contacts using attraction-repulsion maps learned from chromosome 3 of Kc167 cells. (C) Comparison of Kc167 chromosome 3-logged Hi-C interaction maps. The bottom left below the diagonal corresponds to observed interactions and the upper right above the diagonal represents simulated contacts using attraction-repulsion maps learned from chromosome 2 of Kc167 cells.

References

    1. Andrysik Z, Galbraith MD, Guarnieri AL, Zaccara S, Sullivan KD, Pandey A, MacBeth M, Inga A, and Espinosa JM (2017). Identification of a core TP53 transcriptional program with highly distributed tumor suppressive activity. Genome Res. 27, 1645–1657. - PMC - PubMed
    1. Annunziatella C, Chiariello AM, Esposito A, Bianco S, Fiorillo L, and Nicodemi M (2018). Molecular dynamics simulations of the Strings and Binders Switch model of chromatin. Methods 142, 81–88. - PubMed
    1. Banani SF, Lee HO, Hyman AA, and Rosen MK (2017). Biomolecular condensates: organizers of cellular biochemistry. Nat. Rev. Mol. Cell Biol 18, 285–298. - PMC - PubMed
    1. Bantignies F, Roure V, Comet I, Leblanc B, Schuettengruber B, Bonnet J, Tixier V, Mas A, and Cavalli G (2011). Polycomb-dependent regulatory contacts between distant Hox loci in Drosophila. Cell 144, 214–226. - PubMed
    1. Boehning M, Dugast-Darzacq C, Rankovic M, Hansen AS, Yu T, Marie-Nelly H, McSwiggen DT, Kokic G, Dailey GM, Cramer P, et al. (2018). RNA polymerase II clustering through carboxy-terminal domain phase separation. Nat. Struct. Mol. Biol 25, 833–840. - PubMed

Publication types

LinkOut - more resources