. 2021 Sep 3;433(18):167121.
doi: 10.1016/j.jmb.2021.167121. Epub 2021 Jun 28.

Surprising Twists in Nucleosomal DNA with Implication for Higher-order Folding

Affiliations

Surprising Twists in Nucleosomal DNA with Implication for Higher-order Folding

Stefjord Todolli et al. J Mol Biol. .

Abstract

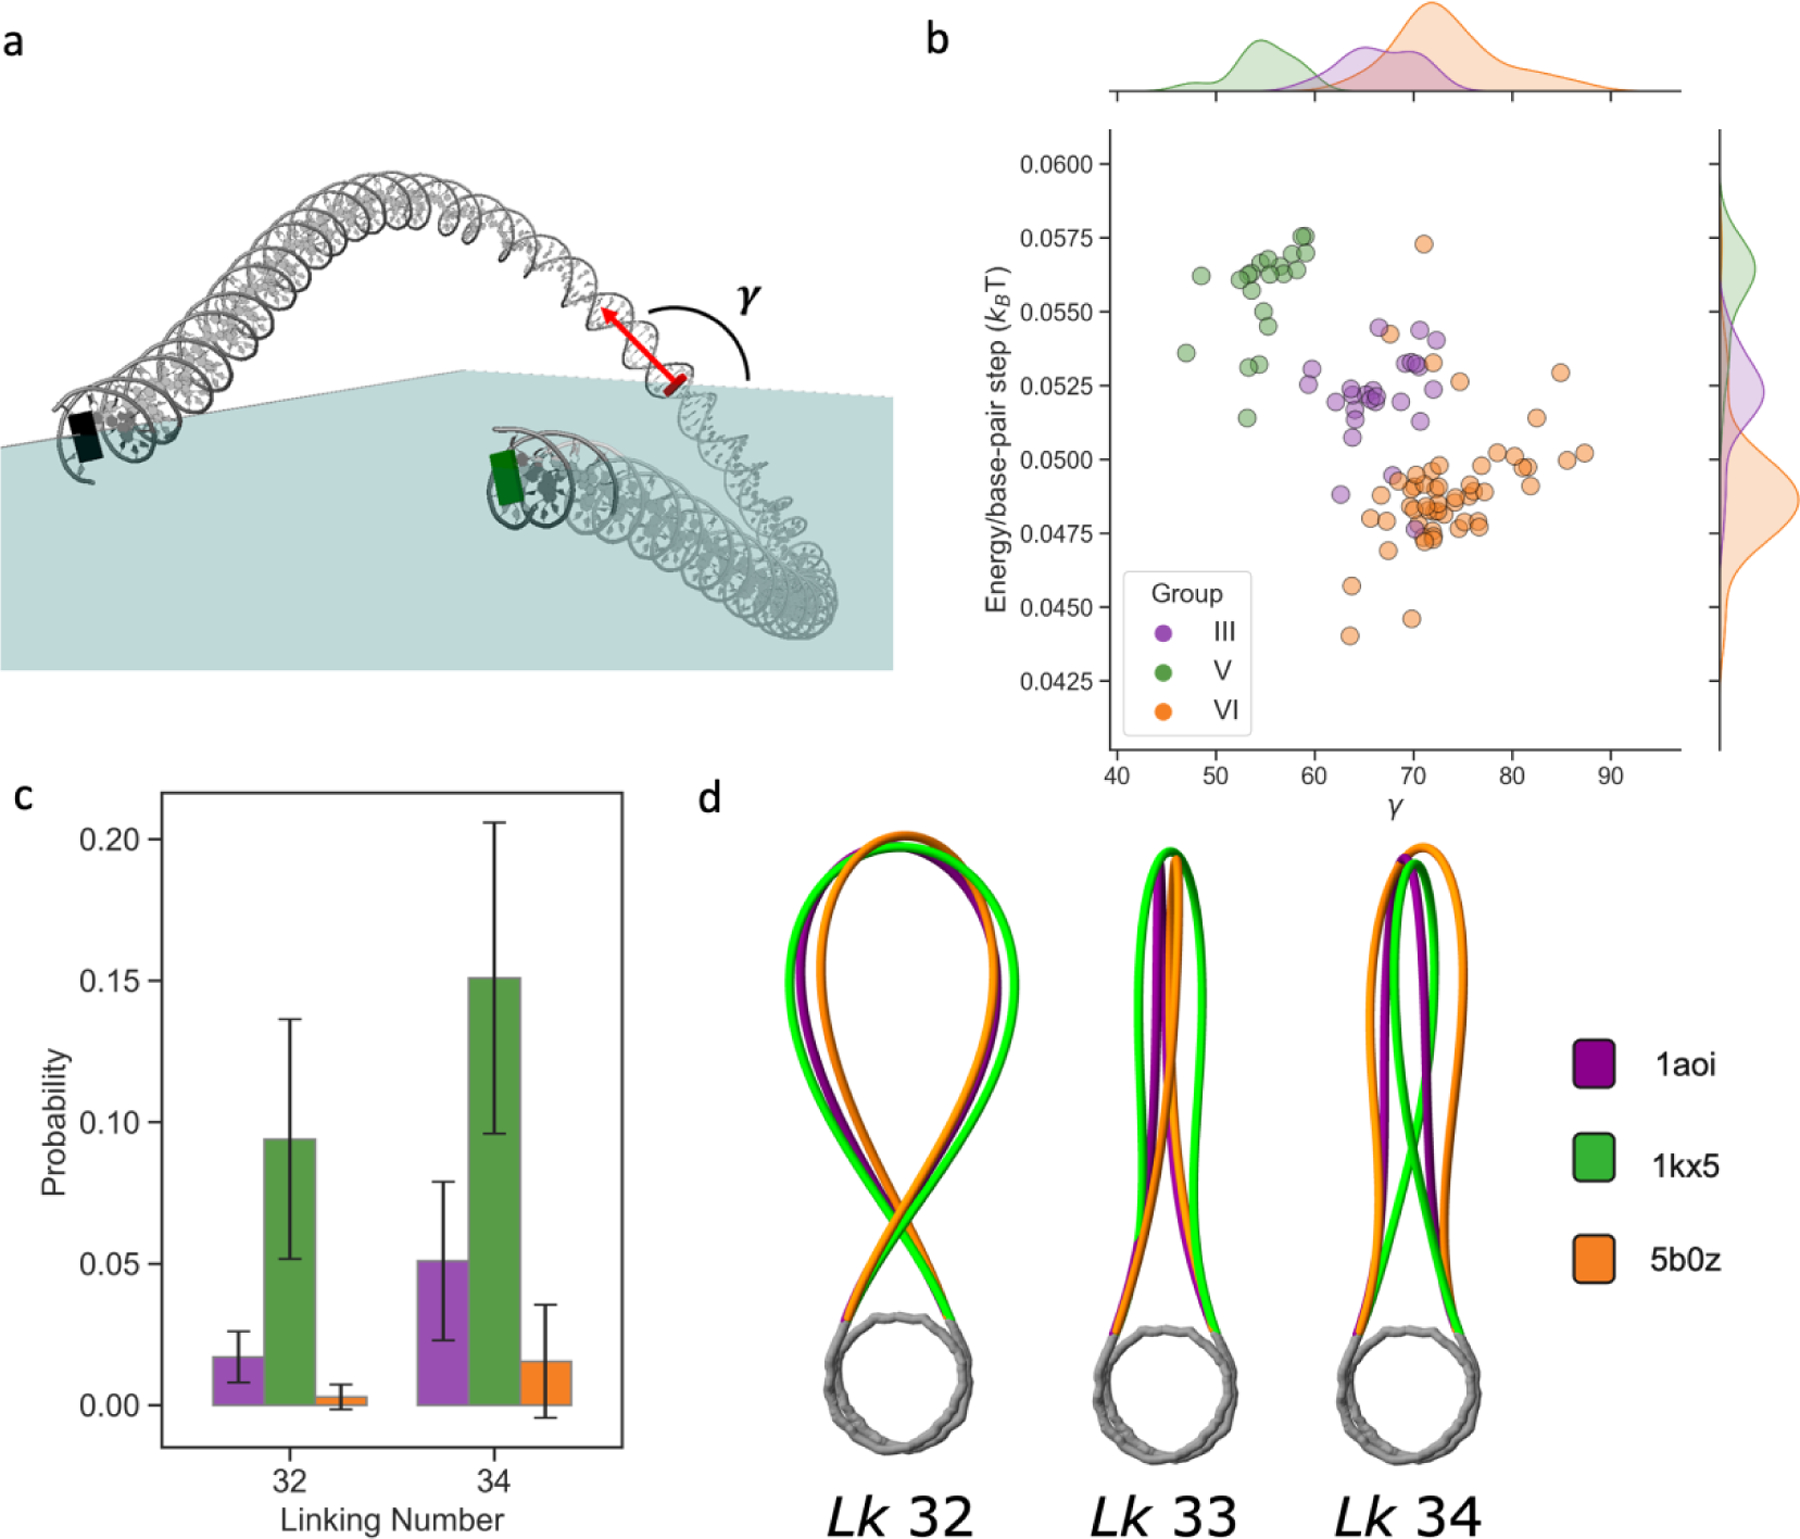
While nucleosomes are dynamic entities that must undergo structural deformations to perform their functions, the general view from available high-resolution structures is a largely static one. Even though numerous examples of twist defects have been documented, the DNA wrapped around the histone core is generally thought to be overtwisted. Analysis of available high-resolution structures from the Protein Data Bank reveals a heterogeneous distribution of twist along the nucleosomal DNA, with clear patterns that are consistent with the literature, and a significant fraction of structures that are undertwisted. The subtle differences in nucleosomal DNA folding, which extend beyond twist, have implications for nucleosome disassembly and modeled higher-order structures. Simulations of oligonucleosome arrays built with undertwisted models behave very differently from those constructed from overtwisted models, in terms of compaction and inter-nucleosome contacts, introducing configurational changes equivalent to those associated with 2-3 base-pair changes in nucleosome spacing. Differences in the nucleosomal DNA pathway, which underlie the way that DNA enters and exits the nucleosome, give rise to different nucleosome-decorated minicircles and affect the topological mix of configurational states.

Keywords: DNA minicircle; Monte Carlo DNA simulation; nucleosomal twist uptake; nucleosome gaping; oligonucleosome array; undertwisted nucleosome.


Conflict of interest statement

Conflict of Interest Statement The authors declare no conflicts of interest.

Figures

Figure 1.
Figure 1.
Molecular images illustrating the ‘dynamics’ of 164 high-resolution nucleosome structures from different perspectives. (a) Conventional view in the direction of the DNA superhelical axis highlighting the symmetry of the assembly and the relative deformability of DNA vs. protein. Structures are superimposed on the core histone regions [83] of the best-resolved structure (PDB ID 1kx5 [25]) using the PyMOL software [84], with the DNA and histone backbones depicted by thin lines (DNA in blue/gold and histones H2A, H2B, H3, H4 in yellow, pink, blue, green, respectively) and the dyad base pairs shown as thick lines. Histone tails and DNA residues outside the central 141 bp are not shown; (b) Same depiction of nucleosomal components but viewed down the dyad axis with the C6/C8 atoms of pyrimidine/purine bases at positions ±70 shown as spheres; (c) ‘Pinched’ view with nucleosomes aligned on the frame of the dyad base pair (blue/gold blocks) and the centers of base pairs connected by smooth B-spline curves; (d) ‘Fixed-end’ view with nucleosomes aligned on the frame of base pair −70 (blue-gold blocks) and DNA pathways again depicted by B-spline curves.
Figure 2.
Figure 2.
Color-coded heat map of the uptake of twist Δτ, in degrees, relative to the average over all structures (~34.5°), at each base-pair step along the central 141 base pairs of the nucleosome core particles shown in Figure 1, with undertwisted steps depicted in shades of blue and overtwisted steps in shades of red. The eight panels show seven unique modes of twist build-up along the DNA (I-VII) found upon clustering the values of Δτ (see Methods). Gray lines highlight the ±7 bp regions around locations ±20 and ±50, which contain the largest differences in twist among the nucleosome groups. The bands across the top denote the sites and frequencies of DNA-protein contact. The vertical bar graph on the right shows the net twist uptake ΔTw[−70, 70], in degrees, over all steps compared to the average.
Figure 3.
Figure 3.
DNA gaping propensities, measured in terms of the distances between the centers of base pairs separated by a full (78-bp) superhelical turn, in representative under- and overtwisted nucleosome structures. (a) Average inter-gyre distances, in Ångströms, for nucleosome groups V (undertwisted) and VII (under- and overtwisted) shown respectively by green and gold centerlines. Shaded regions mark the 10th and 90th percentiles of values in each group; (b) Molecular close-ups of the DNA gyre separation in the vicinity of locations −47 and +31 (left) and −21 and +57 (right), with base-pair centers depicted by spheres and DNA backbones by thin lines. Nucleosomes are aligned as in Figure 1a,b, and assigned the same color-coding as the distance plots. The leading strand of each structure is shown in a darker hue and the directions toward the entry and exit base pairs are noted.
Figure 4.
Figure 4.
Influence of nucleosomal twist on the orientation of successive nucleosomes in Monte Carlo simulated 12-mer nucleosome arrays. (a) Distribution of the torsion angle ϕ, in degrees, described by the cylindrical axis of each nucleosome and the axis connecting their centers (top inset). Nucleosome pairs selected from the central regions of simulated arrays with 172- or 177-bp spacing. Graphs are labeled in terms of the rigid pathway used to model the nucleosomal DNA, undertwisted (pdb file 1kx5 [25]) and overtwisted (pdb file 5b0z [47]), and the length of the deformable DNA spacers. Average values for 172-bp arrays bearing undertwisted and overtwisted nucleosomes are −144° and −75°, respectively. The corresponding values in arrays with 177-bp spacing are 28° and 97°; (b) Three-dimensional representations of successive dimers constructed from the average base-pair step parameters of the deformable protein-free linkers and the fixed nucleosome geometry in each simulated array. The histone core is shown as a light gray cylinder, with the top shown in blue to note the orientation in space. DNA is depicted as a thin tube connecting the base-pair centers. All four dimer configurations are aligned in a common frame on the first nucleosome.
Figure 5.
Figure 5.
Effect of nucleosomal twist on the configurations of Monte Carlo simulated nucleosome arrays. (a) Distribution of the sedimentation coefficients s computed from simulated ensembles of 12-mer arrays with 172-bp spacing built from a mix of undertwisted (pdb file 1kx5 [25]) and overtwisted (pdb file 5b0z [47]) nucleosome pathways. The color intensity indicates the number of overtwisted (top) or undertwisted (bottom) nucleosomes incorporated respectively into an array of otherwise undertwisted or overtwisted nucleosomes. Dashed vertical lines denote the values of s20°,w observed in ultracentrifgation studies [50]. (b) Three-dimensional configurations of nucleosome arrays constructed from the ensemble-averaged base-pair step parameters of the deformable protein-free DNA linkers, and the fixed nucleosome geometry in each simulated array. Nucleosomes are depicted as cylinders and color-coded in light green and gold for the undertwisted (1kx5) and overtwisted (5b0z) models, respectively. See the widely ranging configurations that contribute to these simplified, static images in Videos S2 and S3. (c) Frequency of intra-chain nucleosome contacts for the nucleosome arrays described in part (a). The horizontal axis denotes the nucleosome separation, where 1 indicates immediate neighbors, and so on. The contact frequency shown in the vertical axis is the measure introduced in [32, 59].
Figure 6.
Figure 6.
Effect of nucleosomal twist on the energy-optimized configurations of 359-bp DNA minicircles bearing a 141-bp rigid nucleosomal DNA fragment from different groupings of high-resolution structures. (a) Illustration of the out-of-plane rotation angle γ formed by the base-pair normal at the midpoint of the protein-free DNA loop with the plane containing the starting point, mid-point, and end-point of the loop (colored blocks); (b) Scatter plot of the optimized loop energy per base-pair step, in units of kBT, vs. the angle γ, in degrees, for topoisomers with linking number Lk 33 (undertwisted groups III and V in purple and green, respectively, and overtwisted group VI in gold). Smooth curves on the edges of the scatter plot are the relative densities of individual parameters for each set of data; (c) Probabilities of occurrence of minor topoisomers (Lk 32 or 34) of minicircles found for the different groupings; (d) Schematics of optimized minicircles of specified linking number bearing nucleosome pathways representative of each structural grouping (pdb files 1aoi [24], 1kx5 [25], 5b0z [47] from groups III, V, VI, respectively).
Figure 7.
Figure 7.
Effect of symmetric nucleosome ‘breathing’ on the energy-optimized configurations of 359-bp DNA minicircles bearing nucleosomal DNA fragments representative of three groupings of high-resolution structures. (a) Variation in the writhing number Wr, as a function of the degree of breathing, in minicircles of Lk 33; (b) Influence of the same levels of breathing on the average linking number 〈Lk〉 of all low-energy topoisomers, with breathing described in terms of either the number of DNA base pairs constrained on the nucleosome (upper label) or the number of base pairs peeled from both ends of the assembly (lower label); (c) Schematics illustrating the transitions between opened and closed states as DNA is unwrapped in Lk 33 topoisomers bearing different nucleosome structures (left) and the ~50:50 mix of topoisomers found when 10 bp are peeled off both ends of the overtwisted nucleosome (right). The cyan lines in (a) and (b) denote the degree of peeling associated with the structures shown in (c). See the legend to Figure 6.

Similar articles

Cited by

References

    1. Zaret KS (2020). Pioneer transcription factors initiating gene network changes Annu Rev Genet 54, 367–385. - PMC - PubMed
    1. Polach KJ & Widom J (1995). Mechanism of protein access to specific DNA sequences in chromatin: a dynamic equilibrium model for gene regulation. J. Mol. Biol 254, 130–149. - PubMed
    1. Chen Y, Tokuda JM, Topping T, Meisburger SP, Pabit SA, Gloss LM, et al. (2017). Asymmetric unwrapping of nucleosomal DNA propagates asymmetric opening and dissociation of the histone core. Proc. Natl. Acad. Sci., USA 114, 334–339. - PMC - PubMed
    1. Mohapatra S, Lin C-T, Feng XA, Basu A & Ha T (2020). Single-molecule analysis and engineering of DNA motors. Chem. Rev 120, 36–78. - PubMed
    1. Cui Y & Bustamante C (2000). Pulling a single chromatin fiber reveals the forces that maintain its higher-order structure. Proc. Natl. Acad. Sci., USA 97, 127–132. - PMC - PubMed

Publication types

LinkOut - more resources