Observational Study
. 2021 Aug;596(7872):417-422.
doi: 10.1038/s41586-021-03739-1. Epub 2021 Jun 30.

Age-related immune response heterogeneity to SARS-CoV-2 vaccine BNT162b2

Collaborators, Affiliations
Observational Study

Age-related immune response heterogeneity to SARS-CoV-2 vaccine BNT162b2

Dami A Collier et al. Nature. 2021 Aug.

Abstract

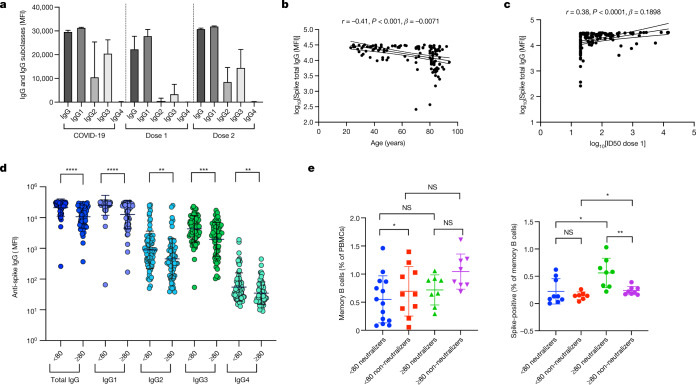
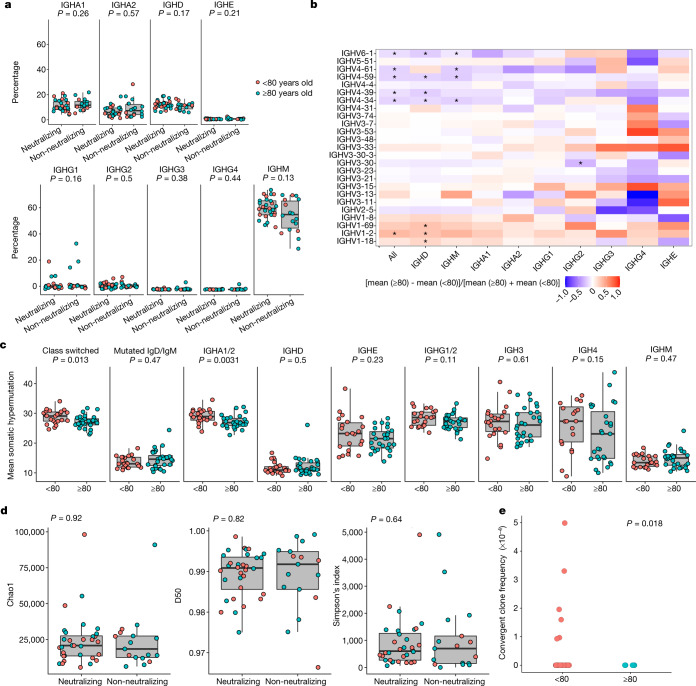
Although two-dose mRNA vaccination provides excellent protection against SARS-CoV-2, there is little information about vaccine efficacy against variants of concern (VOC) in individuals above eighty years of age1. Here we analysed immune responses following vaccination with the BNT162b2 mRNA vaccine2 in elderly participants and younger healthcare workers. Serum neutralization and levels of binding IgG or IgA after the first vaccine dose were lower in older individuals, with a marked drop in participants over eighty years old. Sera from participants above eighty showed lower neutralization potency against the B.1.1.7 (Alpha), B.1.351 (Beta) and P.1. (Gamma) VOC than against the wild-type virus and were more likely to lack any neutralization against VOC following the first dose. However, following the second dose, neutralization against VOC was detectable regardless of age. The frequency of SARS-CoV-2 spike-specific memory B cells was higher in elderly responders (whose serum showed neutralization activity) than in non-responders after the first dose. Elderly participants showed a clear reduction in somatic hypermutation of class-switched cells. The production of interferon-γ and interleukin-2 by SARS-CoV-2 spike-specific T cells was lower in older participants, and both cytokines were secreted primarily by CD4 T cells. We conclude that the elderly are a high-risk population and that specific measures to boost vaccine responses in this population are warranted, particularly where variants of concern are circulating.


Conflict of interest statement

The authors declare no competing interests.

Figures

Fig. 1
Fig. 1. SARS-CoV-2 neutralization by sera from BNT162b2 vaccinated individuals.
a, Proportion of individuals with detectable serum neutralization of PV after the first dose of Pfizer BNT162b2 vaccine by age. Cut-off for serum neutralization is an inhibitory dilution at which 50% inhibition of infection is achieved (ID50) of 20. Shading, 95% CI. b, Serum neutralization of PV after dose 1 (blue) and dose 2 (red) by age group (<80 years (n = 79), ≥ 80 years (n = 59)). c, Neutralization curves for serum from two individuals (ID 4 and ID 8) with lower responses after the first dose (blue) and increased neutralization activity after the second dose (red) of BNT162b2 against pseudovirus expressing wild-type spike protein (D614G). Data shown as mean ± s.e.m. of technical replicates. d, f, Neutralization of SARS-CoV-2 VOCs by sera after dose 1 (d) and dose 2 (f) of BNT162b2. d, WT, n = 138; B.1.1.7, n = 135; B.1.351, n = 82; P.1, n = 82. f, WT, n = 64; B.1.1.7, n = 53; B.1.351, n = 32; P.1, n = 32. Data shown as GMT ± s.d. e, g, The proportion of participant vaccine sera with neutralization activity against wild-type and mutant spike proteins after dose 1 (e) and dose 2 (g) (ID50 > 1 in 20 dilution of sera). GMT ± s.d. are representative of two independent experiments each with two technical repeats. Mann–Whitney test was used for unpaired comparisons and Wilcoxon matched-pairs signed rank test for paired comparisons. *P < 0.05, **P < 0.01, ****P < 0.0001; NS, not significant. HS, human AB serum control.
Fig. 2
Fig. 2. SARS-CoV-2 spike-binding antibody responses and SARS-CoV-2 spike-specific memory B cells in blood following vaccination with BNT162b2.
a, Total anti-spike IgG and subclasses after first and second doses of vaccine and in individuals with prior COVID-19. MFI, mean fluorescence intensity. b, Pearson’s correlation (r) between anti-spike IgG binding antibody responses after first dose and age (n = 134). c, Pearson’s correlation between anti-spike IgG (n = 134) binding antibody responses and neutralization by sera against SARS-CoV-2 in a spike lentiviral pseudotyping assay expressing wild-type spike (D614G). d, Anti-spike IgG subclass responses to first dose vaccine stratified by age (<80 and ≥80 years). e, CD19+ memory B cells (left, as percentage of PBMCs) and SARS-CoV-2 spike-specific CD19+IgG+IgM memory B cells (right, as percentage of all memory B cells) from FACS-sorted PBMCs. n = 16 for ≥80 years, n = 16 for <80 years; stratified by neutralizing response after first dose, n = 8 in each category. MFI – mean fluorescence intensity. Mann–Whitney test was used for unpaired comparisons. *P < 0.05, **P < 0.01, ***P < 0.001, ****P < 0.0001; NS, not significant. Scatter plots show linear correlation line bounded by 95% CI; β, slope/regression coefficient. Error bars, s.d.
Fig. 3
Fig. 3. B cell repertoire following vaccination with first dose of BNT162b2.
a, Isotype usage according to unique VDJ sequence in participants <80 (n = 22) or ≥80 years old (n = 28) and association with neutralization of spike pseudotyped virus. Neutralization cut-off for 50% neutralization was set at 20. Mann–Whitney U-test. b, Heat map showing differences in V gene usage between the <80 and ≥80 groups. Mann–Whitney U-test with Benjamini–Hochberg false discovery rate (FDR) correction; *P < 0.1. c, Mean somatic hypermutation for participants <80 or ≥80 years old, grouped according to isotype class. Mann–Whitney U-test. d, Diversity indices for neutralizing and non-neutralizing groups. The inverse is depicted for Simpson’s index. t-test. e, BCR comparison of patients in the two age groups for the first 50 days after vaccination (<80, n = 27; ≥80, n = 5) with public clones known to be associated with SARS-CoV-2 using the CoV-AbDab database. Clones from participants and the database were co-clustered based on matching IGHV and IGHJ segments, matching CDR-H3 region length and 85% CDR-H3 sequence amino acid homology. One-sided t-test. For boxplots: centre line, median; box, 25th–75th percentile; whiskers, 1.5× IQR.
Fig. 4
Fig. 4. T cell responses to BNT162b2 vaccine after the first and second doses.
a, b, FluoroSpot analysis by age for IFNγ (a) and IL-2 (b) T cell responses specific to SARS-CoV-2 spike protein peptide pool following PBMC stimulation. SFU, spot-forming units. Scatter plots show linear correlation line bounded by 95% CI; β, slope/regression coefficient. c, d, FluoroSpot analysis for IFNγ (c) and IL-2 (d) T cell responses specific to SARS-CoV-2 spike protein peptide pool following stimulation of unexposed PBMCs (stored PBMCs from 2014–2016, n = 20) and PBMCs from vaccinated individuals (<80 IFNγ, n = 46; <80 IL-2, n = 44; ≥80 IFNγ, n = 35; ≥80 IL-2, n = 27) three weeks or more after the first dose of BNT162b2. e, f, FluoroSpot analysis for IFNγ (e) and IL-2 (f) T cell responses specific to SARS-CoV-2 spike protein peptide pool following stimulation of unexposed PBMCs (n = 20) and PBMCs from vaccinated individuals three weeks after the first or second dose (first dose: <80 IFNγ, n = 46; <80 IL-2, n = 45; ≥80 IFNγ, n = 31; ≥80 IL-2, n = 19; second dose: <80 IFNγ, n = 15; <80 IL-2, n = 15; ≥80 IFNγ, n = 24; ≥80 IL-2, n = 24). g, h, FluoroSpot analysis for IL-2 (g) and IFNγ (h) CD4 and CD8 T cell responses specific to SARS-CoV-2 spike protein peptide pool following stimulation after column-based PBMC separation. Mann–Whitney test was used for unpaired comparisons and Wilcoxon matched-pairs signed rank test for paired comparisons. *P < 0.05, ***P < 0.001, ****P < 0.0001; NS, not significant. Error bars, s.d.
Extended Data Fig. 1
Extended Data Fig. 1. Study flow diagram for samples and analyses.
n values are shown for each analysis.
Extended Data Fig. 2
Extended Data Fig. 2. SARS-CoV-2 neutralization by serum from individuals vaccinated with Pfizer BNT162b2 vaccine.
a, Linear correlation of live virus neutralization with SARS-CoV-2 spike PV neutralization for 13 sera from individuals vaccinated with BNT162b2. Linear regression line plotted bounded by 95% CI. b, SARS-CoV-2 PV neutralization by sera from individuals vaccinated with first dose of BNT162b2 (n = 140) plotted against time since first dose. c, Correlation of SARS-CoV-2 neutralization by sera from individuals vaccinated with BNT162b2 with age. Serum neutralization of spike (D614G) pseudotyped lentiviral particles (ID50) after dose 1 (top, n = 138) or dose 2 (bottom, n = 64) by age. Linear regression line plotted bounded by 95% CI. Bonferroni adjustment was made for multiple comparisons in linear regression. d, ID50 against wild-type (D614G) PV following the second dose of vaccine stratified by age and interval between vaccine doses (3 weeks (n = 21) and 12 weeks (n = 43)). GMT ± s.d., Mann–Whitney test. e, Spike mutations in VOCs, along with number of sequences in GISAID database.
Extended Data Fig. 3
Extended Data Fig. 3. Binding IgG and IgA spike antibody responses following BNT162b2 vaccination.
a, Correlations between serum binding IgG subclass 1–4 antibody responses following vaccination with first dose of BNT162b2 and age in years (n = 133). b, Correlations between serum binding IgG subclass 1–4 antibody responses following vaccination with first dose of BNT162b2 and serum neutralization using a PV system (n = 133). c, IgA responses to spike, nucleocapsid and RBD after first dose (light green, n = 133) and second dose (dark green, n = 21) compared to individuals with prior infection (red, n = 18) and negative controls (grey, n = 18) at serum dilution of 1 in 100. d, Correlations between serum binding IgA spike antibody responses following vaccination with first dose of BNT162b2 and serum neutralization using a PV system (n = 133). Bonferroni adjustment was made for multiple comparisons. Spike proteins tested are Wuhan-1 with D614G (WT). Linear regression lines plotted bounded by 95% CI.
Extended Data Fig. 4
Extended Data Fig. 4. Peripheral blood lymphocyte subsets following first dose of BNT162b2.
PBMCs were sorted by FACS (n = 16 above 80 years of age, n = 16 below 80 years of age). a, Gating strategy for flow cytometry analysis of human immune cells after vaccination. b, Data for indicated sorted cell subsets stratified by neutralizing response after first dose (n = 8 in each category). NK cells, natural killer cells; Treg cells, regulatory T cells. Error bars, s.d.
Extended Data Fig. 5
Extended Data Fig. 5. B cell repertoire following vaccination with first dose of BNT162b2.
a, Isotype usage according to unique VDJ sequence in <80-year-old (n = 22) and ≥80-year-old groups (n = 28). Differences between groups were calculated using Mann–Whitney U-test. b, V gene usage as a proportion, by neutralization of spike PV. Neutralization cut-off for 50% neutralization was set at 20. Differences between groups were calculated using Mann–Whitney U-test. c, Diversity indices comparing the two age groups. The inverse is depicted for Simpson’s index and the Shannon–Weiner index is normalized. Differences between groups were calculated using a t-test. For boxplots: centre line, median; box, 25th–75th percentile; whiskers, 1.5× IQR.
Extended Data Fig. 6
Extended Data Fig. 6. T cell responses following vaccination with BNT162b2.
Correlation between T cell responses against SARS-CoV-2 spike peptide pool and serum neutralization of spike (D614G) pseudotyped lentiviral particles (ID50). a, b, Correlation of IFNγ (a, n = 79) and IL-2 (b, n = 69) FluoroSpot and ID50 after first dose. Linear regression lines with 95% CI are plotted. Bonferroni adjustment was made for multiple comparisons. c, FluoroSpot IFNγ PBMC responses to peptide pool of CEF peptide pool. Responses from unexposed PBMCs (stored from 2014–2016, n = 20), <80 years group (n = 46) and ≥80 years group (n = 35) three weeks after the first dose of vaccine. d, e, FluoroSpot analysis for IFNγ (d) and IL-2 T cell responses (e) specific to SARS-CoV-2 spike protein peptide pool following stimulation of PBMCs from infected donors (n = 46), unexposed donors (n = 20) and vaccinated individuals three weeks or more after the first dose (IFNγ, n = 77; IL-2, n = 64) and three weeks after the second dose (IFNγ and IL-2, n = 39). fi, Human cytomegalovirus serostatus, T cell responses and serum neutralization of spike (D614G) pseudotyped lentiviral particles (ID50) after the first dose of vaccine. f, HCMV serostatus for <80- and ≥80-year age groups (n = 72). g, h, IFNγ (g, n = 72) and IL-2 (h, n = 64) FluoroSpot responses after the first dose. i, ID50 after the first dose by CMV serostatus. Error bars, s.d.
Extended Data Fig. 7
Extended Data Fig. 7. Autoantibodies and inflammatory markers in participants who received at least one dose of the BNT162b2 vaccine and relationship to SARS-CoV-2 spike-specific IgG and SARS-CoV-2 PV neutralization.
n = 101. a, Heatmap of log2-transformed fluorescence intensity of 19 autoantibodies; red, positive; blue, negative. b, Age (mean ± s.d.) in years by anti-MPO antibody-positive (red) or -negative (blue) status. c, IgG subclass responses to spike after first dose of BNT162b2 vaccine in individuals with or without anti-MPO antibodies (n = 100). d, GMT ± s.d of sera from individuals after their first dose of vaccine against wild-type and B.1.1.7 spike mutant SARS-CoV-2 PVs by anti-MPO antibody status. e, Nonparametric rank correlation (Kendall’s tau-b) of wild-type (WT) PV neutralization, variant (B.1.17) PV neutralization and age (<80 or ≥80 years) against each of 53 cytokines or chemokines. Heatmaps illustrate Tau-b statistic (left) and significance (right, –log10FDR).

References

    1. Walsh, E. E. et al. Safety and immunogenicity of two RNA-based Covid-19 vaccine candidates. N. Engl. J. Med. 383, 2439–2450 (2020). 10.1056/NEJMoa2027906 - DOI - PMC - PubMed
    1. Polack, F. P. et al. Safety and efficacy of the BNT162b2 mRNA Covid-19 vaccine. N. Engl. J. Med. 383, 2603–2615 (2020). 10.1056/NEJMoa2034577 - DOI - PMC - PubMed
    1. Baden, L. R. et al. Efficacy and safety of the mRNA-1273 SARS-CoV-2 vaccine. N. Engl. J. Med. 384, 403–416 (2021). 10.1056/NEJMoa2035389 - DOI - PMC - PubMed
    1. Khoury, D. S. et al. Neutralizing antibody levels are highly predictive of immune protection from symptomatic SARS-CoV-2 infection. Nat. Med. 10.1038/s41591-021-01377-8 (2021). 10.1038/s41591-021-01377-8 - DOI - PubMed
    1. Israelow, B. et al. Adaptive immune determinants of viral clearance and protection in mouse models of SARS-CoV-2. Preprint at 10.1101/2021.05.19.444825 (2021). - PMC - PubMed

Publication types

MeSH terms