. 2021 Jun 30;7(27):eabh3032.
doi: 10.1126/sciadv.abh3032. Print 2021 Jun.

Identification of SARS-CoV-2-induced pathways reveals drug repurposing strategies

Affiliations

Identification of SARS-CoV-2-induced pathways reveals drug repurposing strategies

Namshik Han et al. Sci Adv. .

Abstract

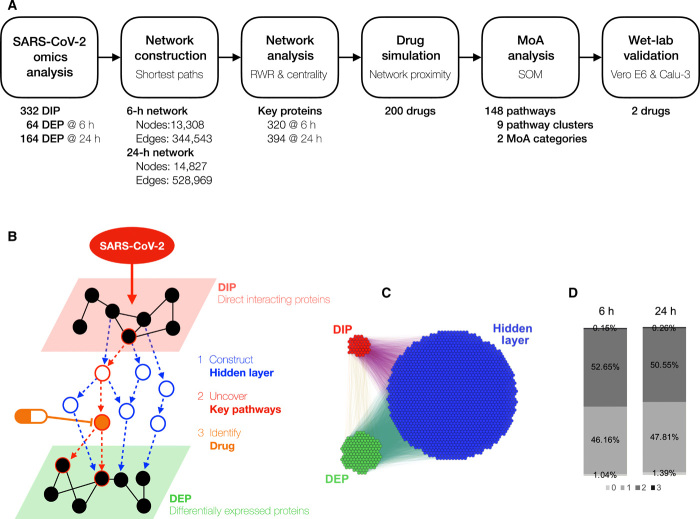
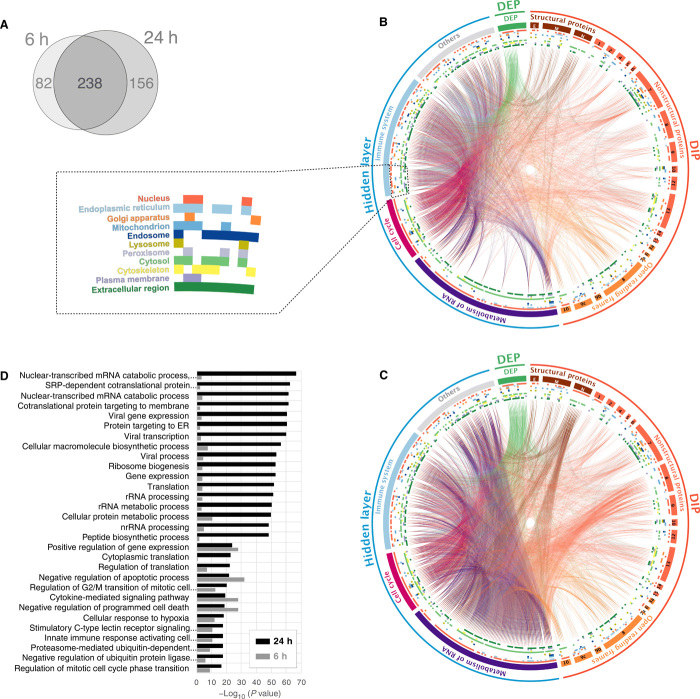
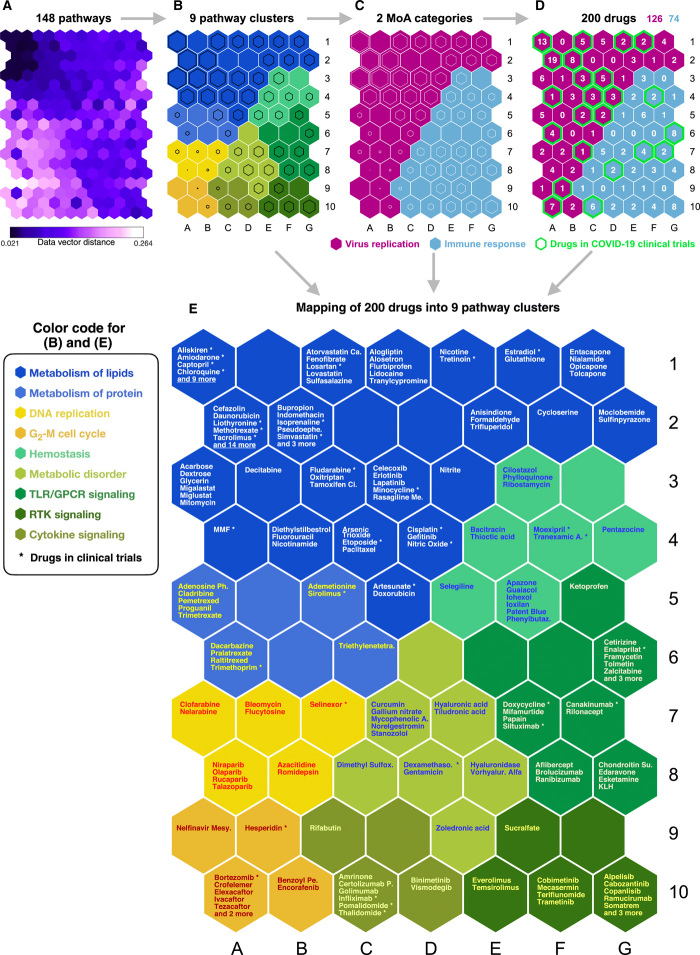
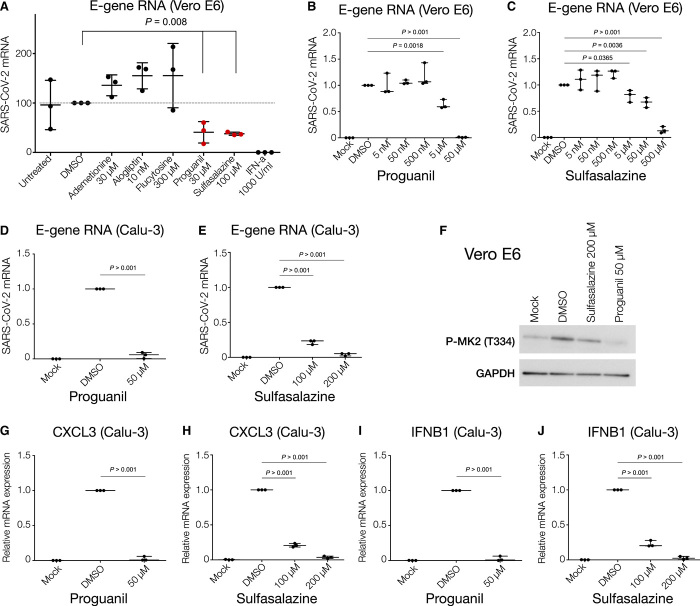
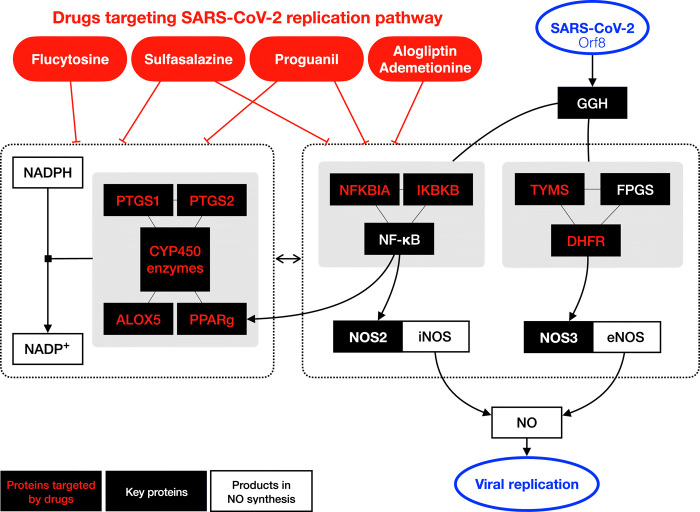
The global outbreak of severe acute respiratory syndrome coronavirus 2 (SARS-CoV-2) necessitates the rapid development of new therapies against coronavirus disease 2019 (COVID-19) infection. Here, we present the identification of 200 approved drugs, appropriate for repurposing against COVID-19. We constructed a SARS-CoV-2-induced protein network, based on disease signatures defined by COVID-19 multiomics datasets, and cross-examined these pathways against approved drugs. This analysis identified 200 drugs predicted to target SARS-CoV-2-induced pathways, 40 of which are already in COVID-19 clinical trials, testifying to the validity of the approach. Using artificial neural network analysis, we classified these 200 drugs into nine distinct pathways, within two overarching mechanisms of action (MoAs): viral replication (126) and immune response (74). Two drugs (proguanil and sulfasalazine) implicated in viral replication were shown to inhibit replication in cell assays. This unbiased and validated analysis opens new avenues for the rapid repurposing of approved drugs into clinical trials.


Figures

Fig. 1
Fig. 1. Construction of a SIP network.
(A) Overview and workflow of the in silico drug repurposing pipeline. (B) Schematic depicts our strategy of constructing a SIP hidden network through data integration and network construction of DIPs and DEPs, followed by identification of drugs that target key pathways in this network. (C) The SARS-CoV-2 Orf8 subnetwork shows the extent of the hidden layer that is revealed through the network analysis. (D) Percentage of the shortest paths between the DIP and DEP that are via zero to three proteins at 6 hours versus 24 hours.
Fig. 2
Fig. 2. SARS-CoV-2 viral protein subnetwork analysis shows an enrichment of viral replication pathways.
(A) Venn diagram of key proteins in 6- and 24-hour SIP networks. (B) A circos plot depicting interactions between DIPs and DEPs revealed through the SIP network at 6 hours after infection. DIPs were subdivided into the genomic organization of SARS-CoV-2. Proteins in the hidden layer were also subdivided into major pathways. Inner colored circles demonstrate the subcellular localization of the proteins, and details are shown in the dotted box. The colored lines show PPI. (C) Twenty-four hours after infection. (D) Top 30 enriched GO terms of the key proteins in the SIP network at 24 hours (black). The enrichment P values of 30 terms at 6 hours are also shown as a control (gray).
Fig. 3
Fig. 3. Machine learning predicts MoAs for the 200 drug repurposing candidates.
(A) U-matrix is shown of the trained unsupervised SOM used to analyze the relationship between the 200 drugs and the 148 key pathways. This contains the distance (similarity) between the neighboring SOM neurons (pathways) and shows data density (drug-pathway association scores) in input space. Each hexagon is colored according to distance between corresponding data vectors of neighbor neurons, with low-distance areas (dark purple) indicating high data density (clusters). Each smaller hexagon on the U-matrix (A) indicates the data vector distance between larger hexagons in the SOM cluster arrangements (B to E). Thus, a smaller hexagon on the U-matrix corresponds to every adjacent larger hexagon on the SOM cluster arrangements (B to E). (B) The selected clustering arrangement was based on the U-matrix and DBI to separate the 148 key pathways into nine clusters. The names of nine clusters are shown in the figure. Clusters of each SOM neuron are distinguishable by color. The size of the black hexagon in each neuron indicates distance. Larger hexagons have a low distance to neighboring neurons, hence forming a stronger cluster with neighbors. (C) Two MoA categories were identified on the basis of the pathway clustering and the drug mapping. (D) Mapping of the 200 identified drugs to each neuron (pathway) based on matching rates and inspection of examples from each cluster. (E) SOM component map shows mapping results of the 200 drugs into nine pathway clusters. The names of the nine clusters are shown in the figure, and the drugs with asterisk are already in COVID-19 clinical trials.
Fig. 4
Fig. 4. Proguanil and sulfasalazine reduce SARS-CoV-2 replication and p38/MAPK signaling activity.
(A) RT-qPCR analysis of the indicated mRNA (envelope, E-protein) from Vero E6 cells pretreated with the indicated drugs and concentrations for 3 hours before infection with SARS-CoV-2 for 24 hours. Student’s t test. Means + SD of three independent replicates are shown. (B and C) RT-qPCR analysis of indicated mRNA (envelope, E-protein) from Vero E6 cells pretreated with proguanil or sulfasalazine at indicated concentrations for 3 hours before infection with SARS-CoV-2 for 24 hours. Student’s t test. Means + SD of three independent replicates are shown. (D and E) RT-qPCR analysis of indicated mRNA (envelope, E-protein) from Calu-3 cells pretreated with proguanil or sulfasalazine at indicated concentrations for 3 hours before infection with SARS-CoV-2 for 24 hours. Student’s t test. Means + SD of three independent replicates are shown. (F) Western blot analysis of phosphorylated MAPKAPK2 (Thr334) in mock-, DMSO-, sulfasalazine-, or proguanil-treated Vero E6 cells at indicated concentrations for 3 hours before infection with SARS-CoV-2 for 24 hours. (G to J) RT-qPCR analysis of the indicated mRNAs from Calu-3 cells pretreated with proguanil or sulfasalazine at indicated concentrations for 3 hours before infection with SARS-CoV-2 for 24 hours. Student’s t test. Means + SD of three independent replicates are shown.
Fig. 5
Fig. 5. Schematics depicting the pathways mediating NO production that are targeted by the five tested drugs.
The black boxes indicate key proteins in SIP network, and those targeted by the five drugs are highlighted in red color. Sulfasalazine and proguanil target proteins in both pathways that directly and indirectly (via NADP production) affect NO production (–61).

References

    1. Gordon D. E., Jang G. M., Bouhaddou M., Xu J., Obernier K., White K. M., O’Meara M. J., Rezelj V. V., Guo J. Z., Swaney D. L., Tummino T. A., Hüttenhain R., Kaake R. M., Richards A. L., Tutuncuoglu B., Foussard H., Batra J., Haas K., Modak M., Kim M., Haas P., Polacco B. J., Braberg H., Fabius J. M., Eckhardt M., Soucheray M., Bennett M. J., Cakir M., McGregor M. J., Li Q., Meyer B., Roesch F., Vallet T., Kain A. M., Miorin L., Moreno E., Naing Z. Z. C., Zhou Y., Peng S., Shi Y., Zhang Z., Shen W., Kirby I. T., Melnyk J. E., Chorba J. S., Lou K., Dai S. A., Barrio-Hernandez I., Memon D., Hernandez-Armenta C., Lyu J., Mathy C. J. P., Perica T., Pilla K. B., Ganesan S. J., Saltzberg D. J., Rakesh R., Liu X., Rosenthal S. B., Calviello L., Venkataramanan S., Liboy-Lugo J., Lin Y., Huang X.-P., Liu Y., Wankowicz S. A., Bohn M., Safari M., Ugur F. S., Koh C., Savar N. S., Tran Q. D., Shengjuler D., Fletcher S. J., O’Neal M. C., Cai Y., Chang J. C. J., Broadhurst D. J., Klippsten S., Sharp P. P., Wenzell N. A., Kuzuoglu-Ozturk D., Wang H.-Y., Trenker R., Young J. M., Cavero D. A., Hiatt J., Roth T. L., Rathore U., Subramanian A., Noack J., Hubert M., Stroud R. M., Frankel A. D., Rosenberg O. S., Verba K. A., Agard D. A., Ott M., Emerman M., Jura N., von Zastrow M., Verdin E., Ashworth A., Schwartz O., D’Enfert C., Mukherjee S., Jacobson M., Malik H. S., Fujimori D. G., Ideker T., Craik C. S., Floor S. N., Fraser J. S., Gross J. D., Sali A., Roth B. L., Ruggero D., Taunton J., Kortemme T., Beltrao P., Vignuzzi M., García-Sastre A., Shokat K. M., Shoichet B. K., Krogan N. J., A SARS-CoV-2 protein interaction map reveals targets for drug repurposing. Nature 583, 459–468 (2020). - PMC - PubMed
    1. Bojkova D., Klann K., Koch B., Widera M., Krause D., Ciesek S., Cinatl J., Münch C., Proteomics of SARS-CoV-2-infected host cells reveals therapy targets. Nature 583, 469–472 (2020). - PMC - PubMed
    1. Blanco-Melo D., Nilsson-Payant B. E., Liu W.-C., Uhl S., Hoagland D., Møller R., Jordan T. X., Oishi K., Panis M., Sachs D., Wang T. T., Schwartz R. E., Lim J. K., Albrecht R. A., tenOever B. R., Imbalanced host response to SARS-CoV-2 drives development of COVID-19. Cell 181, 1036–1045.e9 (2020). - PMC - PubMed
    1. Kaufmann S. H. E., Dorhoi A., Hotchkiss R. S., Bartenschlager R., Host-directed therapies for bacterial and viral infections. Nat. Rev. Drug Discov. 17, 35–56 (2018). - PMC - PubMed
    1. Szklarczyk D., Gable A. L., Lyon D., Junge A., Wyder S., Huerta-Cepas J., Simonovic M., Doncheva N. T., Morris J. H., Bork P., Jensen L. J., von Mering C., STRING v11: Protein–protein association networks with increased coverage, supporting functional discovery in genome-wide experimental datasets. Nucleic Acids Res. 47, D607–D613 (2019). - PMC - PubMed

Publication types