. 2021 Jun 30;7(27):eabh3805.
doi: 10.1126/sciadv.abh3805. Print 2021 Jun.

Order and disorder-An integrative structure of the full-length human growth hormone receptor

Affiliations

Order and disorder-An integrative structure of the full-length human growth hormone receptor

Noah Kassem et al. Sci Adv. .

Abstract

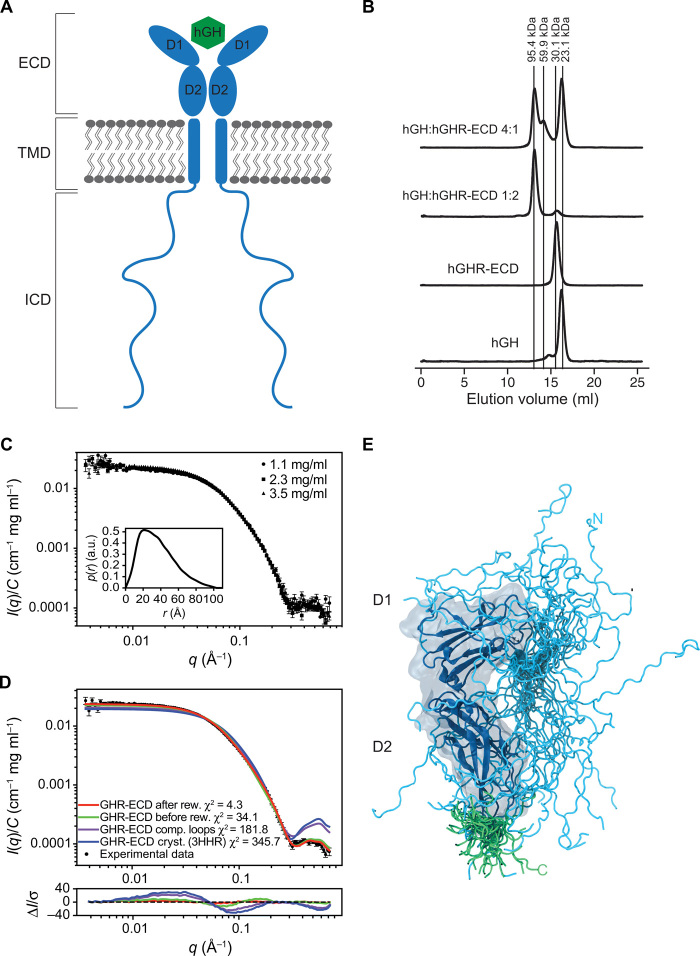
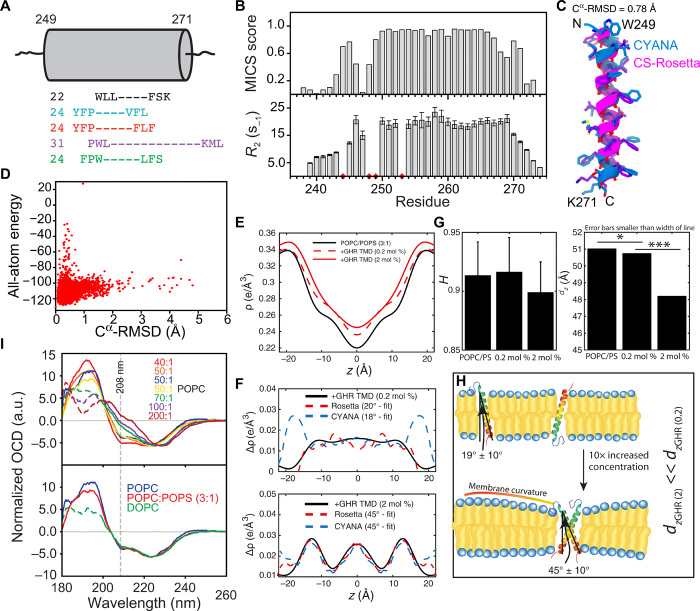
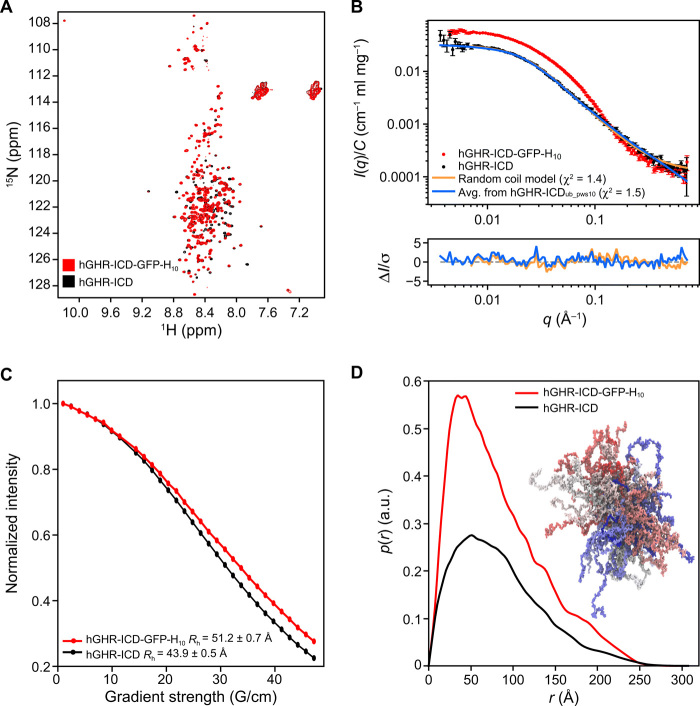
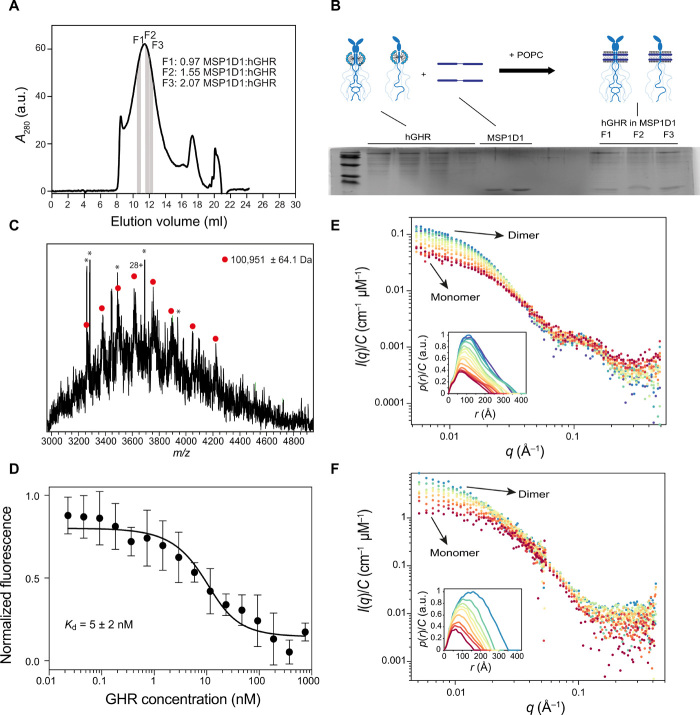
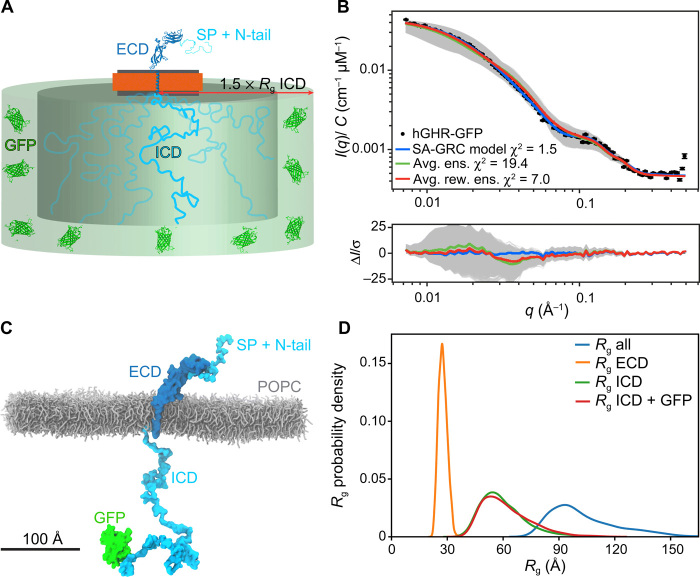
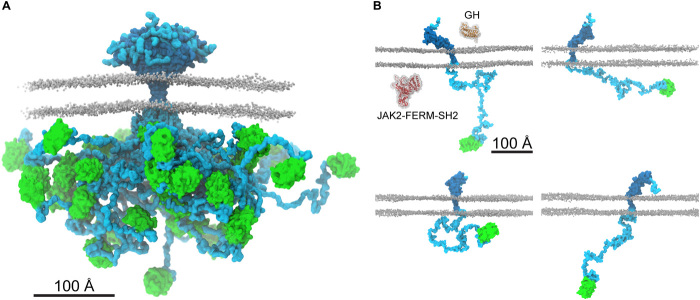
Because of its small size (70 kilodalton) and large content of structural disorder (>50%), the human growth hormone receptor (hGHR) falls between the cracks of conventional high-resolution structural biology methods. Here, we study the structure of the full-length hGHR in nanodiscs with small-angle x-ray scattering (SAXS) as the foundation. We develop an approach that combines SAXS, x-ray diffraction, and NMR spectroscopy data obtained on individual domains and integrate these through molecular dynamics simulations to interpret SAXS data on the full-length hGHR in nanodiscs. The hGHR domains reorient freely, resulting in a broad structural ensemble, emphasizing the need to take an ensemble view on signaling of relevance to disease states. The structure provides the first experimental model of any full-length cytokine receptor in a lipid membrane and exemplifies how integrating experimental data from several techniques computationally may access structures of membrane proteins with long, disordered regions, a widespread phenomenon in biology.


Figures

Fig. 1
Fig. 1. The hGHR has a dynamic ECD with a broad structural ensemble.
(A) A schematic representation of homodimeric hGHR (blue) in the membrane in complex with hGH (green). ECD, Extracellular domain; TMD, transmembrane domain; and ICD, intracellular domain. (B) SEC profiles of hGHR-ECD and hGH in 20 mM Na2HPO4/NaH2PO4 (pH 7.4) and 150 mM NaCl at ratios 1:0 (hGH:hGHRECD 1:0), 0:1 (hGH:hGHR-ECD 0:1), 1:2 (hGH:hGHR-ECD 1:2), and 4:1 (hGH:hGHR-ECD 4:1). Absorption was measured at 280 nm. (C) Concentration-normalized SAXS data from hGHR-ECD (concentrations in legend) with the p(r) from the sample (3.5 mg/ml) shown as inset. a.u., absorbance units. (D) SAXS data from hGHR-ECD at 3.5 mg/ml (black dots) together with fits of the theoretical scattering curves from a crystal structure of hGRH-ECD (blue; PDB 3HHR), the same crystal structure with missing loops completed (purple), and the average (green) and reweighted average [red; reweighted against the experimental data using the Bayesian maximum entropy approach (see Materials and Methods)] of scattering curves of the 500 hGHR-ECD models with added N- and C-terminal tails. Residuals are plotted below. (E) An ensemble model of the hGHR-ECD with a representative reweighted subensemble of 100 models highlighting the N-terminal (cyan) and C-terminal (green) dynamic tails.
Fig. 2
Fig. 2. The single-pass α-helical hGHR-TMD.
(A) Extent of the hGHR-TMD α helix by NMR (black), TMHMM (blue), Phobius (red), METSAT-SVM (purple), and UniProt (green) (fig. S2). Cylinder represents length of the hGHR-TMD α helix by NMR with the first and last helical residue numbered. (Left) Predicted numbers. (B) MICS α helix probability (top) and R2 relaxation rates (bottom) of hGHR-TMD in DHPC micelles. Red diamonds, insufficient data quality or prolines. (C) Models of hGHR-TMD α helix by CYANA (blue) or CS-Rosetta (magenta). (D) Energy versus Cα-RMSD from CS-Rosetta modeling of hGHR-TMD. (E) Electron density profiles (EDPs) of lipid bilayers [POPC:POPS 3:1 mole percent (mol %)] with hGHR-TMD at 0.2 and 2 mol %, respectively. (F) Difference EDPs and best-fit profiles for the hGHR-TMD CS-Rosetta and the CYANA models, respectively. (G) Hermans orientation (left) and Lamellar spacing (right) of membranes at varying concentrations of hGHR-TMD. *, onefold change; ***, threefold change. (H) Illustration of membrane curvature. (I) Top: Oriented CD (OCD) spectra of 6 μg of hGHR-TMD in POPC, with L:P ratios varied from 1:40 to 1:200. Bottom: OCD spectra of 6 μg of hGHR-TMD in POPC, POPC:POPS (3:1), or DOPC at an L:P ratio of 50:1. The dashed lines represent nonreliable data due to too high high-tension voltage values.
Fig. 3
Fig. 3. Properties of the hGHR-ICD ensemble.
(A) 1H-15N-HSQC spectra at 5°C of hGHR-ICD (black) and hGHR-ICD-GFP-H10 (red) at 150 and 100 μM, respectively. (B) Concentration normalized SAXS data from hGHR-ICD (black dots; 1.1 mg/ml) and hGHR-ICD-GFP-H10 (red dots; 2.2 mg/ml). Fits to the data are shown for a Gaussian random coil model (orange) and from averaged scattering profiles from 5200 conformations taken from the hGHR-ICDub_pws10 simulation (one every nanosecond) (blue). Residuals are plotted below. (C) RH of hGHR-ICD and hGHR-ICD-GFP-H10 determined from pulse-field gradient NMR. Signal decays of hGHR-ICD (black) and hGHR-ICD-GFP-H10 (red) are shown as a function of gradient strength together with the corresponding fits. (D) Concentration normalized p(r)’s derived from the above SAXS data from hGHR-ICD (black) and hGHR-ICD-GFP-H10 (red). A subensemble of 200 conformations representative of the hGHR-ICDmetaD_pws10 simulation is shown in the right side of the plot.
Fig. 4
Fig. 4. Incorporation of hGHR-GFP into MSP1D1, functional, and structural analysis.
(A) SEC profile of hGHR-GFP-loaded MSP1D1. The areas highlighted in gray indicate fractions (F1 to F3) used for the SDS-PAGE analysis in (B). (B) SDS-PAGE analysis of hGHR-GFP and MSP1D1 standards along with hGHR-GFP-loaded MSP1D1. Fractions F1 to F3 were taken from the indicated positions of the SEC-purified hGHR-GFP-loaded MSP1D1 shown in (A). The illustration above the gel shows the stoichiometry of the hGHR-GFP-loaded MSP1D1. (C) Intact mass spectra of hGHR-GFP show a single protein population with an average mass of 100,951 ± 64 Da. Asterisks denote detergent peaks. (D) MST determination of equilibrium binding constants for hGH to hGHR-GFP-loaded MSP1D1. The mean values and SD were obtained by fitting a 1:1 binding model (full line) as described in Materials and Methods. Concentration-normalized (E) SAXS data and (F) SANS data of the nanodisc-embedded hGHR-GFP corresponding to the highlighted SEC frames in fig. S4 (C and D).
Fig. 5
Fig. 5. Model of the full-length hGHR-GFP in nanodiscs.
(A) Schematic representation of the semianalytical Gaussian random coil (SA-GRC) model. (B) Fits of the SA-GRC to the SAXS data of nanodisc-embedded hGHR-GFP (with GFP) (blue), the ensemble of 6000 conformations taken from the hGHR-GFP +POPCpws10 simulations embedded in the nanodisc model (gray), their ensemble average (green), and reweighted ensemble average (red). (C) Representative snapshot from one of the hGHR-GFP + POPCpws10 simulations (see Materials and Methods). POPC lipids are shown as gray sticks; protein is depicted in surface representation. Some lipids and all water and ions are omitted for clarity. (D) Distribution of Rg from 6000 all-atom conformations obtained from the hGHR-GFP + POPCpws10 simulation after reweighting against the SAXS data. The values are shown both for the full-length protein (blue) and for the individual structural components: ECD (orange), ICD (green), and ICD-GFP (red).
Fig. 6
Fig. 6. The ensemble structure of membrane-embedded full-length hGHR-GFP.
(A) Representative ensemble of conformations obtained from the last 1.5 μs of each of the 20 runs of 2-μs hGHR-GFP + POPCpws10 simulations. Color scheme and representations as in Fig. 5C. (B) Examples of the multitude of domain orientations of hGHR-GFP in the membrane. In the first panel, the structures of hGH (PDB 3HHR_A; orange) and of JAK2-FERM-SH2 (PDB 4Z32; red) are shown. Color scheme and representation of hGHR and POPC as in Fig. 5C.

Similar articles

Cited by

References

    1. Liongue C., Ward A. C., Evolution of Class I cytokine receptors. BMC Evol. Biol. 7, 120 (2007). - PMC - PubMed
    1. Madsen K., Friberg U., Roos P., Edén S., Isaksson O., Growth hormone stimulates the proliferation of cultured chondrocytes from rabbit ear and rat rib growth cartilage. Nature 304, 545–547 (2005). - PubMed
    1. Waters M. J., Brooks A. J., Growth hormone receptor: Structure function relationships. Horm. Res. Paediatr. 76, 12–16 (2011). - PubMed
    1. Yakar S., Rosen C. J., Beamer W. G., Ackert-Bicknell C. L., Wu Y., Liu J.-L., Ooi G. T., Setser J., Frystyk J., Boisclair Y. R., LeRoith D., Circulating levels of IGF-1 directly regulate bone growth and density. J. Clin. Invest. 110, 771–781 (2002). - PMC - PubMed
    1. Chhabra Y., Wong H. Y., Nikolajsen L. F., Steinocher H., Papadopulos A., Tunny K. A., Meunier F. A., Smith A. G., Kragelund B. B., Brooks A. J., Waters M. J., A growth hormone receptor SNP promotes lung cancer by impairment of SOCS2-mediated degradation. Oncogene 37, 489–501 (2018). - PMC - PubMed

Publication types