. 2021 Dec 1;11(12):3126-3141.
doi: 10.1158/2159-8290.CD-20-1652.

A Humanized Animal Model Predicts Clonal Evolution and Therapeutic Vulnerabilities in Myeloproliferative Neoplasms

Affiliations

A Humanized Animal Model Predicts Clonal Evolution and Therapeutic Vulnerabilities in Myeloproliferative Neoplasms

Hamza Celik et al. Cancer Discov. .

Abstract

Myeloproliferative neoplasms (MPN) are chronic blood diseases with significant morbidity and mortality. Although sequencing studies have elucidated the genetic mutations that drive these diseases, MPNs remain largely incurable with a significant proportion of patients progressing to rapidly fatal secondary acute myeloid leukemia (sAML). Therapeutic discovery has been hampered by the inability of genetically engineered mouse models to generate key human pathologies such as bone marrow fibrosis. To circumvent these limitations, here we present a humanized animal model of myelofibrosis (MF) patient-derived xenografts (PDX). These PDXs robustly engrafted patient cells that recapitulated the patient's genetic hierarchy and pathologies such as reticulin fibrosis and propagation of MPN-initiating stem cells. The model can select for engraftment of rare leukemic subclones to identify patients with MF at risk for sAML transformation and can be used as a platform for genetic target validation and therapeutic discovery. We present a novel but generalizable model to study human MPN biology.

Significance: Although the genetic events driving MPNs are well defined, therapeutic discovery has been hampered by the inability of murine models to replicate key patient pathologies. Here, we present a PDX system to model human myelofibrosis that reproduces human pathologies and is amenable to genetic and pharmacologic manipulation. This article is highlighted in the In This Issue feature, p. 2945.


Figures

Figure 1.
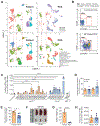
Figure 1.. Credentialing a Humanized Animal Model of Myelofibrosis.
A, X-ray guided intra-tibial injection of CD34+ cells from MF patients. B, Comparison of BM engraftment 12-weeks post-transplant resulting from either retro-orbital or intra-tibial injection of CD34+ cells from cord blood and MF patient samples (two-tailed t-test for each individual patient sample). C, Flow cytometric identification of engrafted human cells in NSGS mice. D, Engraftment levels of MF patient cells in BM and spleens of NSGS mice 12-weeks post-transplant. E, Engraftment of erythroid progenitor cells (hCD45− Ter119− CD71+ CD235a+) from MF patient samples in NSGS BM 12-weeks post-transplant. F, Reticulin staining showing fibrosis in the BM of NSGS mice transplanted with MF patient samples, but not in untransplanted mice or mice transplanted with cord blood CD34+ cells. Representative reticulin fibrosis grading is indicated. G, Quantification of degree of reticulin fibrosis from each patient sample. H, Representative flow cytometric analysis of the BM of recipient mice 12-weeks post-primary and post-secondary transplant patient sample MF 300179. Error bars indicate mean ± S.E.M. * p<0.05, ** p<0.01, *** p<0.001. N.D. = not determined.
Figure 2.
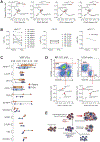
Figure 2.. MF HSCs Show Robust Engraftment in NSGS Mice.
A, UMAP plots of single cell RNA-seq data showing clustering of PBMC cells from two cord blood samples and two MF patients (Patients; MF 585953 and MF 784981) and hCD45+ cells from the same donors isolated from the BM of NSGS mice 12-weeks post-transplant (PDX). The top panels show clustering of samples by genotype in Patients and PDX. The bottom panels show identification of cell populations by marker genes. Dashed red lines indicate population identities of MF-only cell clusters. B, Flow cytometric identification of human HSCs (hCD45+ Lineagelow CD34+ CD38− CD45RA− CD90+) and multilymphoid progenitors (MLPs) in the BM of NSGS mice. C, Quantification of human HSCs in the BM of NSGS mice 12-weeks post-transplant. D, Four-week peripheral blood engraftment of MF 504293 patient cells prior to treatment initiation, and four-weeks after ruxolitinib therapy. E, BM engraftment of MF 504293 patient cells four-weeks post-treatment (two-tailed t-test). F, Representative spleen images from mice of the different treatment groups. G, Spleen weights of NSGS four-weeks post-treatment (two-tailed t-test). H, Quantification of human HSC abundance in the BM of NSGS mice post-treatment. Error bars indicate mean ± S.E.M. * p<0.05, **** p<0.0001. N.D. = not determined.
Figure 3.
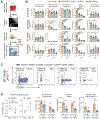
Figure 3.. MF Patient Clonal Architecture is Maintained in PDX Models.
A, Comparison of the variant allele fraction (VAF) of mutations in CD34+ cells from MF patient 784981 versus hCD45+ cells isolated from BM and spleens of NSGS mice 12-weeks post-transplant. B, Comparison of average VAF of MPN driver genes in MF patient CD34+ cells and PBMCs versus VAF of same mutation in hCD45+ BM cells from NSGS mice 12-weeks post-transplant. C, Comparison of VAFs of recurrently mutated genes in this cohort between MF patient CD34+ cells and PDX-derived hCD45+ cells. D, Flow cytometry plots showing isolation of different cell populations from PDX of patient MF 300179 and the VAF of mutations in each respective cell populations. E, Model for clonal evolution in patient MF 300179 based on mutational profile of cell populations derived from PDX.
Figure 4.
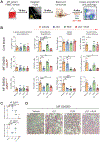
Figure 4.. PDX System can Predict Clonal Evolution to Secondary AML.
A, Comparison of the variant allele fraction (VAF) of mutations in CD34+ cells from patient MF 504293 versus hCD45+ cells isolated from BM of NSGS mice 12-weeks post-transplant. B, Clinical course of patient MF 504293. C, VAF of EZH2Y663H variant from clinical NGS during treatment history of patient MF 504293. D, Quantification of EZH2Y663H variant from indicated samples by ddPCR. E, Clinical course of patient MF 764338. F, Comparison of VAF of mutations in CD34+ cells from patient MF 764338 versus PBMCSs and hCD45+ cells isolated from BM of NSGS mice 12-weeks post-transplant. G, Quantification of TP53R248Q variant from indicated samples by ddPCR.
Figure 5.
Figure 5.. Genetic and Pharmacological Validation of Novel Therapeutic Targets in MF.
A, Schematic for PIMi plus ruxolitinib combination therapy using PDX model. B, Cumulative data showing MF patient cell peripheral blood engraftment pre-treatment, and post-treatment blood and BM engraftment, spleen weight and human HSC burden in the BM (one-way ANOVA with treatment arms compared to vehicle, Dunnett multiple comparison correction). C, Representative flow cytometry plots showing human HSC burden from NSGS mice transplanted with MF 784981 and then exposed to the indicated treatments. D, Peripheral blood counts, bone marrow engraftment, spleen weights and human HSC burden from NSGS mice xenografted with indicated MF patient samples following four-weeks of indicated treatment, then after a four-week recovery (two-tailed t-test for each individual patient sample). Error bars indicate mean ± S.E.M. * p<0.05, ** p<0.01, *** p<0.001, **** p<0.0001.
Figure 6.
Figure 6.. BET Bromodomain Inhibition Plus Ruxolitinib Reduces Fibrosis.
A, Schematic for JQ1 plus ruxolitinib combination therapy using PDX model. B, Cumulative data showing MF patient cell pre-treatment peripheral blood engraftment (four-weeks post-transplant, four-weeks pre-treatment), and post-treatment BM engraftment, spleen weight and human HSC burden in the BM (one-way ANOVA with treatment arms compared to vehicle, Dunnett multiple comparison correction). C, Quantification of BM reticulin fibrosis for indicated MF patient samples xenografted into NSGS mice then exposed to indicated treatments (one-way ANOVA with treatment arms compared to vehicle, Dunnett multiple comparison correction). D, Representative images showing reticulin staining in the BM of NSGS mice transplanted with MF 504293 and then exposed to indicated therapies. Error bars indicate mean ± S.E.M. * p<0.05, ** p<0.01, *** p<0.001, **** p<0.0001.

References

    1. Campbell PJ, Green AR. The Myeloproliferative Disorders. New England Journal of Medicine 2006;355(23):2452–66. - PubMed
    1. Levine RL, Wadleigh M, Cools J, Ebert BL, Wernig G, Huntly BJ, et al. Activating mutation in the tyrosine kinase JAK2 in polycythemia vera, essential thrombocythemia, and myeloid metaplasia with myelofibrosis. Cancer Cell 2005;7(4):387–97. - PubMed
    1. James C, Ugo V, Le Couedic JP, Staerk J, Delhommeau F, Lacout C, et al. A unique clonal JAK2 mutation leading to constitutive signalling causes polycythaemia vera. Nature 2005;434(7037):1144–8. - PubMed
    1. Kralovics R, Passamonti F, Buser AS, Teo SS, Tiedt R, Passweg JR, et al. A gain-of-function mutation of JAK2 in myeloproliferative disorders. N Engl J Med 2005;352(17):1779–90. - PubMed
    1. Pikman Y, Lee BH, Mercher T, McDowell E, Ebert BL, Gozo M, et al. MPLW515L is a novel somatic activating mutation in myelofibrosis with myeloid metaplasia. PLoS Med 2006;3(7):e270. - PMC - PubMed

Publication types

MeSH terms