. 2021 Jun;9(6):e001649.
doi: 10.1136/jitc-2020-001649.

TGM4: an immunogenic prostate-restricted antigen

Affiliations

TGM4: an immunogenic prostate-restricted antigen

Zoila A Lopez-Bujanda et al. J Immunother Cancer. 2021 Jun.

Abstract

Background: Prostate cancer is the second leading cause of cancer-related death in men in the USA; death occurs when patients progress to metastatic castration-resistant prostate cancer (CRPC). Although immunotherapy with the Food and Drug Administration-approved vaccine sipuleucel-T, which targets prostatic acid phosphatase (PAP), extends survival for 2-4 months, the identification of new immunogenic tumor-associated antigens (TAAs) continues to be an unmet need.

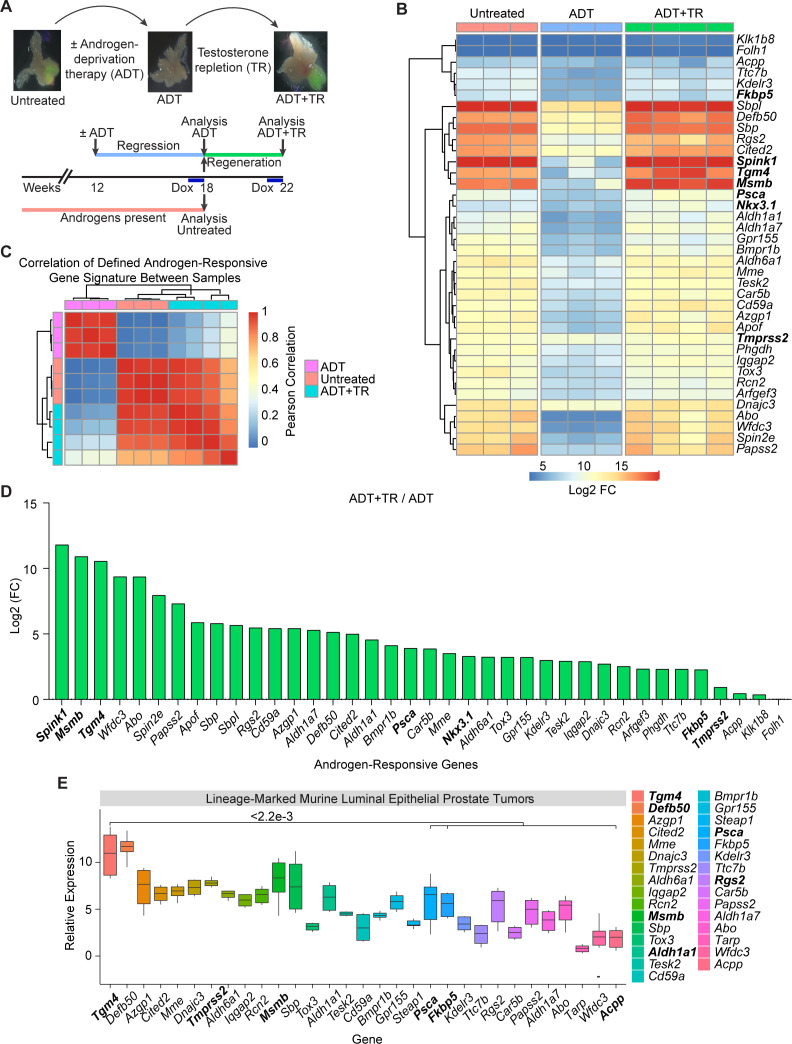
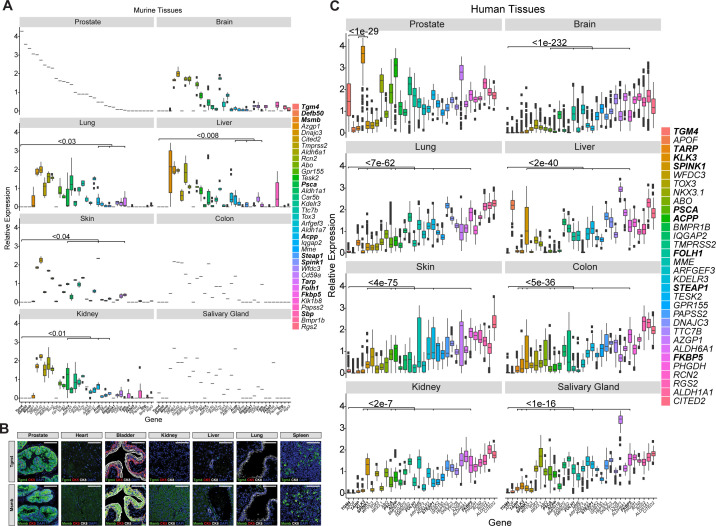
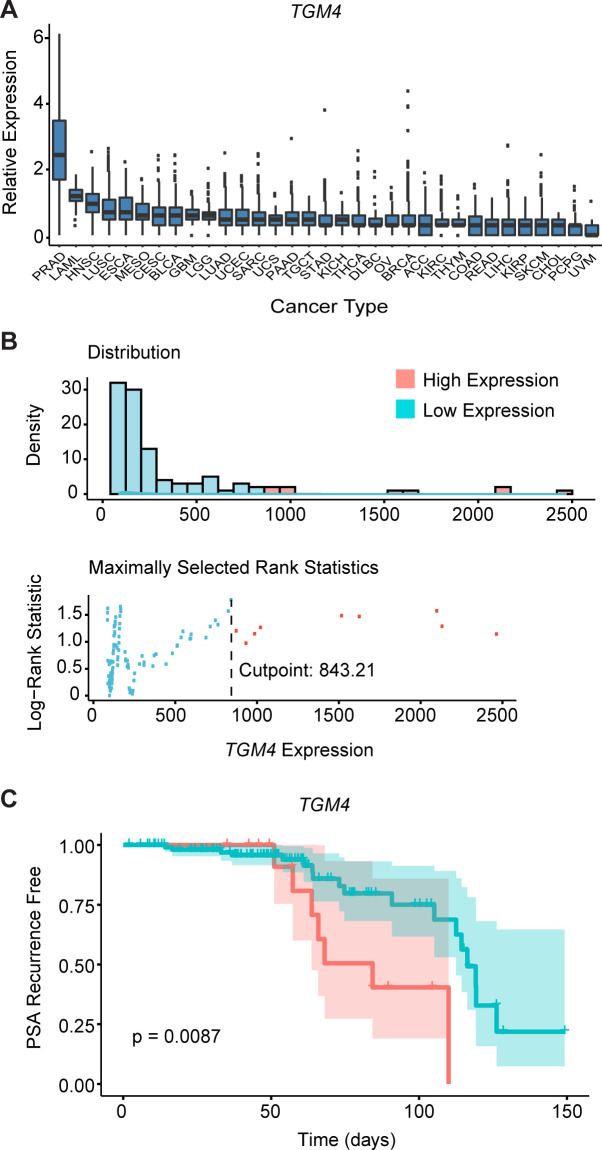
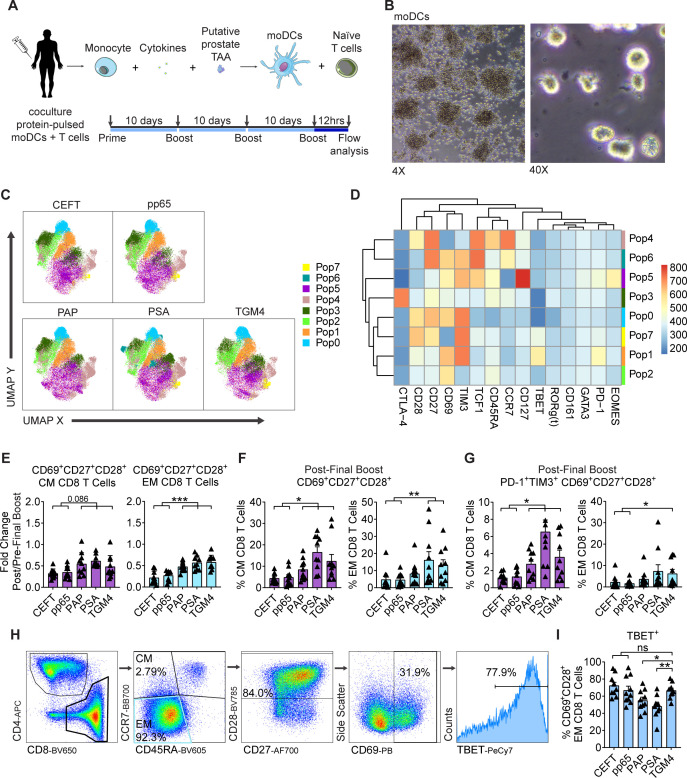
Methods: We evaluated the differential expression profile of castration-resistant prostate epithelial cells that give rise to CRPC from mice following an androgen deprivation/repletion cycle. The expression levels of a set of androgen-responsive genes were further evaluated in prostate, brain, colon, liver, lung, skin, kidney, and salivary gland from murine and human databases. The expression of a novel prostate-restricted TAA was then validated by immunostaining of mouse tissues and analyzed in primary tumors across all human cancer types in The Cancer Genome Atlas. Finally, the immunogenicity of this TAA was evaluated in vitro and in vivo using autologous coculture assays with cells from healthy donors as well as by measuring antigen-specific antibodies in sera from patients with prostate cancer (PCa) from a neoadjuvant clinical trial.

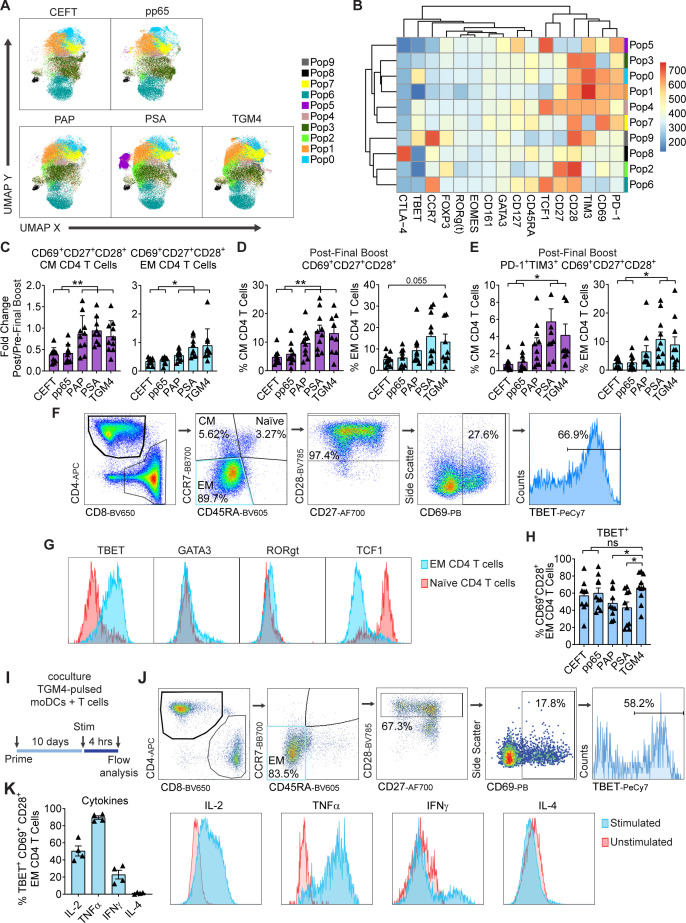
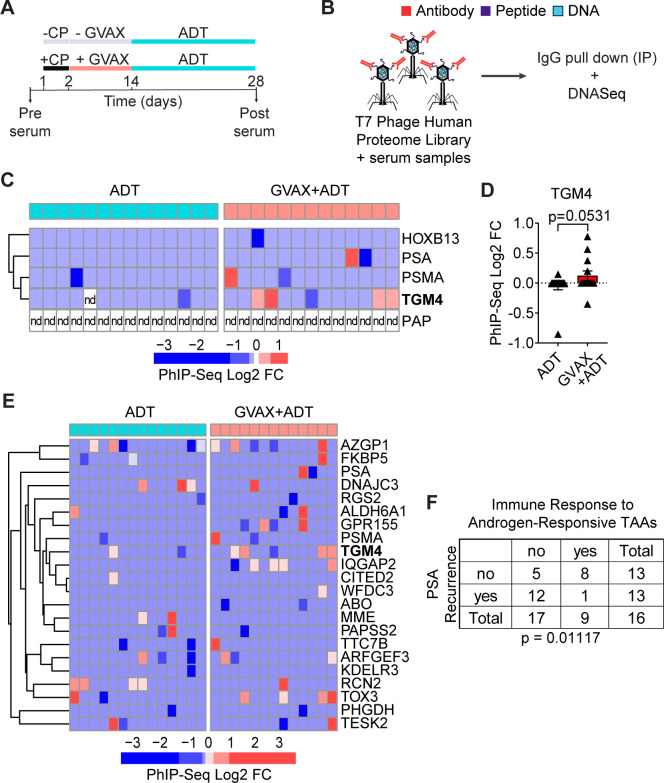
Results: We identified a set of androgen-responsive genes that could serve as potential TAAs for PCa. In particular, we found transglutaminase 4 (Tgm4) to be highly expressed in prostate tumors that originate from luminal epithelial cells and only expressed at low levels in most extraprostatic tissues evaluated. Furthermore, elevated levels of TGM4 expression in primary PCa tumors correlated with unfavorable prognosis in patients. In vitro and in vivo assays confirmed the immunogenicity of TGM4. We found that activated proinflammatory effector memory CD8 and CD4 T cells were expanded by monocyte-derived dendritic cell (moDCs) pulsed with TGM4 to a greater extent than moDCs pulsed with either PAP or prostate-specific antigen (PSA), and T cells primed with TGM4-pulsed moDCs produce functional cytokines following a prime/boost regiment or in vitro stimulation. An IgG antibody response to TGM4 was detected in 30% of vaccinated patients, while fewer than 8% of vaccinated patients developed antibody responses to PSA or prostate-specific membrane antigen (PSMA).

Conclusions: These results suggest that TGM4 is an immunogenic, prostate-restricted antigen with the potential for further development as an immunotherapy target.

Keywords: antigens; immunogenicity; prostatic neoplasms; vaccine.


Conflict of interest statement

Competing interests: CD has served as a consultant for Agenus, BMS, Dendreon, Janssen Oncology, Eli Lilly, F-Star, Merck, AstraZeneca, MedImmune, Pierre Fabre, Genentech, and Genocea Biosciences, and has stock or ownership interests in Compugen, Harpoon, Kleo, and Tizona Therapeutics. PM has served as a consultant for AstraZeneca, Medimmune and ATARA Biotherapeutics Inc. EA has served as a paid consultant/advisor to Janssen, Pfizer, Sanofi, Dendreon, Bayer, Bristol Myers Squibb, Amgen, Merck, AstraZeneca, and Clovis; has received research grants to his institution from Janssen, Johnson &Johnson, Sanofi, Bristol Myers Squibb, Pfizer, AstraZeneca, Celgene, Merck, Bayer, Clovis; and is an inventor of a biomarker technology that has been licensed to Qiagen. RR has served as a consultant to Gilead, Atara, Novartis, Celgene, Monsanto and Magenta. UL has served as a founder to and owns stock in Alchemab Therapeutics and Patch Biosciences.

Figures

Figure 1
Figure 1
Putative prostate antigens are expressed by murine CRLECs in an androgen-dependent manner. (A) Schematic representation of androgen-induced prostate regression/regeneration in Hoxb13-rtTA|TetO-H2BGFP transgenic mice to model the cells of origin of prostate cancer (CRLECs). Top: representative fluorescent images of GFP+ murine luminal epithelial cells to ADT and TR in murine prostates. Bottom: mice were treated with ADT (androgen depletion), testosterone pellets (androgen repletion), and DOX as indicated in the diagram and described in the Materials and methods section. (B) Differential expression profile of GFP+ CRLECs isolated from the prostates of mice left untreated, treated with ADT, or treated with ADT plus androgen/TR (n≥3 per group). Heatmap showing androgen-responsive genes downregulated by ADT compared with both untreated and ADT+TR samples (n≥3 per group, GSE171490). (C) Heatmap showing pairwise Pearson correlation of androgen-responsive gene expression between CRLECs isolated from each mouse as described previously. Androgen-responsive gene signature (shown in B) with pairwise correlation between mice shown computed across all genes and annotated by treatment group. (D) Log2 FC in expression of androgen-responsive genes in GFP+ CRLECs isolated from the prostates of mice treated with ADT in combination with androgen/TR compared with ADT alone. (E) Relative expression of androgen-responsive genes, as well as Tarp and Steap1, in prostate tumors originated from luminal epithelial cells isolated from lineage-marked Nkx3.1CreERT2/+, Ptenflox/flox, R26R-YFP/+ transgenic mice (n≥5, GSE39509). Boxplots of Log10 (FPKM) normalized gene expression are shown (n=6). (B, D) Selected genes for each comparison are defined as genes with ADT Log2 FC below the 0.005 percentile and p<0.01, in addition to a set of known androgen-responsive genes from the literature (Acpp, Klk1b8, Fkbp5, Nkx3.1, Tmprss2, and Folh1). Wilcoxon test was used for statistical analysis between Tgm4 and each indicated gene; p values are displayed. ADT, androgen-deprivation therapy; CRLEC, castration-resistant luminal epithelial cell; DOX, doxycycline; FC, fold change; TetO-H2BGFP, tetracycline operator–histone 2B-green fluorescent protein; Tgm4, transglutaminase 4; TR, testosterone repletion.
Figure 2
Figure 2
Expression of putative prostate antigens is restricted to the prostate in both mouse and humans. (A) Relative expression of androgen-responsive genes, as well as Tarp and Steap1, across normal murine tissues. Boxplots of Log10 (TPM) normalized gene expression in prostate (n=1), brain (n=9), colon (n=1), liver (n=10), lung (n=9), skin (n=2), kidney (n=7), and salivary gland (n=1) from RIKEN FANTOM5 are shown, and genes are ordered by decreasing expression in murine prostate. (B) IF images of selected markers in adjacent sections from indicated mouse tissues—the prostate lobes shown are dorsal prostate lobes for Tgm4 and lateral prostate lobes for Msmb. Scale bars indicate 50 µm. (C) Relative expression of androgen-responsive genes, as well as TARP and STEAP1, across normal human tissues. Boxplots of Log10 (TPM) normalized gene expression in prostate (n=152), brain (n=1671), colon (n=507), liver (n=175), lung (n=427), skin (n=1203), kidney (n=45), and salivary gland (n=97) from GTEx are shown. Wilcoxon test was used for statistical analysis between TGM4 and each indicated gene; p values are displayed. GTEx, Genotype-Tissue Expression; IF, Immunofluorescence; TGM4, Transglutaminase 4.
Figure 3
Figure 3
TGM4 expression is maintained by prostate tumor cells. (A) Relative expression of TGM4 across human cancer types in TCGA database, including 558 primary PRADs. Boxplots of Log10 (TPM) normalized gene expression are shown, with cancer types ordered by decreasing TGM4 expression. (B) Optimal cutpoint for TGM4 expression. Top: distribution of TGM4 expression across primary PRADs (n=218, GSE21032). Bottom: the overall log-rank p value for TGM4 expression is plotted. A vertical line is drawn at the optimal cutpoint of 843.21. (C) Kaplan-Meier curves comparing biochemical recurrence-free survival of patients with PRADs, with log-rank p value reported from multiple Cox regression of biochemical recurrence-free against TGM4 expression levels (high TGM4, n=24; low TGM4, n=107). Biochemical recurrence was determined as an increase in PSA serum levels of ≥0.2 ng/mL on two occasions as described in the Materials and methods section. PRAD, prostate adenocarcinoma; TCGA, The Cancer Genome Atlas; TGM4, Transglutaminase 4.
Figure 4
Figure 4
TGM4 induces CD8 T-cell activation and expansion in vitro. (A) Schematic representation of the 30-day prime/boost coculture of autologous moDCs and naïve T cells. (B) Representative images of differentiated moDCs. 4X (left) and 40X (right) magnification. (C) Differential expression of functional markers on expanded populations of CD8 T cells following coculture with autologous protein-pulsed moDCs. Heatmap showing unsupervised clusters determined with the FlowSOM algorithm as described in the Materials and methods section. (D) Expanded CD8 T-cell populations defined by FlowSOM (in C) were projected onto UMAP space as described in the Materials and methods section. Colors correspond to FlowSOM populations. (E) Fold change on activated CD69+CD27+CD28+ EM CD8 T cells (left) and CM T cells (right) following the last 12-hour stimulation in expanded T cells. (F) Activated CD69+CD27+CD28+ cells as a percentage of EM CD8 T cells (left) and CM CD8 T cells (right) following in vitro expansion (as in E). (G) PD1+TIM3+ CD69+CD27+CD28+ cells as a percentage of EM CD8 T cells (left) and CD8 T cells (right) following in vitro expansion (as in E). (H) Gating strategy used to manually analyze TBET+ in activated CD69+CD28+ EM CD8 T cells defined as CCR7CD45RA following coculture with autologous protein-pulsed moDCs. (I) TBET+ cells as a percentage of activated CD69+CD28+ EM CD8 T cells in expanded T cells (gated as in C). (J) Schematic representation of priming of naïve T cell with autologous TGM4-pulsed moDCs stimulated with PMA/ionomycin 4 hours prior analysis by flow cytometry. (K) Gating strategy used to manually analyze cytokine production on activated TBET+CD69+CD28+ EM CD8 T cells defined as CCR7CD45RA following coculture with autologous TGM4-pulsed moDCs stimulated with PMA/ionomycin. (I) Cytokine production as a percentage of activated TBET+CD69+CD28+ EM CD8 T cells in expanded T cells (gated as in K). Unpaired t-tests performed; *p≤0.05, **p≤0.01, ***p≤0.001. CM, central memory; EM, effector memory; IFN-γ, interferon gamma; IL, interleukin; moDC, monocyte-derived dendritic cell; ns, not statistically significant; PAP, prostatic acid phosphatase; PSA, prostate-specific antigen; CEFT, Cytomegalovirus, Epstein-Barr virus, Influenza virus and Clostridium tetani; TAA, tumor-associated antigen; TGM4, transglutaminase 4.
Figure 5
Figure 5
TGM4 induces CD4 T-cell activation and expansion in vitro. (A) Differential expression of functional markers on expanded populations of CD4 T cells following coculture with autologous protein-pulsed moDCs. Heatmap showing unsupervised clusters determined with the FlowSOM algorithm as described in the Materials and methods section. (B) Expanded CD4 T-cell populations defined by FlowSOM (in A) were projected onto UMAP space as described in the Materials and methods section. Colors correspond to FlowSOM populations. (C) Fold change on activated CD69+CD27+CD28+ EM CD4 T cells (left) and CM CD4 T cells (right) following the last 12 hours of stimulation in expanded T cells. (D) Activated CD69+CD27+CD28+ cells as a percentage of EM CD4 T cells (left) and CM CD4 T cells (right) following in vitro expansion (as in C). (E) PD1+TIM3+ CD69+CD27+CD28+ cells as a percentage of EM CD4 T cells (left) and CM CD4 T cells (right) following in vitro expansion (as in C). (F) Gating strategy used to manually analyze TBET+ in activated CD69+CD28+ EM CD4 T cells defined as CCR7CD45RA following coculture with autologous protein-pulsed moDCs. (G) Representative histograms of expression levels of functional transcription factors determined by flow cytometry in expanded EM and naïve CD4 T cells. (H) TBET+ cells as a percentage of activated CD69+CD28+ EM CD4 T cell in expanded T cells (gated as in F). (I) Schematic representation of priming of naïve T cell with autologous TGM4-pulsed moDCs stimulated with PMA/ionomycin 4 hours prior analysis by flow cytometry. (J) Gating strategy used to manually analyze cytokine responses on activated TBET+CD69+CD28+ EM CD4 T cells defined as CCR7CD45RA following coculture with autologous TGM4-pulsed moDCs stimulated with PMA/ionomycin. (K) Cytokine production as a percentage of activated TBET+CD69+CD28+ EM CD4 T cells in expanded T cells (gated as in I). Unpaired t-tests performed; *p≤0.05, **p≤0.01. CEFT, cytomegalovirus, Epstein-Barr virus, influenza virus and clostridium tetani; CM, central memory; EM, effector memory; IFN-γ, interferon gamma; IL, interleukin; moDC, monocyte-derived dendritic cell; ns, not statistically significant; PAP, prostatic acid phosphatase; PSA, prostate-specific antigen; TGM4, transglutaminase 4.
Figure 6
Figure 6
GVAX vaccination induces antibody responses against TGM4 in patients with prostate cancer. (A) Schematic representation of the treatment paradigm of patients with PRAD treated with ADT alone or CP followed by GVAX and ADT in a neoadjuvant trial (NCT01696877). (B) Schematic diagram of the PhIP-Seq assay. (C) Heatmap of antibody binding to selected prostate-restricted TAAs determined as described in the Materials and methods section. (D) Antibody response to TGM4 across patients with PRAD (treated as in A). (E) Heatmap of antibody binding to androgen-responsive antigens determined as described in figure 2. (F) Table summarizing responses for ADT only and GVAX followed by ADT treatment groups. Fisher’s exact test shows significant over-representation of immune response to androgen-responsive TAAs in the set of patients without biochemical recurrence. ADT, androgen-deprivation therapy; CP, cyclophosphamide; FC, fold change; GVAX, granulocyte-macrophage colony-stimulating factor [GM-CSF] gene transduced irradiated prostate cancer vaccine cells; nd, not detected; PhIP-Seq, Phage-ImmunoPrecipitation sequencing; PRAD, prostate adenocarcinoma; TAA, tumor-associated antigen; TGM4, transglutaminase 4.

References

    1. Ji G, Huang C, Song G, et al. . Are the pathological characteristics of prostate cancer more aggressive or more indolent depending upon the patient age? Biomed Res Int 2017;2017:1438027. 2017. 10.1155/2017/1438027 - DOI - PMC - PubMed
    1. Scher HI, Morris MJ, Stadler WM, et al. . Trial design and objectives for castration-resistant prostate cancer: updated recommendations from the prostate cancer clinical trials Working group 3. J Clin Oncol 2016;34:1402–18. 10.1200/JCO.2015.64.2702 - DOI - PMC - PubMed
    1. Comiskey MC, Dallos MC, Drake CG. Immunotherapy in prostate cancer: teaching an old dog new tricks. Curr Oncol Rep 2018;20:75. 10.1007/s11912-018-0712-z - DOI - PubMed
    1. Venturini NJ, Drake CG. Immunotherapy for prostate cancer. Cold Spring Harb Perspect Med 2019;9. 10.1101/cshperspect.a030627. [Epub ahead of print: 01 May 2019]. - DOI - PMC - PubMed
    1. Small EJ, Schellhammer PF, Higano CS, et al. . Placebo-Controlled phase III trial of immunologic therapy with sipuleucel-T (APC8015) in patients with metastatic, asymptomatic hormone refractory prostate cancer. J Clin Oncol 2006;24:3089–94. 10.1200/JCO.2005.04.5252 - DOI - PubMed

Publication types