. 2021 Jun 30;13(600):eabd6892.
doi: 10.1126/scitranslmed.abd6892.

Gene therapy knockdown of Hippo signaling induces cardiomyocyte renewal in pigs after myocardial infarction

Affiliations

Gene therapy knockdown of Hippo signaling induces cardiomyocyte renewal in pigs after myocardial infarction

Shijie Liu et al. Sci Transl Med. .

Abstract

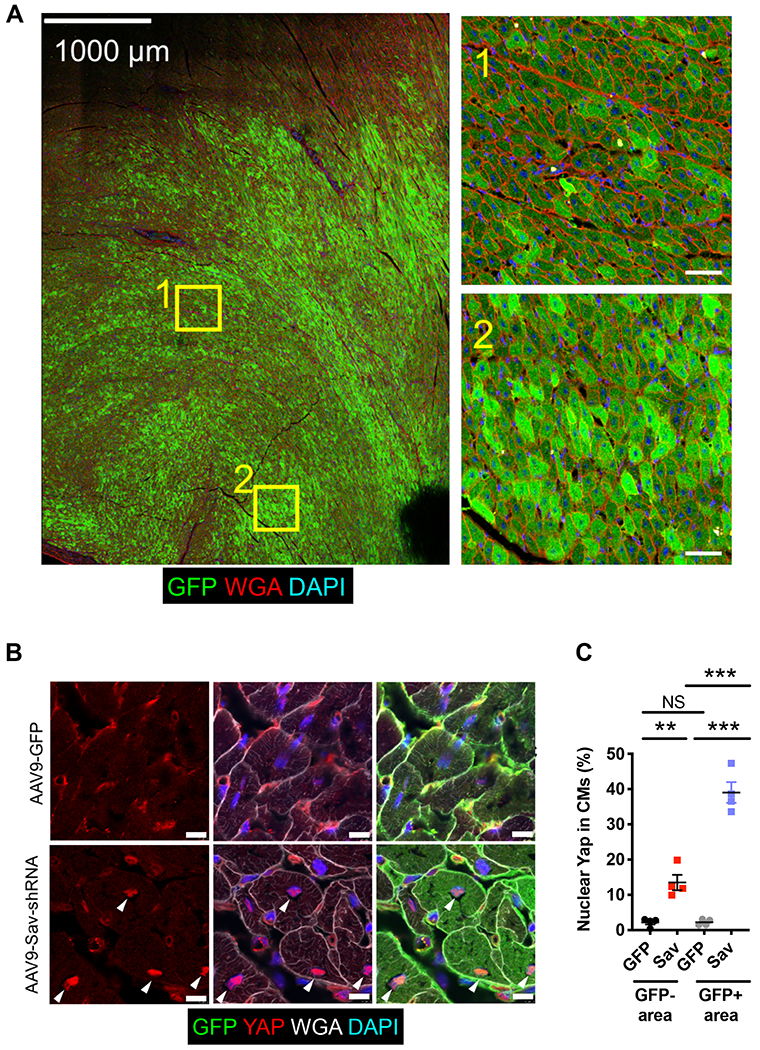
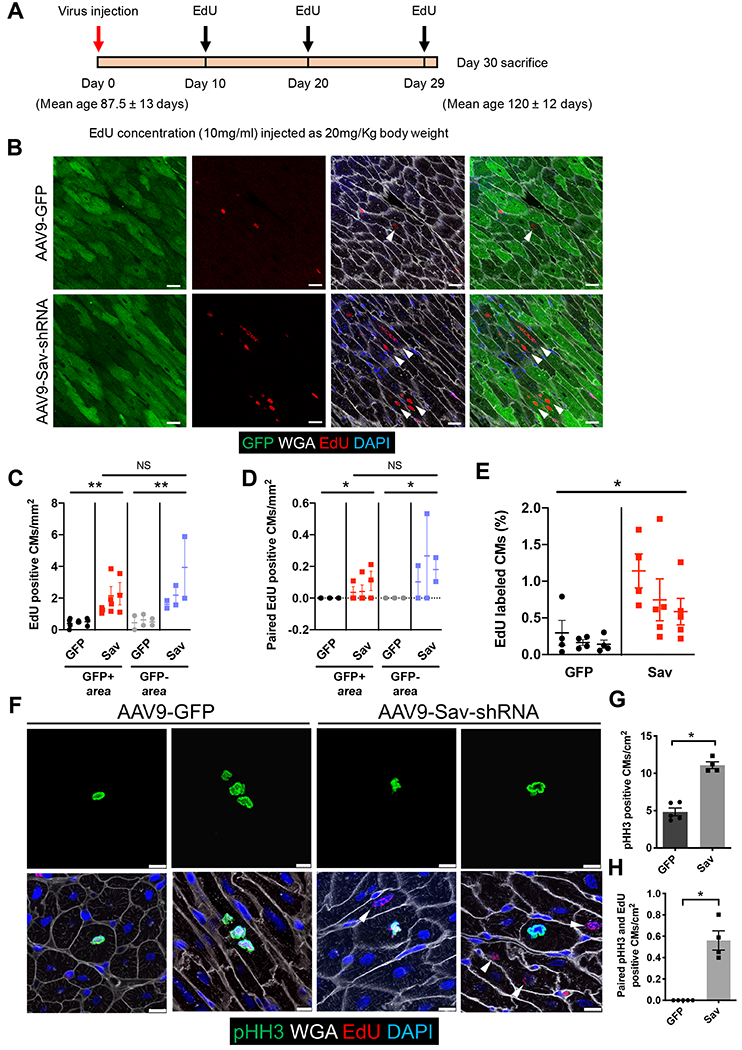
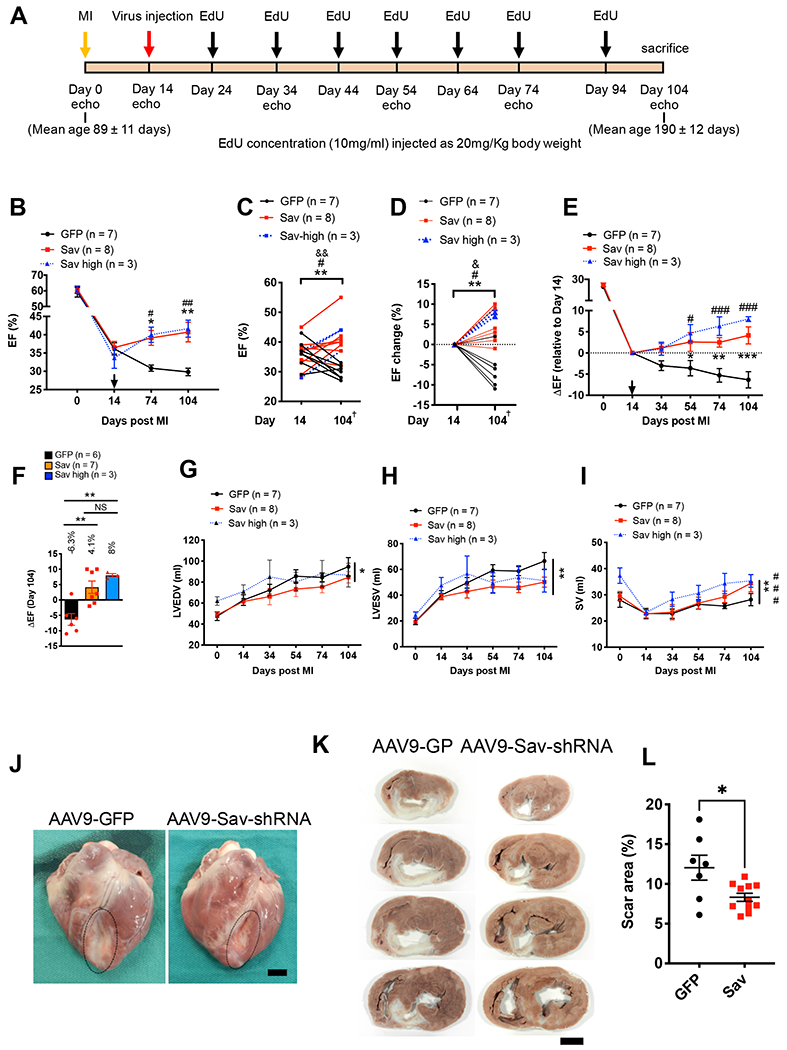
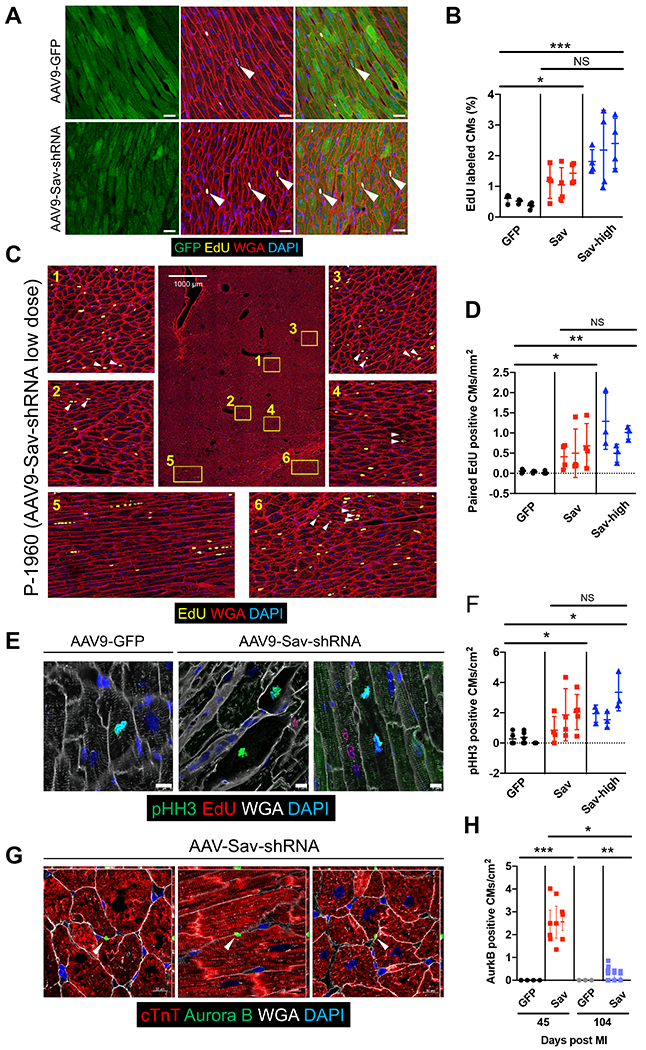
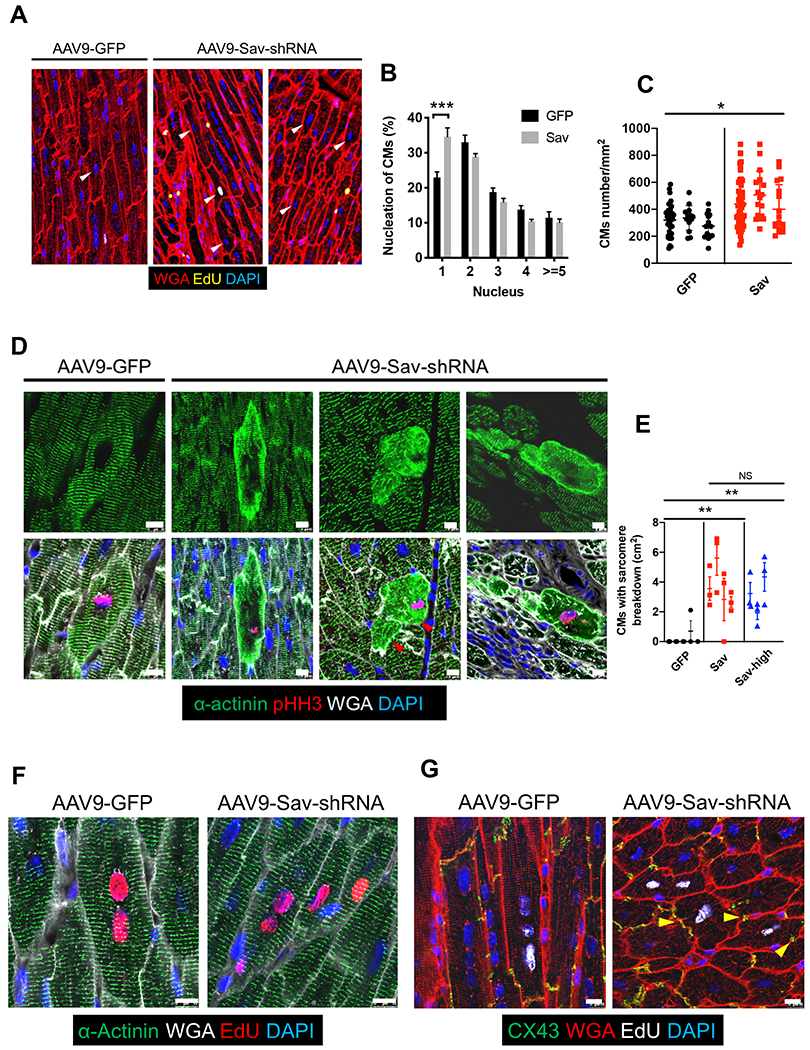
Human heart failure, a leading cause of death worldwide, is a prominent example of a chronic disease that may result from poor cell renewal. The Hippo signaling pathway is an inhibitory kinase cascade that represses adult heart muscle cell (cardiomyocyte) proliferation and renewal after myocardial infarction in genetically modified mice. Here, we investigated an adeno-associated virus 9 (AAV9)-based gene therapy to locally knock down the Hippo pathway gene Salvador (Sav) in border zone cardiomyocytes in a pig model of ischemia/reperfusion-induced myocardial infarction. Two weeks after myocardial infarction, when pigs had left ventricular systolic dysfunction, we administered AAV9-Sav-short hairpin RNA (shRNA) or a control AAV9 viral vector carrying green fluorescent protein (GFP) directly into border zone cardiomyocytes via catheter-mediated subendocardial injection. Three months after injection, pig hearts treated with a high dose of AAV9-Sav-shRNA exhibited a 14.3% improvement in ejection fraction (a measure of left ventricular systolic function), evidence of cardiomyocyte division, and reduced scar sizes compared to pigs receiving AAV9-GFP. AAV9-Sav-shRNA-treated pig hearts also displayed increased capillary density and reduced cardiomyocyte ploidy. AAV9-Sav-shRNA gene therapy was well tolerated and did not induce mortality. In addition, liver and lung pathology revealed no tumor formation. Local delivery of AAV9-Sav-shRNA gene therapy to border zone cardiomyocytes in pig hearts after myocardial infarction resulted in tissue renewal and improved function and may have utility in treating heart failure.


Conflict of interest statement

Competing interests: J.F.M. is a cofounder of and owns shares in Yap Therapeutics. J.F.M., T.R.H., and J.P.L. are coinventors on the following patents associated with this study: patent no. US20200206327A1 entitled “Hippo pathway deficiency reverses systolic heart failure post-infarction”, patent no. 15/642200.PCT/US2014/069349 101191411 entitled “Hippo and dystrophin complex signaling in cardiomyocyte renewal”, and patent no. 15/102593.PCT/US2014/069349 9732345 entitled “Hippo and dystrophin complex signaling in cardiomyocyte renewal.”

Figures

Fig. 1.
Fig. 1.. Increased Yap nuclear localization in cardiomyocytes after AAV9-Sav-shRNA gene therapy.
(A) Shown is a representative tiled image of GFP staining of a section from an AAV9-Sav-shRNA–injected pig heart (pig P-1902; euthanized at 104 days and myocardial infarction, 33 days after viral vector injection). Inset images on the right show the magnification of the boxed areas in the tile image on the left. Scale bars, 1000 μm (left image) and 50 μm (right inset images). DAPI, 4′,6-diamidino-2-phenylindole. (B) Immunofluorescence staining for endogenous GFP and Yap shows the subcellular localization of Yap in GFP-positive cardiomyocytes that received AAV9-Sav-shRNA gene therapy. White arrowheads indicate nuclear Yap. Scale bars, 10 μm. (C) Quantification of the percentage of nuclear Yap in GFP-positive and GFP-negative cardiomyocytes of pig hearts injected with AAV9-Sav-shRNA (Sav) or AAV9-GFP (GFP) as control (n = 4 per group). Data were compared using one-way ANOVA with Tukey’s post hoc test. Data are presented as the mean ± SEM. **P < 0.01 and ***P < 0.001; NS, not significant.
Fig. 2.
Fig. 2.. Increased cardiomyocyte proliferation in uninjured pig hearts injected with AAV9-Sav-shRNA.
(A) Schematic shows the timing of viral vector and EdU injections. (B) Shown are representative images of immunofluorescence staining for GFP and EdU in the hearts of uninjured pigs (P-1890, AAV9-GFP control; P-1891, AAV9-Sav-shRNA). Both pigs were euthanized at the age of 120 days, 31 days after viral vector injection. White arrowheads indicate EdU-positive cardiomyocytes. Scale bars, 25 μm. (C and D) Shown is quantification of EdU-positive cardiomyocytes (C) and paired EdU-positive cardiomyocytes (D). Each dot represents one tiled image (n = 3 per group). One-way ANOVA with Tukey’s post hoc test was used for comparisons shown in (C); a nested t test was used for (D). (E) Machine learning quantification of EdU-positive cardiomyocytes is shown (n = 3). Four to five tiled images were analyzed per pig heart. A nested t test was used for the comparison. (F) Representative images show immunofluorescence staining for pHH3 and EdU in pig hearts (P-1900, AAV9-GFP control; P1902, AAV9-Sav-shRNA). White arrowheads indicate EdU-positive cardiomyocytes near pHH3-positive cardiomyocytes. Scale bars, 10 μm. (G) Shown is quantification of the number of pHH3-positive cardiomyocytes: GFP control, 4.84 ± 0.524 cardiomyocytes per cm2; AAV9-Sav-shRNA (Sav) 11.10 ± 0.460 cardiomyocytes per cm2 (GFP, n = 5; Sav, n = 4). (H) Shown is quantification of the number of paired pHH3-positive and EdU-positive cardiomyocytes, that is, the number of pHH3-positive cardiomyocytes with adjacent EdU-positive cardiomyocytes (GFP control, n = 5; Sav, n = 4). The Mann-Whitney test was used for comparisons for (G) and (H). Data are presented as the means ± SEM. For all comparisons, *P < 0.05, **P < 0.01.
Fig. 3.
Fig. 3.. Improved heart function in pigs with myocardial infarction after AAV9-Sav-shRNA gene therapy.
(A) Schematic shows the timing of viral vector injection, EdU injections, and echocardiography (echo) studies in a pig model of I/R-induced myocardial infarction (MI). (B to D) Echocardiography results show the ejection fraction (EF) after myocardial infarction (B), the ejection fraction at day 14 to 104 after myocardial infarction (C), and the change in ejection fraction from days 14 to 104 after myocardial infarction (D); Two-tailed paired t test was used in (C), and two-way ANOVA with Bonferroni post hoc test was used in (D). *, #, and & indicate comparison between days 14 and 104 after myocardial infarction for AAV9-GFP control (GFP) pig heart and low- (Sav) and high-dose (Sav high) pig hearts injected with AAV9-Sav-shRNA respectively. * and &P < 0.05, **, ##, and &&P < 0.01; # = 0.07 in C, # = 0.0339 in D. arrow indicates virus injection in B; + indicates one pig treated with AAV9-GFP and one pig treated with low dose AAV9-Sav-shRNA that were both euthanized at day 74 post myocardial infarction. (E and F) Longitudinal plot of changes in EF associated with day 14 after myocardial infarction for AAV9-GFP control and low-dose (Sav) and high-dose (Sav high) AAV9-Sav-shRNA (E). Bar graph with individual data points shows changes in ejection fraction on day 104 relative to day 14 after myocardial infarction (F). (G to I) Shown are left ventricular end-diastolic volume (LVEDV) (G), left ventricular end-systolic volume (LVESV) (H), and stroke volume (SV) (I) for pigs treated with AAV9-GFP as control (n = 7), low-dose AAV9-Sav-shRNA (Sav; n = 8), or high-dose AAV9-Sav-shRNA (Sav high; n = 3) gene therapy. Two-way ANOVA with Bonferroni’s post hoc test was used for comparisons in (B), (E), (G), (H), and (I); one-way ANOVA with Tukey’s post hoc test was used for panel (F); Asterisk indicates comparison between AAV9-GFP (GFP) control and AAV9-Sav-shRNA low dose (Sav); # indicates the comparison between AAV9-GFP control and AAV9-Sav-shRNA high dose (Sav high). * or #P < 0.05, ** or ##P < 0.01, and *** or ###P < 0.001. B, E, G, H, and I include one pig treated with AAV9-GFP and one pig treated with low dose AAV9-Sav-shRNA that were both euthanized at day 74 post myocardial infarction. (J) Representative images show pig hearts that were harvested 90 days after viral vector injection (P-1918, AAV9-GFP control; P-1917, AAV9-Sav-shRNA). Each pig underwent myocardial infarction at the age of 92 days, received viral vector at the age of 106 days, and was euthanized at the age of 196 days. Scale bar, 2 cm. (K) Shown are four representative heart slices from a total of 7 slices (slice numbers 3, 4, 5, and 6) for pigs P-1918 (AAV9-GFP control) and P-1917 (AAV9-Sav-shRNA). Scale bar, 2 cm. (L) Shown is quantification of scar size (AAV9-GFP, n = 7; combined low- and high-dose AAV9-Sav-shRNA, n = 11). The Mann-Whitney test was used for the comparison. Data are presented as the means ± SEM. *P < 0.05.
Fig. 4.
Fig. 4.. Increased cardiomyocyte proliferation in pigs injected with AAV9-Sav-shRNA after myocardial infarction.
(A) Representative immunofluorescence images show EdU-positive cardiomyocytes (yellow) in the GFP-positive area (green) of heart sections from two pigs after myocardial infarction, one treated with AAV9-GFP (control) and the other treated with low-dose (Sav) AAV9-Sav-shRNA gene therapy. White arrowheads indicate EdU-positive cardiomyocytes. Scale bars, 25 μm. (B) Quantification of EdU-positive cardiomyocytes was determined via machine learning. For each pig, four tiled images were analyzed (n = 3 pigs per group). (C) Representative tile image shows clustered EdU-positive cardiomyocytes in the heart of pig P-1960 (injected with low-dose AAV9-Sav-shRNA). White arrowheads indicate paired EdU-positive cardiomyocytes. (D) Quantification of paired EdU-positive cardiomyocytes (CMs) in the hearts of pigs receiving AAV9-GFP (control) or AAV9-Sav-shRNA gene therapy. For each pig, three to four tiled images were captured (n = 3 pigs per group). (E) Shown is immunofluorescence costaining for pHH3 and EdU in sections from pig hearts at 3 months after injection with AAV9-GFP (control) or low-dose AAV9-Sav-shRNA. Scale bars, 10 μm. (F) Quantification of pHH3-positive cardiomyocytes is presented. For each pig heart, three to five different sections were evaluated from each pig (n = 3). (G) Aurora kinase B staining in low-dose AAV9-Sav-shRNA–injected pig hearts 45 days after myocardial infarction. Quantification is shown in (H). Three to four heart sections were evaluated from each pig (n = 4 for GFP group at day 45 after myocardial infarction, n = 3 for other groups). White arrowhead indicates Aurora kinase B staining. In (B), (D), (F), and (H), GFP, Sav, and Sav-high groups indicate pig hearts injected with AAV9-GFP (control) or low- or high-dose AAV9-Sav-shRNA, respectively. ANOVA Kruskall-Wallis test with Dunn’s multiple comparisons test were used in (B) and (H); nested t test was used to compare the difference between GFP and Sav 104 days after myocardial infarction in (H). Nested one-way ANOVA with Dunnett’s post hoc test was used for comparisons shown in (D) and (F). Data are presented as the means ± SEM. *P < 0.05, **P < 0.01, and ***P < 0.001.
Fig. 5.
Fig. 5.. Sarcomere breakdown and cardiomyocyte division in pigs injected with AAV9-Sav-shRNA after myocardial infarction.
(A) Shown is a representative image of a pig heart showing the number of nuclei in cardiomyocytes. White arrowheads indicate cardiomyocytes with one nucleus. (B) Shown is the percentage of cardiomyocytes with a different number of nuclei. For each pig, at least four tiled images were analyzed (n = 4). A total of 1327 cells were counted in the AAV9-GFP (GFP, control) group, and 1298 cells were counted in the high-dose AAV9-Sav-shRNA (Sav) group. ANOVA with Bonferroni’s post hoc test was used for comparisons. (C) Cardiomyocyte numbers in the GFP-positive area of a representative pig heart from each group are shown: AAV9-GFP control (GFP); AAV9-Sav-shRNA, low and high dose combined (Sav). Each dot represents counted cardiomyocytes in a GFP-positive area (normalized to mm2) (n = 3). (D) Immunofluorescence stainings for pHH3 and sarcomere actinin are shown for representative sections from hearts in each group: AAV9-GFP control (GFP); low-dose AAV9-Sav-shRNA (Sav). Red arrowheads indicate dividing cardiomyocytes with sarcomere breakdown positioned side by side. Scale bars, 10 μm. (E) Shown is quantification of data in (D) (n = 5 for AAV9-GFP–injected hearts; n = 4 for low-dose AAV9-Sav-shRNA–injected hearts, and n = 3 for high-dose AAV9-Sav-shRNA–injected hearts). We quantified three different sections for each pig heart. Two-way ANOVA with Bonferroni’s post hoc test was used for comparisons in (B); nested t tests were used for comparisons in (C); nested one-way ANOVA with Tukey’s post hoc test were used for comparisons in (E). Data are presented as the means ± SEM. *P < 0.05, **P < 0.01, and ***P < 0.001. (F) Shown is immunofluorescence staining for EdU and sarcomere actinin in cardiomyocytes from pig hearts injected with AAV9-GFP control or low-dose AAV9-Sav-shRNA. Coupled EdU-positive parent and daughter cardiomyocytes retain normal sarcomere structure after cell division in AAV9-Sav-shRNA–injected pig hearts. Scale bars, 10 μm. (G) Shown is immunofluorescence staining for EdU and connexin 43 (CX43) in cardiomyocytes from pig hearts injected with AAV9-GFP control or AAV9-Sav-shRNA. Coupled EdU-positive cardiomyocytes connect with each other via CX43 after cell division in AAV9-Sav-shRNA–injected pig hearts. Yellow arrowheads indicate CX43 staining. Scale bars, 25 μm.

Comment in

References

    1. Leach JP, Martin JF, Cardiomyocyte proliferation for therapeutic regeneration. Curr. Cardiol. Rep 20, 63 (2018). - PubMed
    1. Fu X, Khalil H, Kanisicak O, Boyer JG, Vagnozzi RJ, Maliken BD, Sargent MA, Prasad V, Valiente-Alandi I, Blaxall BC, Molkentin JD, Specialized fibroblast differentiated states underlie scar formation in the infarcted mouse heart. J. Clin. Invest 128, 2127–2143 (2018). - PMC - PubMed
    1. Tzahor E, Poss KD, Cardiac regeneration strategies: Staying young at heart. Science 356, 1035–1039 (2017). - PMC - PubMed
    1. Bergmann O, Zdunek S, Felker A, Salehpour M, Alkass K, Bernard S, Sjostrom SL, Szewczykowska M, Jackowska T, dos Remedios C, Malm T, Andrä M, Jashari R, Nyengaard JR, Possnert G, Jovinge S, Druid H, Frisén J, Dynamics of cell generation and turnover in the human heart. Cell 161, 1566–1575 (2015). - PubMed
    1. Senyo SE, Steinhauser ML, Pizzimenti CL, Yang VK, Cai L, Wang M, Wu TD, Guerquin-Kern JL, Lechene CP, Lee RT, Mammalian heart renewal by pre-existing cardiomyocytes. Nature 493, 433–436 (2013). - PMC - PubMed

Publication types