. 2021 Jul 1;8(1):154.
doi: 10.1038/s41438-021-00588-x.

Dynamic changes in transposable element and gene methylation in mulberry (Morus notabilis) in response to Botrytis cinerea

Affiliations

Dynamic changes in transposable element and gene methylation in mulberry (Morus notabilis) in response to Botrytis cinerea

Youchao Xin et al. Hortic Res. .

Abstract

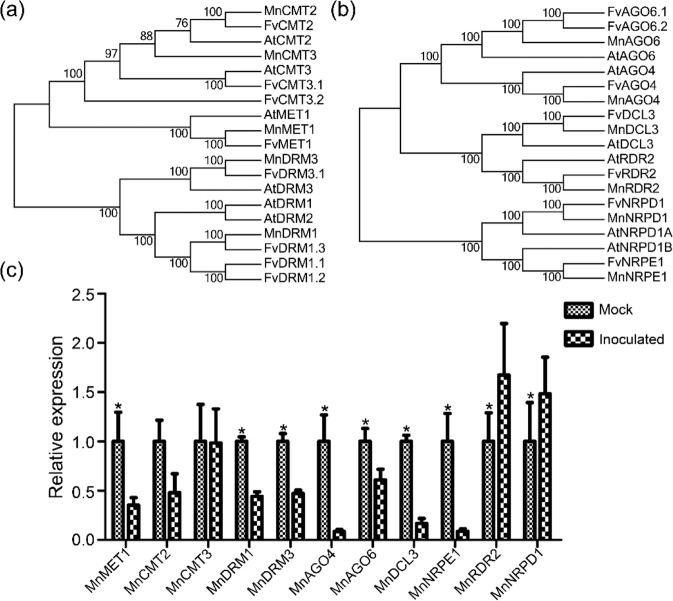
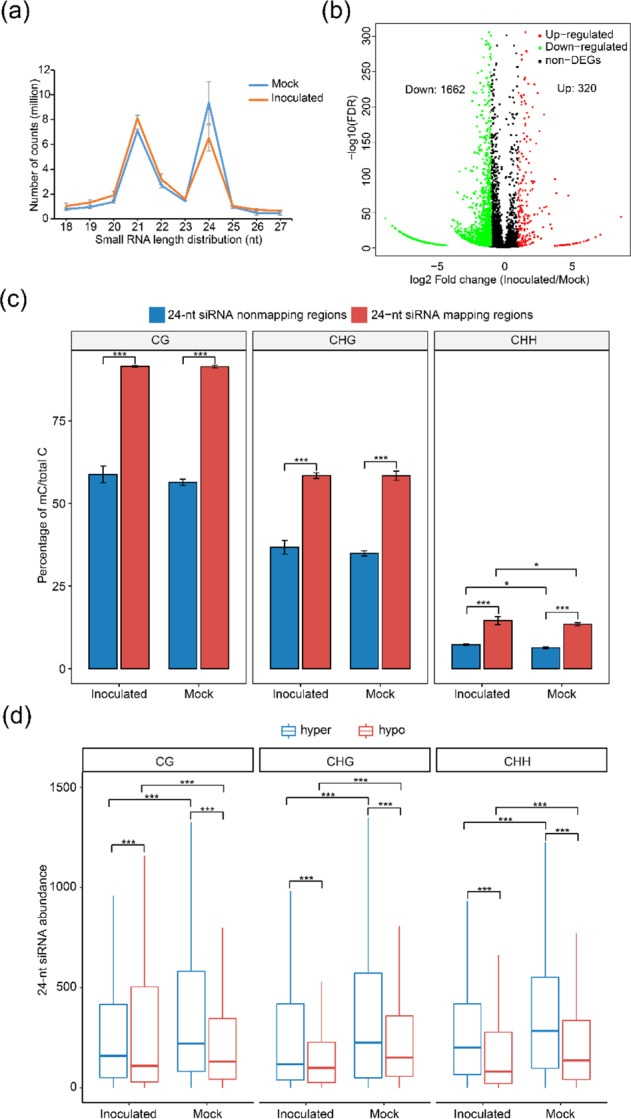
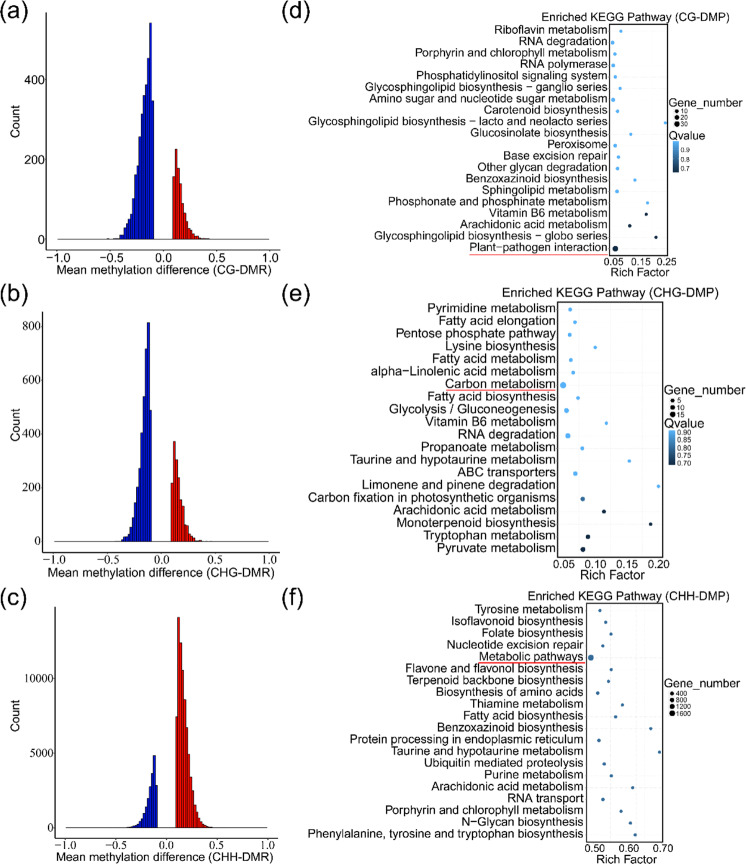
DNA methylation has been proposed to regulate plant stress resistance. However, the dynamic changes in DNA methylation in woody plants and their correlations with pathogenic responses are not fully understood. Here, we present single-base maps of the DNA methylomes of mulberry (Morus notabilis) leaves that were subjected to a mock treatment or inoculation with Botrytis cinerea. Compared with the former, the latter showed decreased mCG and mCHG levels and increased mCHH levels. DNA methylation inhibitors reduced resistance gene methylation levels and enhanced mulberry resistance, suggesting that the hypomethylation of resistance genes affects mulberry resistance to B. cinerea. Virus-induced gene silencing of MnMET1 enhanced the expression of mulberry-resistance genes, thereby increasing the plant's resistance to B. cinerea. We also found that MITEs play a dominant role in controlling DNA methylation levels. MITEs appear to be the main sources of 24-nt siRNAs that regulate gene expression through the RNA-directed DNA methylation pathway.


Conflict of interest statement

The authors declare no competing interests.

Figures

Fig. 1
Fig. 1. Characterization of mulberry methylomes.
a Photographs of mock-treated (Mock) and B. cinerea-inoculated (Inoculated) mulberry leaves. b Proportions of mCG, mCHG, and mCHH in all the methylcytosine in Mock and Inoculated leaves; error bars indicate SDs, n = 3 (*P-value < 0.05, two-tailed t-test). Levels of mC, mCG, mCHG, and mCHH surrounding the upstream, gene body, and downstream regions of the genes (c) and TEs (d) in two samples. The mean values of three biological replicates are shown
Fig. 2
Fig. 2. Expression of genes involved in DNA methylation.
Phylogenetic analyses of DNA methyltransferase (a) and RdDM (b) genes in mulberry, strawberry, and Arabidopsis. The accession numbers of the CDSs are as follows: AtDRM1 (AT5G15380), AtDRM2 (AT5G14620), AtDRM3 (AT3G17310), AtMET1 (AT5G49160), AtCMT2 (AT4G19020), AtCMT3 (AT1G69770), FvDRM1.1 (gene05866), FvDRM1.2 (gene06047), FvDRM1.3 (gene28439), FvDRM3.1 (gene17910), FvMET1 (gene13037), FvCMT2 (gene13664), FvCMT3.1 (gene10077), FvCMT3.2 (gene15171), MnCMT2 (KE346101.1), MnCMT3 (KE343837.1), MnMET1 (KE344409.1), MnDRM3 (KE344683.1), MnDRM1 (KE345913.1), AtAGO4 (AT2G27040), AtAGO6 (AT2G32940), AtDCL3 (AT3G43920), AtNRPD1A (AT1G63020), AtNRPD1B (AT2G40030), AtRDR2 (AT4G11130), FvAGO4 (gene07657), FvAGO6.1 (gene16926), FvAGO6.2 (gene16928), FvDCL3 (gene15481), FvNRPD1 (gene32373), FvNRPE1 (gene14287), FvRDR2 (gene32159), MnAGO4 (KE344194.1), MnAGO4 (KE346072.1), MnDCL3 (KE344662.1), MnNRPD1 (KE345823.1), MnNRPE1 (KE344454.1), and MnRDR2 (KE345786.1). c qRT-PCR analyses of DNA methylation genes. All the expression levels were normalized to the expression of the mulberry actin gene. Error bars indicate SDs, n = 3 (*P-value < 0.05, two-tailed t-test)
Fig. 3
Fig. 3. DNA methylation and 24-nucleotide siRNAs.
a Size distribution of the sequenced small RNAs in mulberry. Three biological replicates are shown. b Volcano plot indicating the up- and downregulated 24-nt siRNAs between the two groups. c DNA methylation levels in mapped regions with 24-nt siRNAs compared with those in mapped regions without 24-nt siRNAs in mock-treated (Mock) and B. cinerea-inoculated (Inoculated) mulberry leaves. Error bars indicate SDs, n = 3 (*P-value < 0.05, ***P-value < 0.001, two-way ANOVA). d Abundance of 24-nt siRNAs located in the CG, CHG, and CHH hypermethylated and hypomethylated regions (***P-value < 0.001, two-way ANOVA)
Fig. 4
Fig. 4. Distribution of 24-nt siRNAs.
The 24-nt siRNA distributions on the gene bodies and flanking regions (a) and TEs (b) of mock-treated (Mock) and B. cinerea-inoculated (Inoculated) mulberry leaves. The mean values of three biological replicates are shown
Fig. 5
Fig. 5. DMR and KEGG pathway enrichment analyses of DMPs between mock-treated (Mock) and B. cinerea-inoculated (Inoculated) mulberry leaves.
Hypo- and hyperdifferentially methylated region counts of CG (a), CHG (b), and CHH (c). Enriched KEGG pathways of the differentially methylated promoters in CG (d), CHG (e), and CHH (f). The most enriched pathways are underlined in red
Fig. 6
Fig. 6. Differentially methylated regions of genes and TEs.
a The relative proportions of hypo- and hyperdifferentially methylated regions that overlapped with genes and TEs. b The relative proportions of differentially methylated regions in CG, CHG, and CHH that overlapped with TEs in each superfamily. c The relative proportions of differentially methylated promoters in CG, CHG, and CHH that overlapped with TEs. d The proportions of transcripts that increased with decreased methylation and decreased with increased methylation. The number at the top of the figure represents the absolute number of DMRs
Fig. 7
Fig. 7. Effects of DNA methylation on the expression of mulberry-resistance genes.
DNA methylation surrounding Morus017734 (a) and Morus025913 (b) in mock-treated (Mock) and B. cinerea-inoculated (Inoculated) mulberry leaves. The red rectangles represent DMRs. The red arrows represent the regions verified by McrBC-PCR. McrBC-PCR analyses of Morus017734 (c) and Morus025913 (d). + and − indicate the presence and absence of GTP, respectively. e The expression of Morus017734 and Morus025913 in mock-treated (Mock) and B. cinerea-inoculated (Inoculated) mulberry leaves. f The expression of Morus017734 and Morus025913 in mulberry leaves treated with and without 5-azacytidine. All the expression levels were normalized to the expression of the mulberry actin gene. Error bars indicate SDs, n = 3 (*P-value < 0.05, two-tailed t-test)
Fig. 8
Fig. 8. Silencing of MnMET1 in mulberry leaves resulted in increased resistance.
Relative expression levels of MnAGO4 (a) and MnMET1 (b) in mulberry leaves collected from three replicates injected with MMDaV+2mDNA1, MMDaV+2mDNA1-AGO4, and MMDaV+2MDNA1-MET1. All the expression levels were normalized to the expression of the mulberry actin gene. Error bars indicate SDs, n = 3 (*P-value < 0.05, two-tailed t-test). c Mulberry leaves inoculated with B. cinerea were photographed at 3 days after inoculation. d Quantitative analyses of the resistance to B. cinerea of mulberry leaves injected with MMDaV+2mDNA1, MMDaV+2mDNA1-AGO4, and MMDaV+2MDNA1-MET1

Similar articles

Cited by

References

    1. Dean R, et al. The Top 10 fungal pathogens in molecular plant pathology. Mol. Plant Pathol. 2012;13:414–430. doi: 10.1111/j.1364-3703.2011.00783.x. - DOI - PMC - PubMed
    1. Legard DE, Xiao CL, Mertely JC, Chandler CK. Effects of plant spacing and cultivar on incidence of Botrytis fruit rot in annual strawberry. Plant Dis. 2000;84:531–538. doi: 10.1094/PDIS.2000.84.5.531. - DOI - PubMed
    1. Angelini RMD, et al. Occurrence of fungicide resistance in populations of Botryotinia fuckeliana (Botrytis cinerea) on table grape and strawberry in southern Italy. Pest Manag. Sci. 2014;70:1785–1796. doi: 10.1002/ps.3711. - DOI - PubMed
    1. Lamichhane JR, Dachbrodt-Saaydeh S, Kudsk P, Messean A. Toward a reduced reliance on conventional pesticides in European agriculture. Plant Dis. 2016;100:10–24. doi: 10.1094/PDIS-05-15-0574-FE. - DOI - PubMed
    1. Dowen RH, et al. Widespread dynamic DNA methylation in response to biotic stress. Proc. Natl Acad. Sci. USA. 2012;109:E2183–E2191. doi: 10.1073/pnas.1209329109. - DOI - PMC - PubMed