. 2021 Jul 1;8(1):157.
doi: 10.1038/s41438-021-00591-2.

Integrative iTRAQ-based proteomic and transcriptomic analysis reveals the accumulation patterns of key metabolites associated with oil quality during seed ripening of Camellia oleifera

Affiliations

Integrative iTRAQ-based proteomic and transcriptomic analysis reveals the accumulation patterns of key metabolites associated with oil quality during seed ripening of Camellia oleifera

Zhouchen Ye et al. Hortic Res. .

Abstract

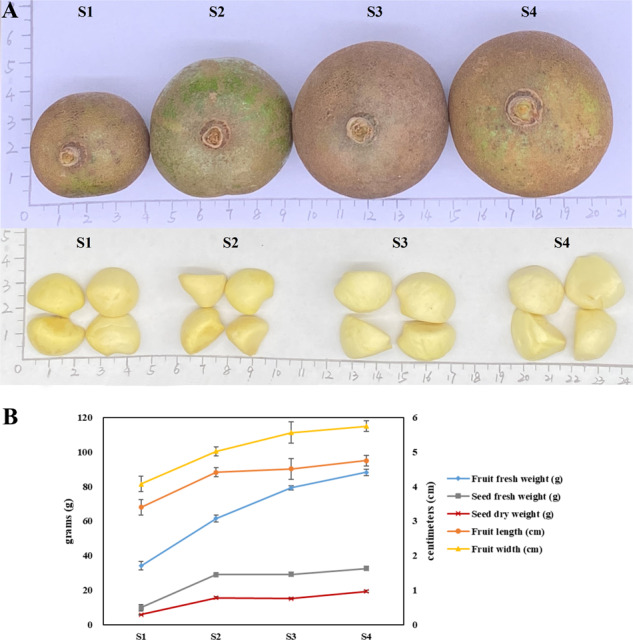
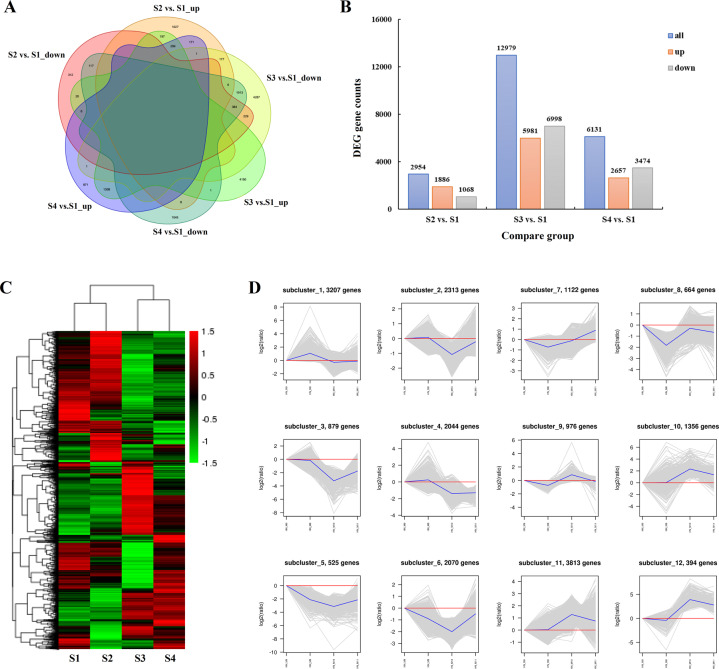
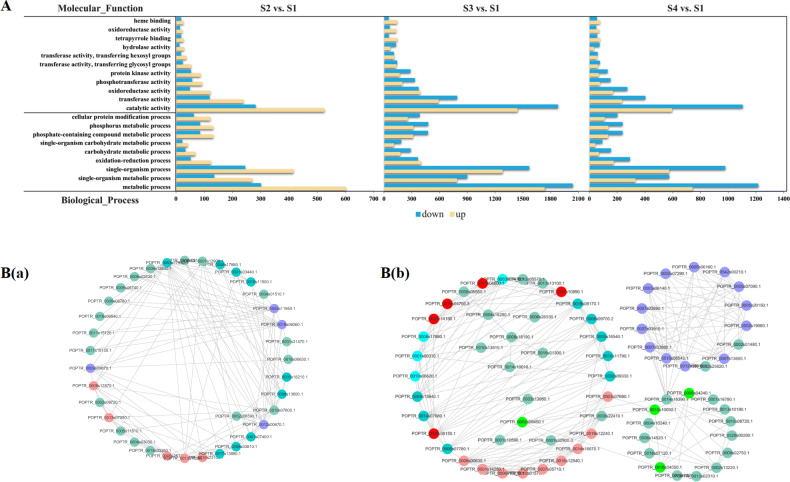
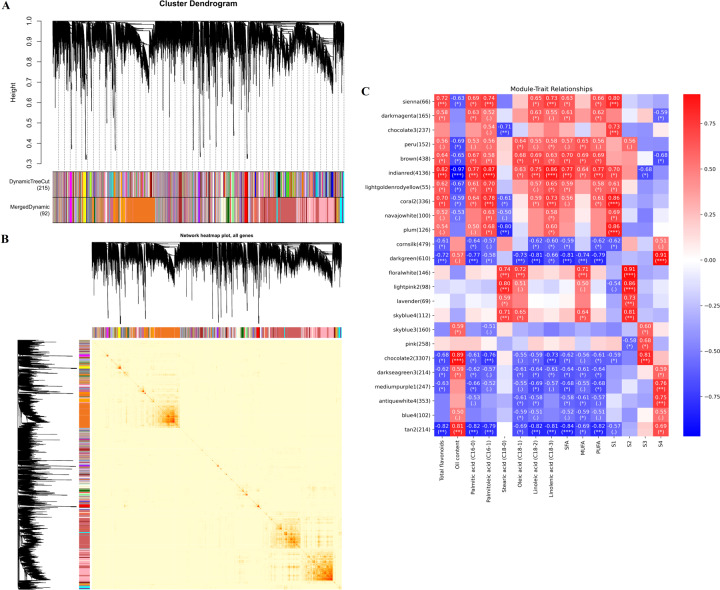
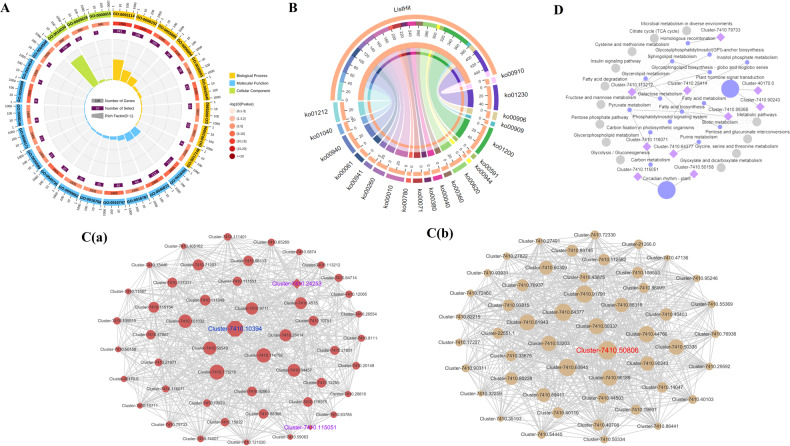
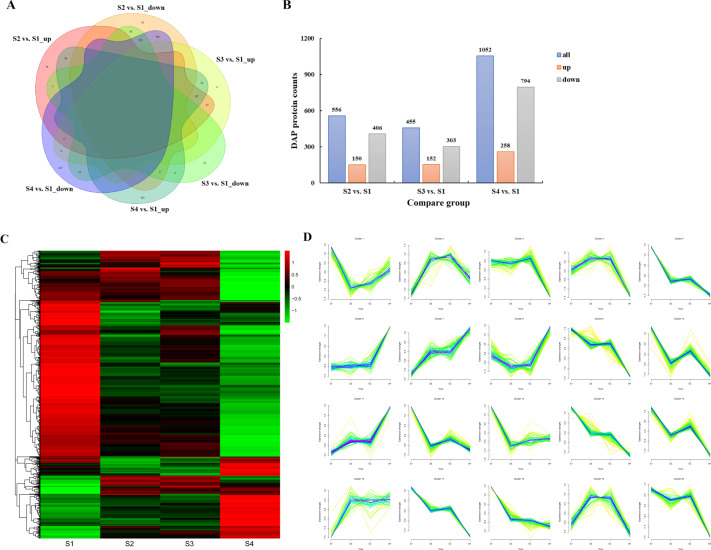
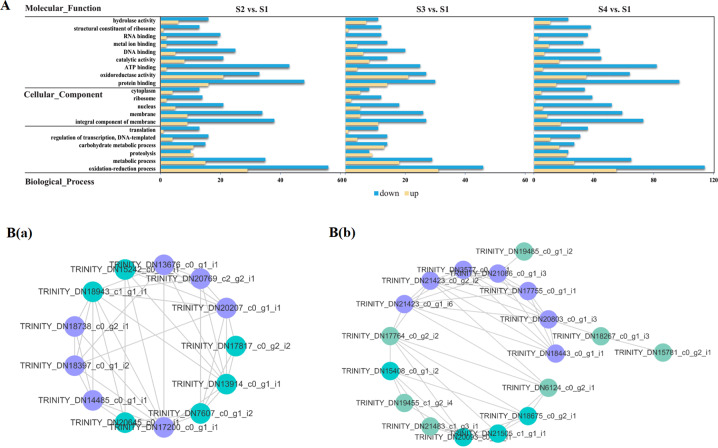
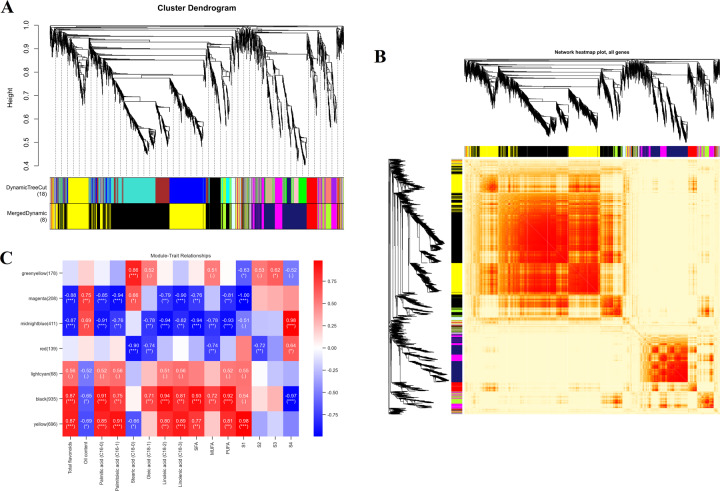
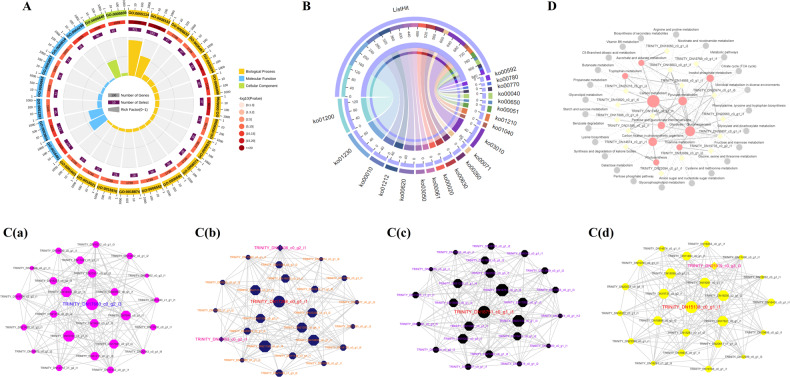
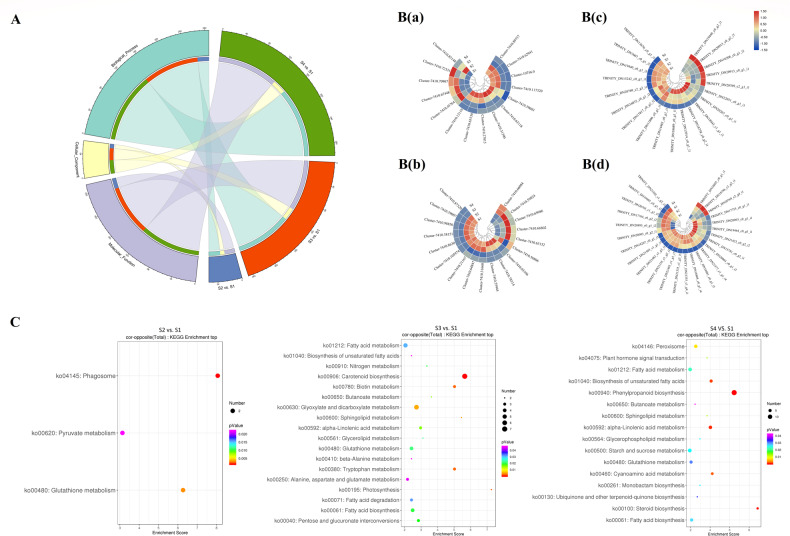
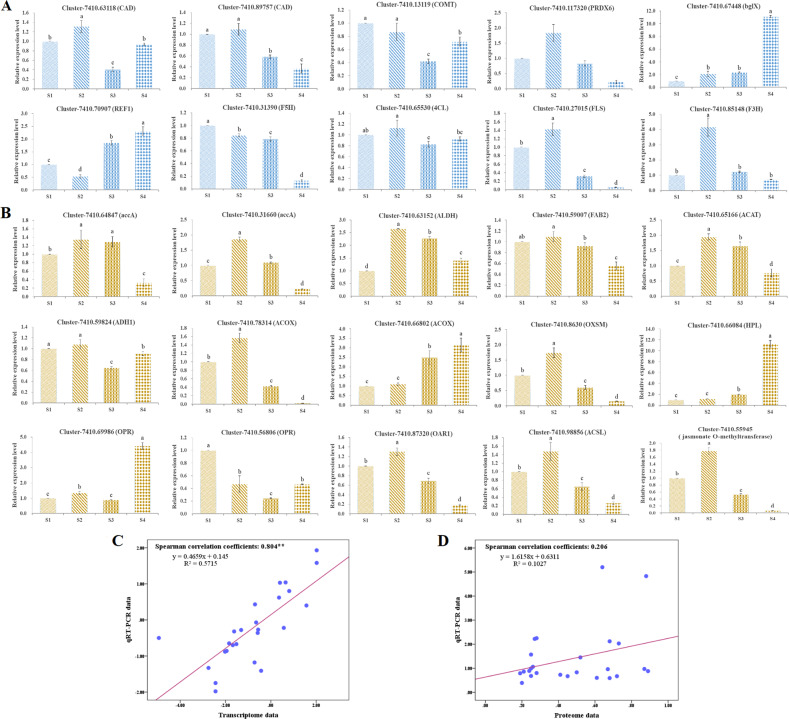
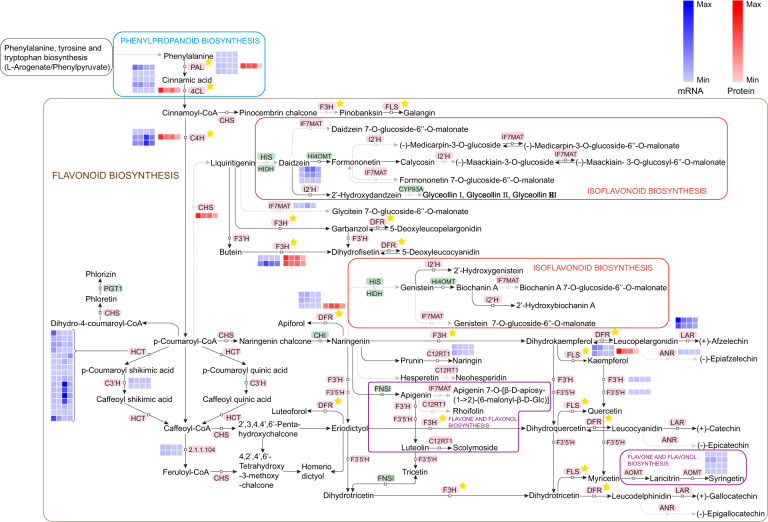
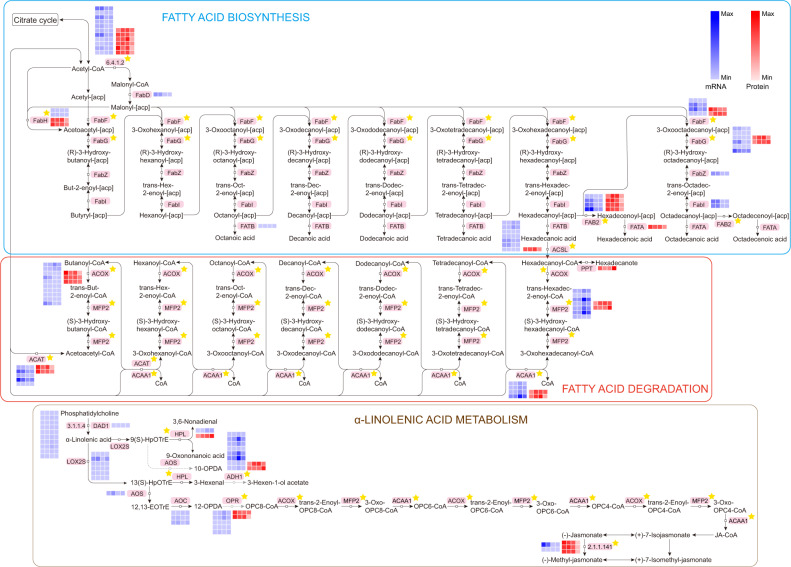
Camellia oleifera (C. oleifera) is one of the four major woody oil-bearing crops in the world and has relatively high ecological, economic, and medicinal value. Its seeds undergo a series of complex physiological and biochemical changes during ripening, which is mainly manifested as the accumulation and transformation of certain metabolites closely related to oil quality, especially flavonoids and fatty acids. To obtain new insights into the underlying molecular mechanisms, a parallel analysis of the transcriptome and proteome profiles of C. oleifera seeds at different maturity levels was conducted using RNA sequencing (RNA-seq) and isobaric tags for relative and absolute quantification (iTRAQ) complemented with gas chromatography-mass spectrometry (GC-MS) data. A total of 16,530 transcripts and 1228 proteins were recognized with significant differential abundances in pairwise comparisons of samples at various developmental stages. Among these, 317 were coexpressed with a poor correlation, and most were involved in metabolic processes, including fatty acid metabolism, α-linolenic acid metabolism, and glutathione metabolism. In addition, the content of total flavonoids decreased gradually with seed maturity, and the levels of fatty acids generally peaked at the fat accumulation stage; these results basically agreed with the regulation patterns of genes or proteins in the corresponding pathways. The expression levels of proteins annotated as upstream candidates of phenylalanine ammonia-lyase (PAL) and chalcone synthase (CHS) as well as their cognate transcripts were positively correlated with the variation in the flavonoid content, while shikimate O-hydroxycinnamoyltransferase (HCT)-encoding genes had the opposite pattern. The increase in the abundance of proteins and mRNAs corresponding to alcohol dehydrogenase (ADH) was associated with a reduction in linoleic acid synthesis. Using weighted gene coexpression network analysis (WGCNA), we further identified six unique modules related to flavonoid, oil, and fatty acid anabolism that contained hub genes or proteins similar to transcription factors (TFs), such as MADS intervening keratin-like and C-terminal (MIKC_MADS), type-B authentic response regulator (ARR-B), and basic helix-loop-helix (bHLH). Finally, based on the known metabolic pathways and WGCNA combined with the correlation analysis, five coexpressed transcripts and proteins composed of cinnamyl-alcohol dehydrogenases (CADs), caffeic acid 3-O-methyltransferase (COMT), flavonol synthase (FLS), and 4-coumarate: CoA ligase (4CL) were screened out. With this exploratory multiomics dataset, our results presented a dynamic picture regarding the maturation process of C. oleifera seeds on Hainan Island, not only revealing the temporal specific expression of key candidate genes and proteins but also providing a scientific basis for the genetic improvement of this tree species.


Conflict of interest statement

The authors declare no competing interests.

Figures

Fig. 1
Fig. 1. Development of C. oleifera seeds.
A Phenotypic characterization of C. oleifera seeds in four growth periods. S1, nutrition synthesis stage; S2, fat accumulation stage; S3, mature stage; and S4, late mature stage. B Changes in morphological indexes of developing fruits and seeds. Data represent the mean values from three biological replicates, and error bars indicate standard deviations
Fig. 2
Fig. 2. Expression analysis and quantitative comparison of the identified DEGs in developing C. oleifera seeds.
A Venn diagram of the shared and unique DEGs among three compared pairs (S2 vs. S1, S3 vs. S1, S4 vs. S1, S1 as the control). B Numbers of up- and downregulated unigenes in different comparisons. C Hierarchical clustering analysis of the identified DEGs across four growth periods of seeds. The horizontal axis represents the sample clusters, and colors from green to red indicate gene expression from low to high. D The expression trends of the identified DEGs. Gene abundance is expressed as log2-fold change (y-axis), and developmental stages are outlined on the x-axis, with the S1 stage as the zero point
Fig. 3
Fig. 3. GO-based functional classification and protein–protein interactions of the identified DEGs in developing C. oleifera seeds.
A Top 20 GO categories for the identified DEGs in the transcriptome. Bar diagrams indicate the number of DEGs that were up- and downregulated (x-axis), annotated with functions (y-axis) for different compared groups. B Interaction networks among the predicted unique proteins involved in flavonoid biosynthesis (a) and fatty acid metabolism (b) pathways. The network nodes represent proteins, and the edges represent predicted functional associations between two proteins. Detailed information on protein names and abbreviations is found in Table S7
Fig. 4
Fig. 4. Weighted gene coexpression network analysis (WGCNA) of the identified genes in developing C. oleifera seeds.
A Gene dendrogram obtained by clustering the dissimilarity based on consensus topological overlap, with each tree branch constituting a module and each leaf representing one gene. Each colored row indicates a color-coded module that contains a group of highly interconnected genes. B Heatmap plot of topological overlap in the gene network. Darker squares along the diagonal correspond to modules. C Module eigengene physiological indexes and sample correlations. The numbers in colored rectangles represent gene numbers in the module. The color scale bar on the right shows the correlation range from negative to positive
Fig. 5
Fig. 5. Enrichment analysis and gene networks of WGCNA modules in developing C. oleifera seeds.
A GO circle plot displaying gene annotation enrichment analysis. B The top 20 KEGG pathway enrichment categories of these genes. Detailed information is listed in Table S8. C Cytoscape represents the top 50 coexpressed genes in the “indianred” (a) and “tan2” (b) modules. D KEGG pathway enrichment analysis of the hub genes
Fig. 6
Fig. 6. Expression analysis and quantitative comparison of the recognized DAPs in developing C. oleifera seeds.
A Venn diagram of the shared and unique DAPs among three pairwise comparisons (S2 vs. S1, S3 vs. S1, S4 vs. S1, S1 as the control). The overlapping regions indicate the number of shared proteins. B Histogram showing the number of up- and downregulated DAPs in each compared group. C Hierarchical cluster heatmap of the recognized DAPs in four development periods. The colored bars indicate the changes in protein abundance after normalization; similar colors displayed by DAPs represent high correlation coefficients. The green color represents a low expression level, and the red color represents a high expression level. D Space-time clustering analysis of the recognized DAPs in developing C. oleifera seeds
Fig. 7
Fig. 7. GO-based functional classification and protein–protein interactions of the recognized DAPs in developing C. oleifera seeds.
A Top 20 GO categories for the recognized DAPs in the proteome. Yellow and blue bars represent up- and downregulated proteins in three main GO domains, respectively. B Interaction networks among the unique proteins involved in flavonoid biosynthesis (a) and fatty acid metabolism (b) pathways. The network nodes represent proteins, and the edges represent predicted functional associations between two proteins. Detailed information on protein names and abbreviations is found in Supplementary Table S13
Fig. 8
Fig. 8. Weighted gene coexpression network analysis (WGCNA) of the identified proteins in developing C. oleifera seeds.
A Protein dendrogram obtained by clustering the dissimilarity based on consensus topological overlap, with each tree branch constituting a module and each leaf representing one protein. Each colored row indicates a color-coded module that contains a group of highly interconnected proteins. B Heatmap plot of the topological overlap in the protein network. Darker squares along the diagonal correspond to modules. C Module eigengene physiological indexes and sample correlations. The numbers in colored rectangles represent protein numbers in the module. The color scale bar on the right shows the correlation range from negative to positive
Fig. 9
Fig. 9. Enrichment analysis and protein networks of WGCNA modules in developing C. oleifera seeds.
A GO circle plot displaying protein annotation enrichment analysis. B The top 20 KEGG pathway enrichment categories of these proteins. Detailed information is listed in Table S14. C Cytoscape represents the top 50 coexpressed proteins in the “indianred” (a) and “tan2” (b) modules. D KEGG pathway enrichment analysis of the hub proteins
Fig. 10
Fig. 10. Enrichment analysis and hierarchical cluster heatmap of the coexpressed DEGs and DAPs.
A GO analysis of the cognate DEGs and DAPs in the three pairwise comparisons with the smallest p values (< 0.05) and no fewer than two members. B Abundance patterns of unigenes related to flavonoid biosynthesis (a) and fatty acid metabolism (b) pathways. Abundance patterns of the proteins related to flavonoid biosynthesis (c) and fatty acid metabolism (d) pathways. Z-score fold change values are shown on a color scale that is proportional to the abundance of each member. C KEGG pathway enrichment of the three comparative analyses. The rich factor is the percentage of members out of the total number detected. The bubble size represents the number of members detected in the KEGG pathway, and the color of the bubble represents the p value
Fig. 11
Fig. 11. qRT-PCR verification of the expression profiles in developing C. oleifera seeds.
The relative expression levels of candidate genes were calculated according to the 2−ΔΔCt method using GAPDH as an internal reference gene. All data represent the mean values ± standard error of three biological replicates. Different letters above the columns indicate significant differences in seeds at four developmental phases based on one-way ANOVA (p < 0.05). The blue and yellow colors represent the genes associated with flavonoid biosynthesis (A) and fatty acid metabolism (B) pathways, respectively. Linear regression between the levels of qRT-PCR data and transcript expression (C) and protein accumulation (D)
Fig. 12
Fig. 12. Visualization of protein and transcript expression in a biochemical pathway map related to flavonoid biosynthesis in developing C. oleifera seeds.
The heatmap was plotted using fold change values from proteome data and log2 transformed gene expression values. Black characters with a pink background are enzymes. The asterisks represent the coexpression of encoded unigenes and proteins. Z-score fold change values are shown on a color scale that is proportional to the abundance of each unigene and protein
Fig. 13
Fig. 13. Visualization of protein and transcript expression in a biochemical pathway map related to fatty acid metabolism in developing C. oleifera seeds.
The heatmap was plotted using fold change values from proteome data and log2 transformed gene expression values. Black characters with a pink background are enzymes. The asterisks represent the coexpression of encoded unigenes and proteins. Z-score fold change values are shown on a color scale that is proportional to the abundance of each unigene and protein

References

    1. Zhang SY, et al. Application of steam explosion in oil extraction of camellia seed (Camellia oleifera Abel.) and evaluation of its physicochemical properties, fatty acid, and antioxidant activities. Food Sci. Nutr. 2019;7:1004–1016. doi: 10.1002/fsn3.924. - DOI - PMC - PubMed
    1. Jin XC. Bioactivities of water-soluble polysaccharides from fruit shell of Camellia oleifera Abel: antitumor and antioxidant activities. Carbohyd. Polym. 2012;87:2198–2201. doi: 10.1016/j.carbpol.2011.10.047. - DOI
    1. Su MH, Shih MC, Lin KH. Chemical composition of seed oils in native Taiwanese Camellia species. Food Chem. 2014;156:369–373. doi: 10.1016/j.foodchem.2014.02.016. - DOI - PubMed
    1. Guo N, Tong TT, Ren N, Tu YY, Li B. Saponins from seeds of genus Camellia: phytochemistry and bioactivity. Phytochemistry. 2018;149:42–55. doi: 10.1016/j.phytochem.2018.02.002. - DOI - PubMed
    1. Zhang W, et al. Determination of the evolutionary pressure on Camellia oleifera on Hainan Island using the complete chloroplast genome sequence. PeerJ. 2019;7:e7210. doi: 10.7717/peerj.7210. - DOI - PMC - PubMed