. 2021 Jun 30;12(1):4050.
doi: 10.1038/s41467-021-24391-3.

SETBP1 accumulation induces P53 inhibition and genotoxic stress in neural progenitors underlying neurodegeneration in Schinzel-Giedion syndrome

Affiliations

SETBP1 accumulation induces P53 inhibition and genotoxic stress in neural progenitors underlying neurodegeneration in Schinzel-Giedion syndrome

Federica Banfi et al. Nat Commun. .

Abstract

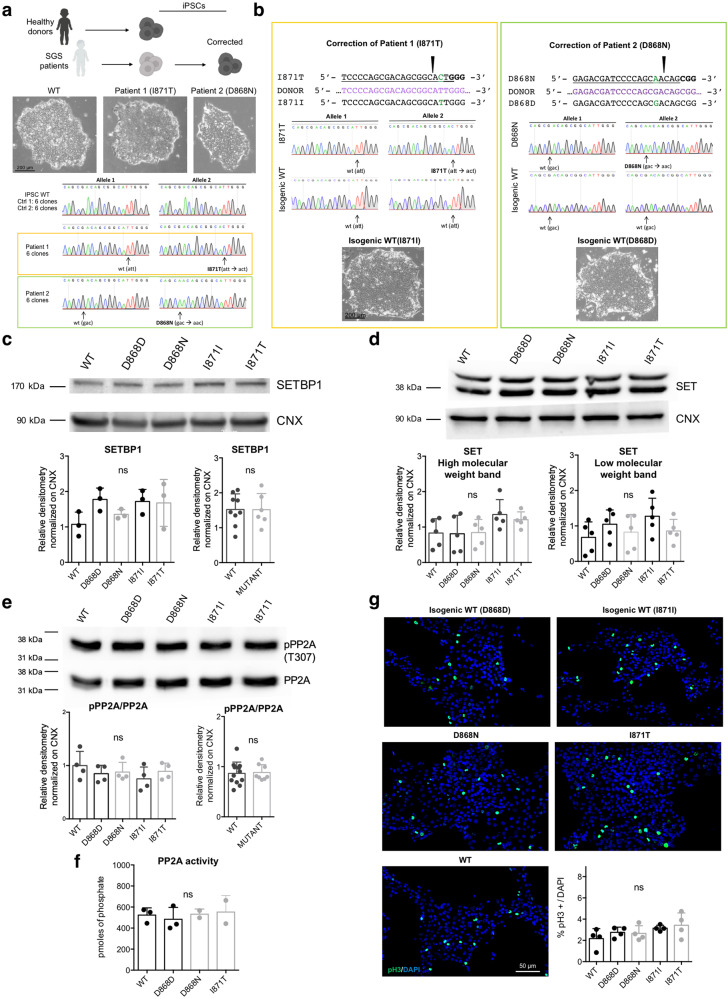
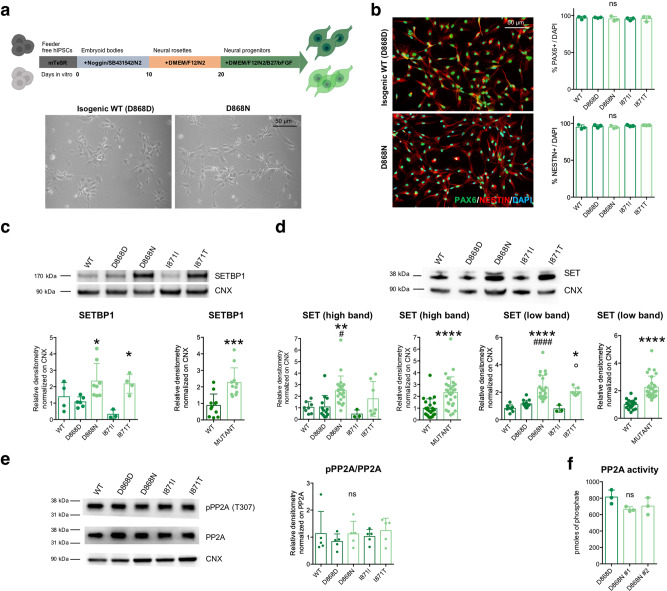
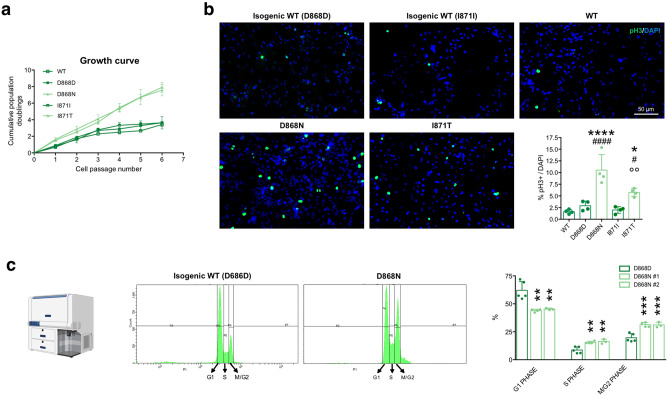
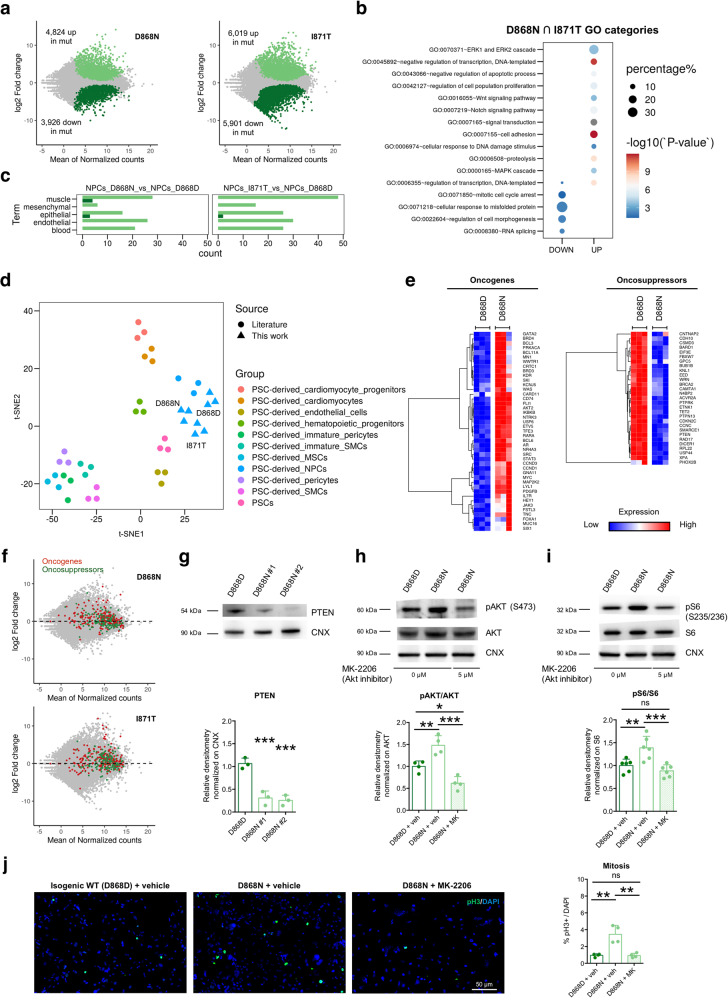
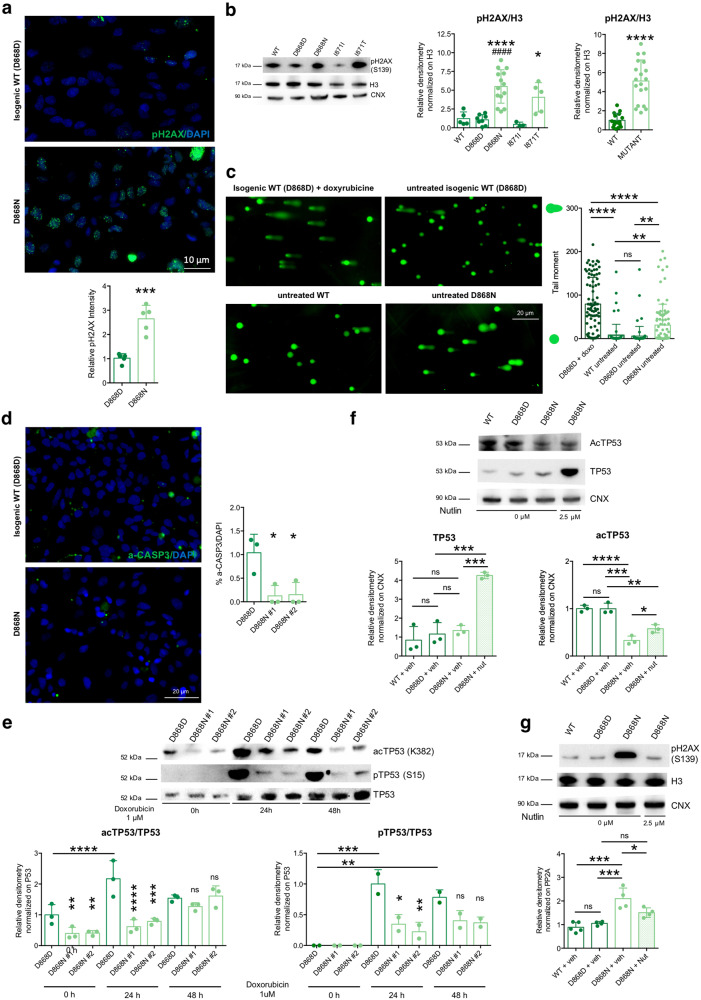
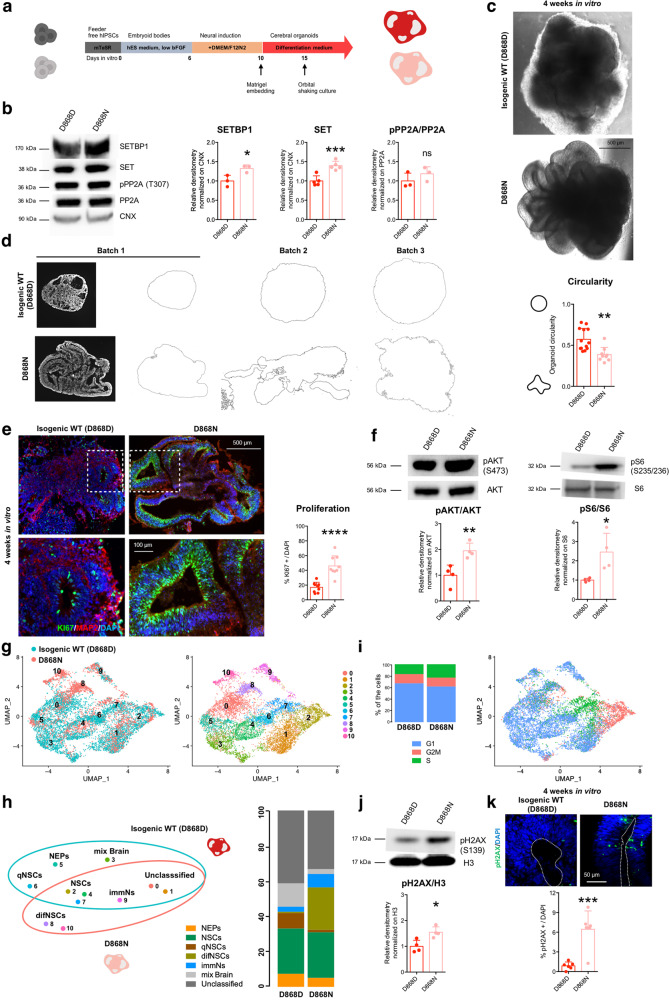
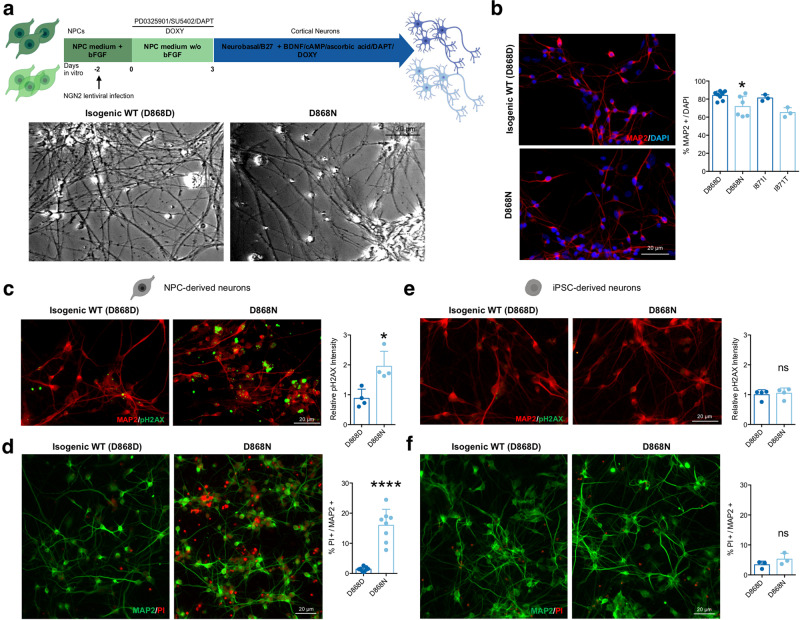
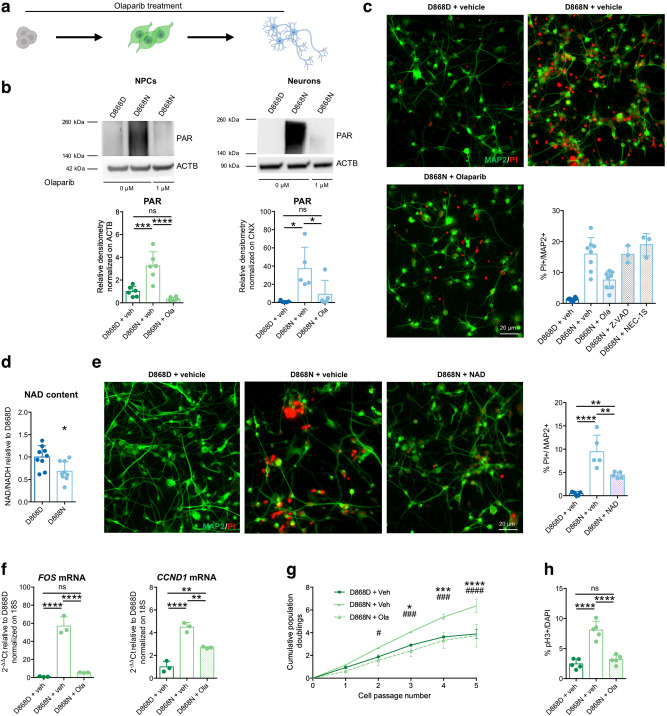
The investigation of genetic forms of juvenile neurodegeneration could shed light on the causative mechanisms of neuronal loss. Schinzel-Giedion syndrome (SGS) is a fatal developmental syndrome caused by mutations in the SETBP1 gene, inducing the accumulation of its protein product. SGS features multi-organ involvement with severe intellectual and physical deficits due, at least in part, to early neurodegeneration. Here we introduce a human SGS model that displays disease-relevant phenotypes. We show that SGS neural progenitors exhibit aberrant proliferation, deregulation of oncogenes and suppressors, unresolved DNA damage, and resistance to apoptosis. Mechanistically, we demonstrate that high SETBP1 levels inhibit P53 function through the stabilization of SET, which in turn hinders P53 acetylation. We find that the inheritance of unresolved DNA damage in SGS neurons triggers the neurodegenerative process that can be alleviated either by PARP-1 inhibition or by NAD + supplementation. These results implicate that neuronal death in SGS originates from developmental alterations mainly in safeguarding cell identity and homeostasis.


Conflict of interest statement

The authors declare no competing interests.

Figures

Fig. 1
Fig. 1. SGS iPSCs do not display of SETBP1 accumulation.
a Fibroblast reprogramming from age-matched healthy donors (2) and SGS patients (2) and correction of patient-derived iPSCs (upper panel). Representative bright-field images (taken at the same magnification) of iPSC colonies derived from a healthy donor and SGS patients, (middle panel). Sanger sequencing confirmed the presence of the indicated mutations (lower panel, n = 6). b Back-mutation strategy in patients-derived iPSCs. For each patient, the mutation (green aa) was targeted with CRIPSR/Cas9, and the correction was confirmed by Sanger sequencing (correction efficiency: 1/48 clones for pt.1, 1/24clones for pt.2). Representative bright-field images (taken at the same magnification) of colonies from both isogenic corrected iPSC lines. c SETBP1 immunoblotting in isogenic control (D868D and I871I), mutant (D868N and I871T) and WT iPSCs and relative quantification. D868D vs. D868N P = 0.6973, I871I vs. I871T P > 0.9999; WT vs. MUT P = 0.9798. n = 3. d ET immunoblotting in isogenic control and mutant iPSCs and relative quantification. See Supplementary Dataset 3 for details of statistical analysis and Supplementary Fig. 1f for WT vs. MUT comparisons. n = 5. e Total and phosphorylated (pPP2A Tyr307) PP2A immunoblotting in isogenic control and mutant iPSCs and relative quantification of pPP2A/PP2A ratio. WT vs. D868D P = 0.8163; WT vs. D868N P = 0.9085; WT vs. I871I P = 0.4326; WT vs. I871T P = 0.9383; D868D vs. D868N P = 0.9994, I871I vs. I871T P = 0.8531; WT vs. MUT P = 0.8363. n = 4. f PP2A phosphatase activity in isogenic control and mutant iPSCs. D868D vs. D868N P = 0.9487, D868D vs. I871T P = 0.8743, WT vs. I871T P = 0.9882 n = 3. g Phosphorylated H3 (pH3 Ser10) immunostaining in isogenic control and mutant iPSCs and quantification. D868D vs. D868N P = 0.9998, I871I vs. I871T P = 0.9868, see Supplementary Fig. 1g for WT vs. MUT comparison. n = 4. All data expressed as mean ± SEM. ns: nonsignificant differences when P > 0.05. Images taken at the same magnification. cg One-way ANOVA followed by Tukey post hoc test for multiple comparisons, except for WT vs. MUT comparisons two-sided unpaired t test in c and e.
Fig. 2
Fig. 2. SGS NPCs display features of SETBP1 accumulation.
a NPC generation protocol (upper panel) and representative bright-field images of isogenic control (D868D) and mutant (D868N) NPCs. b Representative images (taken at the same magnification) of NESTIN (P = 0.3897) and PAX6 (P = 0.8436) immunostaining and relative quantification. n = 3. See also Supplementary Fig. 2a. c SETBP1 immunoblotting in WT, isogenic control (D868D and I871I) and mutant (D868N and I871T) NPCs and relative quantification. * indicates statistic test between isogenic cell line pairs. P = 0.0048; WT vs. D868D P = 0.9686; WT vs. D868N P = 0.2983; WT vs. I871I P = 0.3912; WT vs. I871T P = 0.6119; D868D vs. D868N *P = 0.0465; I871I vs. I871T *P = 0.0361; D868N vs. I871T P = 0.9966. WT vs. MUT ***P = 0.0004. n = 3. d SET immunoblotting in WT, isogenic control and mutant NPCs and relative quantification * indicates statistic test between isogenic cell line pairs. # refers to the comparison between each mutant cell line with the unrelated WT. ° refers to the comparison between mutant NPCs. n = 3. See Supplementary Dataset 3 for details of statistical analysis. e r total and phosphorylated PP2A (pPP2A Tyr307) immunoblotting in WT, isogenic control and mutant NPCs and relative quantification of pPP2A/PP2A ratio. P = 0.7713. D868D vs. D868N P = 0.8981, I871I vs. I871T P = 0.9576; See Supplementary Fig. 2e for WT vs. MUT comparisons. n = 5. f Phosphatase activity assay of PP2A in isogenic control and mutant NPCs. P = 0.1343, D868D vs. D868N #1 P = 0.1315, D868D vs. D868N #2 P = 0.2760. #1 and #2 refer to two independent clones of the D868N IPSC line. n = 3. All data expressed as mean ± SEM. ns: nonsignificant differences when P > 0.05; P < 0.05, ∗∗P < 0.01, ∗∗∗P < 0.001, ∗∗∗∗P < 0.0001. bf One-way ANOVA followed by Tukey post hoc test for multiple comparisons, except for WT vs. MUT comparisons two-sided unpaired t test in c and d.
Fig. 3
Fig. 3. SGS NPCs display overproliferation.
a Growth curve analysis of WT, isogenic control, and mutant NPCs See Supplementary Dataset 3 for statistical analysis. n = 3. b NPC proliferation assay by phosphorylated H3 (pH3 Ser10) immunostaining and quantification in WT, isogenic control, and mutant NPCs. * indicates statistic test between isogenic cell line pairs, # refers to the comparison between each mutant cell line with the unrelated WT one, ° refers to the comparison between mutant NPCs. P < 0.0001; WT vs. D868D P = 0.8012; WT vs. D868N ####P < 0.0001; WT vs. I871I P = 0.9972; WT vs. I871T #P = 0.0202; D868D vs. D868N ****P < 0.0001; I871I vs. I871T *P = 0.0377; D868N vs. I871T °°P = 0.0068. See Supplementary Fig. 2f for WT vs. MUT comparisons. n = 4. Images taken at the same magnification. c Cell cycle analysis by PI staining and FACS quantification; graphs showing different peak distribution indicating different cell cycle phases in isogenic control and mutant NPCs. Bar graph shows the percentage of cells present in each phase in D868D and D868N cells. G1: D868D vs. D868N #1 ****P = <0.0001, D868D vs. D868N #2 ****P < 0.0001; S: D868D vs. D868N #1 *P = 0.0311, D868D vs. D868N #2 *P = 0.0253; M-G2: D868D vs. D868N #1 ***P = 0.0002, D868D vs. D868N #2 ***P = 0.0007. n = 3 independent experiments. All data expressed as mean ± SEM. ns: nonsignificant differences when P > 0.05; P < 0.05, ∗∗P < 0.01, ∗∗∗P < 0.001, ∗∗∗∗P < 0.0001. a, c Two-way ANOVA followed by Tukey post hoc test for multiple comparisons, b one-way ANOVA followed by Tukey post hoc test for multiple comparisons.
Fig. 4
Fig. 4. SGS mutations lead to profound gene dysregulation and oncogenic signature.
a MA plot showing log2-fold changes as a function of average gene expression for isogenic pairs of NPCs. Differentially expressed genes highlighted with their respective color codes. b Enrichment plot displaying relative enrichment (%; size) and statistical significance (−log10 P value; color scale) of gene ontology categories of interest in SGS lines. c Histograms showing the number of GO categories relative to the indicated different lineages, calculated in the list of genes upregulated in controls (dark green) and mutant NPCs (light green) as in RNA-seq dataset. d Whole transcriptome dimensionality reduction by t-SNE highlighting the similarities between D868D, I871T, and D868N NPCs in comparison with other pluripotent stem cell derivatives (data from literature), including NPCs. e Gene expression heatmaps of upregulated oncogenes and downregulated oncosuppressors in D868N vs. D868D NPCs. f COSMIC Oncogenes (red) and oncosuppressor genes (green) among the transcriptomic profiles of the two mutations, shown as highlighted dots in the MA plots. g PTEN immunoblotting in isogenic control and mutant NPCs (#1 and #2: independent clones): D868D vs. D868N #1 ***P = 0.0010, D868D vs. D868N #2 ***P = 0.0007, n = 3. h Total and phosphorylated AKT (pAKT Ser473) immunoblotting in isogenic control (+vehicle) and mutant NPCs (+vehicle or MK-2206 AKT inhibitor) and quantification as pAKT/AKT ratio. D868D + veh vs. D868N + veh **P = 0.0079, D868D + veh vs. D868N + MK *P = 0.0261, D868N + veh vs. D868N + MK ***P = 0.0001, n = 4. i Total and phosphorylated S6 (pS6 Ser235 and pS6 Ser236) immunoblotting in isogenic control (+vehicle) and mutant NPCs (+vehicle or MK-2206) and quantification as pS6/S6 ratio. D868D + veh vs. D868N + veh **P = 0.0063, D868D + veh vs. D868N + MK P = 0.5338, D868N + veh vs. D868N + MK ***P = 0.0007. n = 6. j NPC proliferation assay by phosphorylated H3 (pH3 Ser10) immunostaining in isogenic control (+vehicle) and mutant NPCs (+vehicle or MK-2206). D868D + veh vs. D868N + veh ***P = 0.0009, D868D + veh vs. D868N + MK P = 0.9990, D868N + veh vs. D868N + MK ***P = 0.0009. n = 4. Data expressed as mean ± SEM. P < 0.05, ∗∗P < 0.01; ***P < 0.001, ****P < 0.0001. Images taken at the same magnification. gj Data are analyzed by one-way ANOVA followed by Tukey’s post hoc test for multiple comparisons.
Fig. 5
Fig. 5. SETBP1 accumulation causes P53 hypofunctioning.
a Phosphorylated histone H2AX (pH2AX Ser139), immunostaining in isogenic control (D868D), and mutant (D868N) NPCs and quantification. ***P = 0.0003. n = 5. Images taken at the same magnification. b pH2AX (Ser139) immunoblotting and quantification in WT, isogenic control (D868D, I871I) and mutant (D868N, I871T) NPCs. * indicates statistic test between isogenic cell line pairs, # refers to the comparison between each mutant cell line with the unrelated WT one. WT vs. D868D P = 0.9999; WT vs. D868N P = 0.0003; WT vs. I871I P = 0.9720; WT vs. I871T P = 0.0872; D868D vs. D868N P < 0.0001; I871I vs. I871T P = 0.0497; D868N vs. I871T P = 0.4922, WT vs. MUT ****P < 0.0001. n = 3. c Representative images (taken at the same magnification) of alkaline comet assay in NPCs, and quantification of tail moment, in WT, isogenic control (D868D) and mutant (D868N) NPCs. D868D progenitors doxorubicin-treated (Doxo) added as a positive control. n = 70 cells per group from three independent experiments, D868D + Doxo vs. WT-Untreated ****P < 0.0001; D868D + Doxo vs. D868D-Untreated ****P < 0.0001; D868D + Doxo vs. D868N-Untreated ****P < 0.0001; WT-Untreated vs. D868D-Untreated P = 0.9918; WT-Untreated vs. D868N-Untreated **P = 0.0047; D868D-Untreated vs. D868N-Untreated **P = 0.0015. d Activated-CASPASE3 (Asp175-cleaved) immunostaining and quantification in isogenic control (D868D) and mutant (D868N) NPCs. P = 0.0155. n = 3. Images taken at the same magnification. e Acetylated and phosphorylated TP53 (acTP53 Lys382, pTP53 Ser15) immunoblotting upon DNA damage induction (1 μM doxorubicin treatment for the indicated time) in isogenic control (D868D) and mutant (D868N) NPCs. See Supplementary Dataset 3 for details of statistical analysis. n = 3. f I TP53 immunoblotting and quantification after Nutlin-3a treatment (WT + vehicle vs. D868D + vehicle P = 0.8558, D868D + vehicle vs. D868N + vehicle P = 0.9658, WT + vehicle vs. D868N + Nut ***P = 0.0001, D868N + vehicle vs. D868N + nutlin ***P = 0.0004, D868D + vehicle vs. D868N + nutlin ***P = 0.0003). acTP53 immunoblotting and quantification after Nutlin-3a treatment (WT + vehicle vs. D868D + vehicle P = 0.9999, D868D + vehicle vs. D868N + vehicle ***P = 0.0001, WT + vehicle vs. D868N + Nut **P = 0.0022, D868N + vehicle vs. D868N + nutlin *P = 0.0466, D868D + vehicle vs. D868N + nutlin **P = 0.0024). n = 4. g pH2AX immunoblotting and quantification after Nutlin-3a treatment (WT + vehicle vs. D868D + vehicle P = 0.9479, D868D + vehicle vs. D868N + vehicle ***P = 00006, WT + vehicle vs. D868N + Nut P = 0.0504, D868N + vehicle vs. D868N + nutlin *P = 0.0354, D868D + vehicle vs. D868N + nutlin P = 0.1245). n = 4. All data expressed as mean ± SEM. ns: nonsignificant differences when P > 0.05; P < 0.05, ∗∗P < 0.01, ∗∗∗P < 0.001, ∗∗∗∗P < 0.0001. bg One-way ANOVA followed by Tukey’s post hoc test for multiple comparisons, except for WT vs. MUT comparisons two-sided unpaired t test in b. a Two-sided unpaired t test.
Fig. 6
Fig. 6. Mutant organoids recapitulate SGS-associated features.
a Scheme for cerebral organoid generation protocol. b SETBP1-SET-PP2A axis in cerebral organoids: immunoblotting for SETBP1 (*P = 0.0329, n = 3), SET (***P = 0.0009, n = 5) and pPP2A/PP2A ratio (P = 0.3084, n = 3) in isogenic control (D868D) and mutant (D868N) organoids. c Representative bright-field images (taken at the same magnification) of D868D and D868N organoids. d Evaluation of gross morphological appearance of control and mutant organoids. Images (taken at the same magnification) of serial histological sections from 4-week-old organoids from three independent batches were converted into outlines for the quantification of the perimeter and circularity. **P = 0.0015. b = 3 (batches), o ≥ 9 (organoids). e KI67and MAP2 immunostaining of cryo-sections of D868D and D868N organoids. Insets indicate the magnifications below (left). Quantification of KI67 + /DAPI cells in representative ventricular-like structures (right, ****P < 0.0001). b = 3 (batches), o = 3 (organoids), v = 9 (ventricles). Images taken at the same magnification. f Left, total and phosphorylated AKT (pAKT Ser473) immunoblotting and quantification of pAKT/AKT ratio in D868D and D868N organoids. (**P = 0.0085). Right, total and phosphorylated S6 (pS6 pS6 Ser235, pS6 Ser236) immunoblotting and quantification of pS6/S6 ratio in D868D and D868N organoids. (*P = 0.0253,). n = 4. g Left, UMAP plot showing the distribution of cells from 4-week-old organoids of SGS genotype (D868N, salmon) and isogenic control (D868D, light blue). Right, UMAP plot of cells from 4-week-old organoids of D868N and D868D showing 10 clusters (resolution 0.7). h Left, cluster categorization (NEPs = neuroepithelial cells; NSCs = neural stem cells; qNSCs = quiescent NSCs; difNSCs = differentiating NSCs; immNs = immature neurons; mix Brain = cells of several stages from different cell regions) and diffusion among genotypes. Right, bar plots of the enrichment of the different cluster categories within the two genotypes. i Left, cell cycle distribution in 4-week-old organoids of D868N and D868D. Right, UMAP plot of cells from 4-week-old organoids of D868N D868D showing cell cycle distribution. j pH2AX (Ser139) immunoblotting and quantification in D868D and D868N organoids. (**P = 00019n = 4). k Phosphorylated histone H2AX (pH2AX Ser139, immunostaining in rosettes of isogenic control and mutant 4-week-old organoids (***P = 0.0008). A dashed line indicates ventricular surface. b = 3 (batches), o = 3 (organoids), v = 6 (ventricles). Images taken at the same magnification. All data expressed as mean ± SEM. ns: nonsignificant differences when P > 0.05; P < 0.05, ∗∗P < 0.01, ∗∗∗P < 0.001, ****P < 0.0001. b, d, e, f, j, k Data analyzed by two-sided unpaired t test.
Fig. 7
Fig. 7. SGS neurons inherit DNA damages and are prone to degenerate.
a Scheme for NPC-derived neuronal differentiation protocol (upper panel) and representative bright-field images (taken at the same magnification) of isogenic control (D868D) and mutant (D868N) neuronal cultures (lower panel). b Representative images (taken at the same magnification) of immunostaining for MAP2 (left) and relative quantification of isogenic control (D868D) and mutant (D868N) NPC-derived neuronal cultures. D868D vs. D868N *P = 0.0370; I871I vs. I871T P = 0.0768; D868N vs. I871T P = 0.5995. One-way ANOVA followed by Tukey post hoc test for multiple comparisons. n = 3. c Immunostaining and quantification for phosphorylated histone H2AX (pH2AX Ser139) in isogenic control (D868D) and mutant (D868N) NPC-derived neuronal cells. *P = 0.0107. Two-sided unpaired t test. n = 4. Images taken at the same magnification. d Representative images (taken at the same magnification) of immunostaining for MAP2 and PI and relative quantification of PI+ over MAP2+ cells in isogenic control and mutant NPC-derived neurons. ****P < 0.0001. Two-sided unpaired t test. n = 8. e Immunostaining and quantification for phosphorylated histone H2AX (pH2AX Ser139) in isogenic control (D868D) and mutant (D868N) iPSC-derived neuronal cells. P = 0.7200. Two-sided unpaired t test. n = 4. Images taken at the same magnification. f Representative images of immunostaining for MAP2 and PI and relative quantification of PI+ over MAP2+ cells in isogenic control and mutant iPSC-derived neurons. P = 0.2337. Two-sided unpaired t test. n = 3. Images taken at the same magnification. All data expressed as mean ± SEM. ns: nonsignificant differences when P > 0.05; *P < 0.05, ∗∗∗∗P < 0.0001. Analysis was performed at 4 weeks of neuronal differentiation.
Fig. 8
Fig. 8. Rescue of PARP-1 activation.
a Olaparib treatment of mutant (D868N) cells. D868D and D868N cells were exposed to vehicle (DMSO) with the same protocol. b PAR polymers immunoblotting and quantification in NPCs (left; D868D + vehicle vs. D868N + vehicle ***P = 0.0004; D868D + vehicle vs. D868N + Olaparib P = 0.3262; D868N + vehicle vs. D868N + Olaparib ****P < 0.0001, n = 6) and NPC-derived neurons (right; D868D + vehicle vs. D868N + vehicle *P = 0.0106; D868D + vehicle vs. D868N + Olaparib P = 0.7230; D868N + vehicle vs. D868N + Olaparib *P = 0.0425, n = 5). c Representative images (taken at the same magnification) of MAP2 and PI immunostaining of mock-treated isogenic control (D868D), mock-treated mutant (D868N), and Olaparib-treated mutant (D868N)-NPC-derived neurons. Quantification of PI+/MAP2+ cells in mock-treated isogenic control (n = 8)-, mock-treated mutant (n = 8)-, Olaparib-treated mutant (n = 8)-, Z-VAD-treated mutant (n = 3)-and NEC-1S-treated mutant (n = 3)-NPC-derived neuronal cultures. See Supplementary Dataset 3 for statistical analysis. n = 3 differentiation experiments. d Quantification of NAD+/NADH content in D868DD868N NPC-derived neurons. *P = 0.0108. Two-sided unpaired t test. n = 9 wells over three differentiation experiments. e Representative images (taken at the same magnification) of MAP2 and PI immunostaining and quantification of PI+/MAP2+ cells in mock-treated isogenic control (D868D)-, mock-treated mutant (D868N)-, and NAD+-supplemented mutant (D868N) NPC-derived neurons. D868D + vehicle vs. D868N + vehicle ****P < 0.0001; D868D + vehicle vs. D868N + NAD+ *P = 0.0277; D868N + vehicle vs. D868N + NAD+ **P = 0.0068. n = 5. f RT-qPCR analysis for FOS and CCND1 mRNA restored expression levels after Olaparib treatment in mutant NPCs. FOS: D868D + vehicle vs. D868N + vehicle ****P < 0.0001; D868D + vehicle vs. D868N + Olaparib P = 0.6371; D868N + vehicle vs. D868N + Olaparib ****P < 0.0001. CCND1: D868D + vehicle vs. D868N + vehicle ****P < 0.0001; D868D + vehicle vs. D868N + Olaparib **P = 0.0034; D868N + vehicle vs. D868N + Olaparib **P = 0.0024. n = 3. g Growth curve analysis of mock-treated isogenic control (D868D)-, mock-treated mutant (D868N)-, and Olaparib-treated mutant (D868N)-NPCs. “*” indicates statistical analysis between “D868N + vehicle” and “D868D + vehicle”, while “#” indicates statistical analysis between “D868N + vehicle” and “D868N + Olaparib”. Two-way ANOVA followed by Tukey post hoc test for multiple comparisons. See Supplementary Dataset 3 for details of statistical analysis. n = 3. h Quantification of pH3 immunostaining in isogenic control (D868D)-mock-treated, mutant (D868N)-mock-treated, and mutant (D868N)-Olaparib-treated NPCs. D868D + vehicle vs. D868N + vehicle ****P < 0.0001; D868D + vehicle vs. D868N + Olaparib P = 0.5530; D868N + vehicle vs. D868N + Olaparib ****P < 0.0001. n = 5. All data expressed as mean ± SEM. ns: nonsignificant differences when P > 0.05; P < 0.05. ∗∗P < 0.01. ***P < 0.001. ****P < 0.0001. b, c, e, f, h One-way ANOVA followed by Tukey post hoc test for multiple comparisons. Analysis was performed at 4 weeks of differentiation for neuronal cultures.

Similar articles

Cited by

References

    1. Katsnelson A, De Strooper B, Zoghbi HY. Neurodegeneration: from cellular concepts to clinical applications. Sci. Transl. Med. 2016;8:364ps18. doi: 10.1126/scitranslmed.aal2074. - DOI - PubMed
    1. GBD Neurological Disorders Collaborator Group 2015. Global, regional, and national burden of neurological disorders during 1990–2015: a systematic analysis for the Global Burden of Disease Study 2015. Lancet Neurol. 2017;16:877–897. doi: 10.1016/S1474-4422(17)30299-5. - DOI - PMC - PubMed
    1. Karimi‐Moghadam A, Charsouei S, Bell B, Jabalemi MR. Parkinson disease from mendelian forms to genetic susceptibility: new molecular insights into the neurodegeneration process. Cell. Mol. Neurobiol. 2018;38:1153–1178. doi: 10.1007/s10571-018-0587-4. - DOI - PMC - PubMed
    1. Johnson BT, et al. Therapeutic landscape for Batten disease: current treatments and future prospects. Nat. Rev. Neurol. 2019;15:161–178. doi: 10.1038/s41582-019-0138-8. - DOI - PMC - PubMed
    1. Schinzel A, Giedion A. A syndrome of severe midface retraction, multiple skull anomalies, clubfeet, and cardiac and renal malformations in sibs. Am. J. Med. Genet. 1978;1:361–375. doi: 10.1002/ajmg.1320010402. - DOI - PubMed

Publication types

MeSH terms

Supplementary concepts