. 2021 Jun 30;12(1):4051.
doi: 10.1038/s41467-021-24340-0.

An epidemic Zika virus isolate suppresses antiviral immunity by disrupting antigen presentation pathways

Affiliations

An epidemic Zika virus isolate suppresses antiviral immunity by disrupting antigen presentation pathways

Ryan D Pardy et al. Nat Commun. .

Abstract

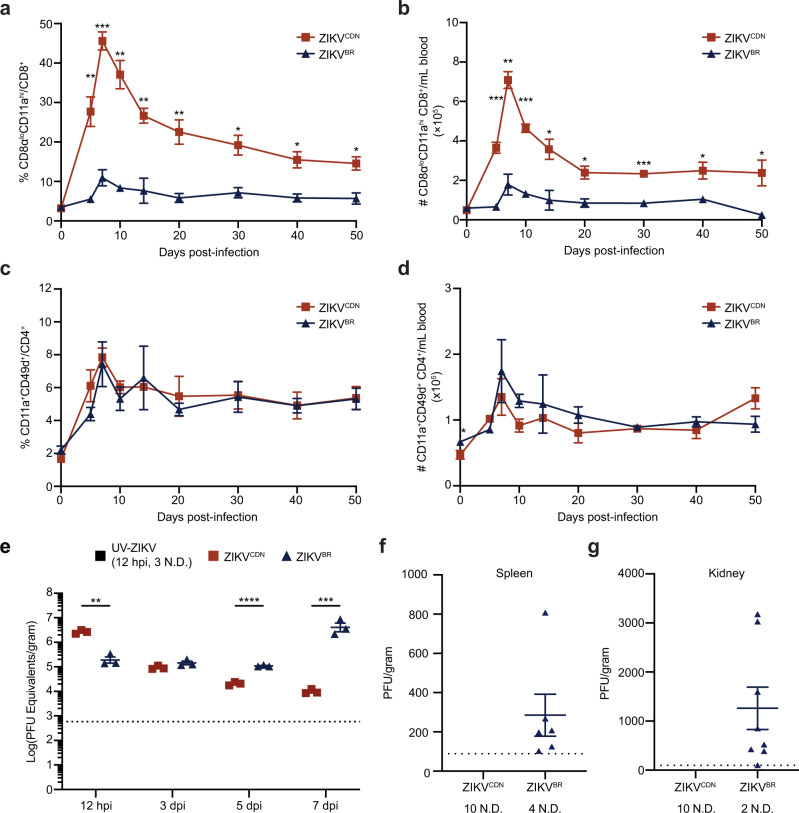
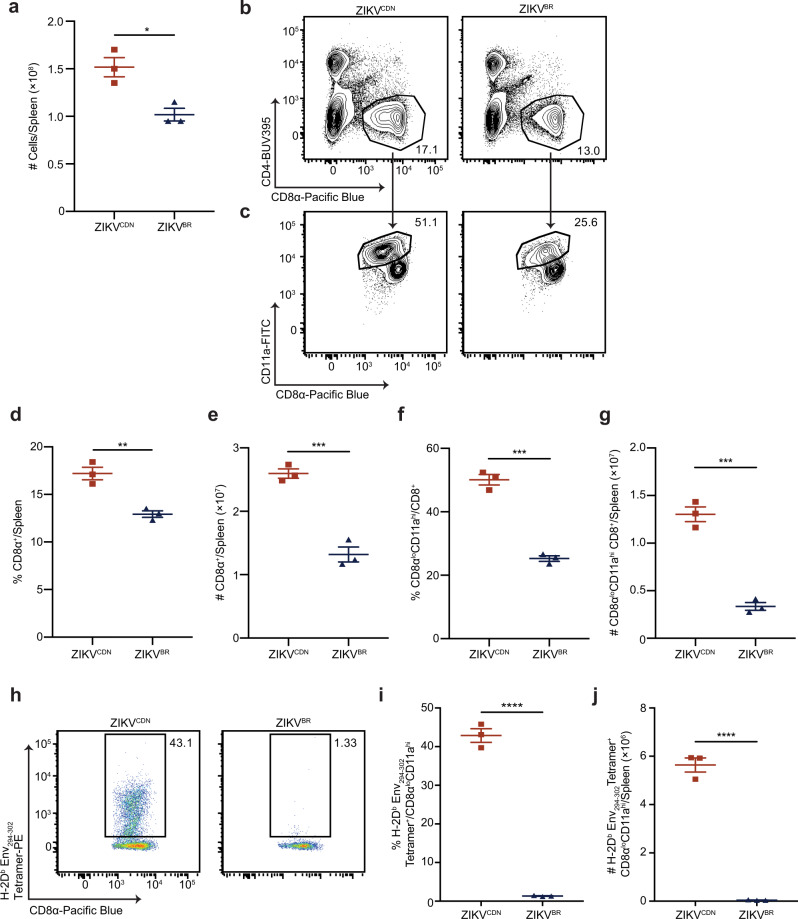
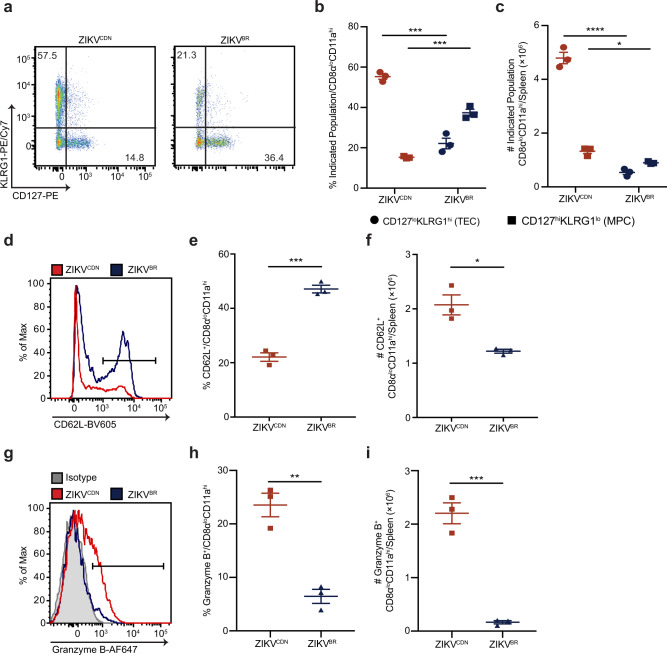
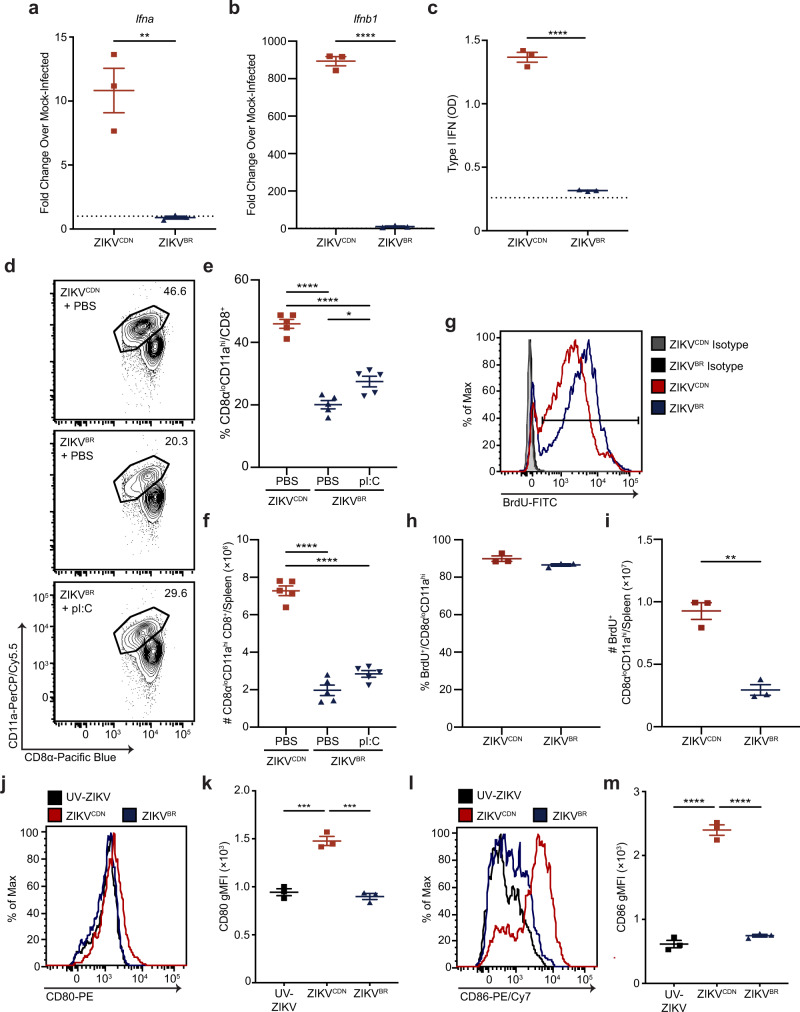
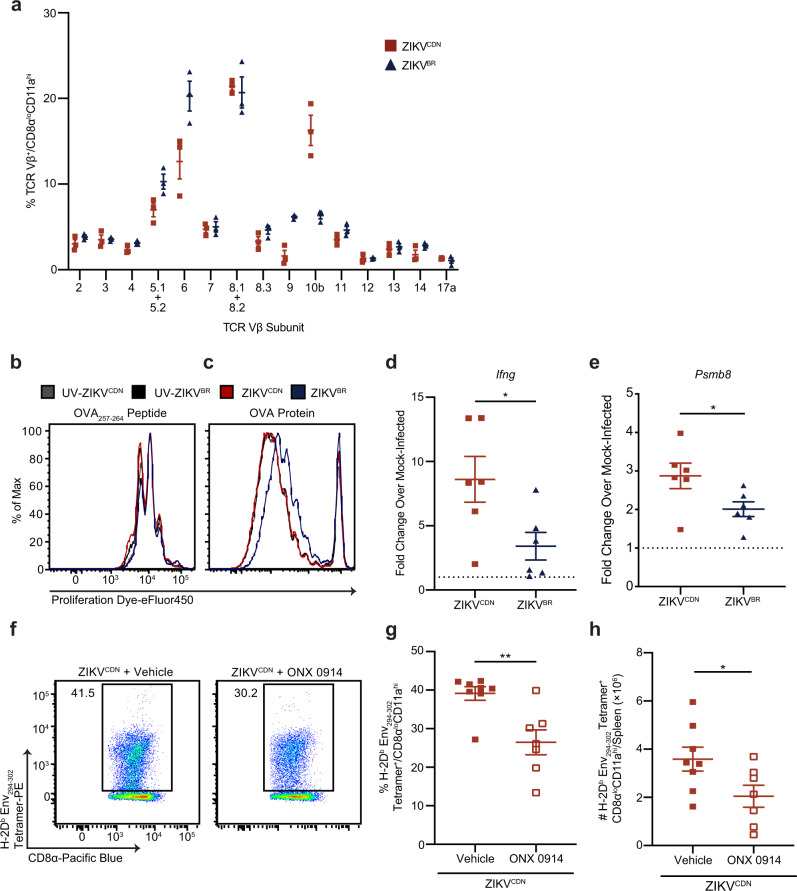
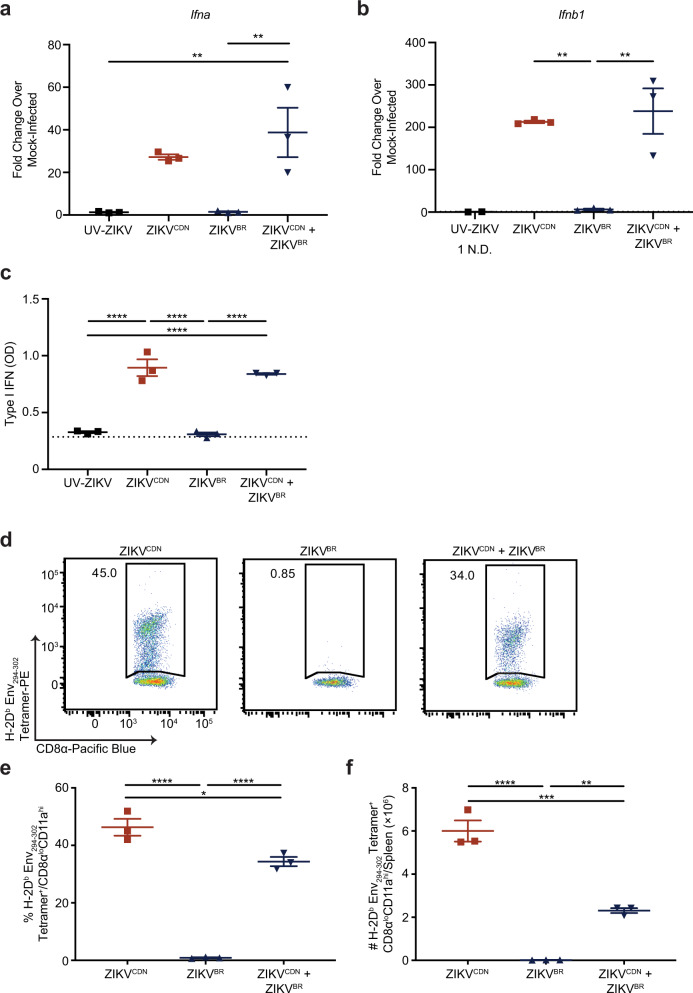
Zika virus (ZIKV) has emerged as an important global health threat, with the recently acquired capacity to cause severe neurological symptoms and to persist within host tissues. We previously demonstrated that an early Asian lineage ZIKV isolate induces a highly activated CD8 T cell response specific for an immunodominant epitope in the ZIKV envelope protein in wild-type mice. Here we show that a contemporary ZIKV isolate from the Brazilian outbreak severely limits CD8 T cell immunity in mice and blocks generation of the immunodominant CD8 T cell response. This is associated with a more sustained infection that is cleared between 7- and 14-days post-infection. Mechanistically, we demonstrate that infection with the Brazilian ZIKV isolate reduces the cross-presentation capacity of dendritic cells and fails to fully activate the immunoproteasome. Thus, our study provides an isolate-specific mechanism of host immune evasion by one Brazilian ZIKV isolate, which differs from the early Asian lineage isolate and provides potential insight into viral persistence associated with recent ZIKV outbreaks.


Conflict of interest statement

The authors declare no competing interests.

Figures

Fig. 1
Fig. 1. Reduced CD8 T cell response to ZIKVBR is associated with virus detection at later time points following infection.
a, b Frequency (a) and number (b) of CD8αloCD11ahi CD8 T cells in the peripheral blood of mice at indicated dpi with ZIKVCDN or ZIKVBR. Data are representative of two independent experiments with n = 3 mice per group, sampled repeatedly at indicated time points. Data were analyzed by two-tailed, unpaired Student’s t-test at each time point. In a day 5 p = 0.0041, day 7 p = 0.0004, day 10 p = 0.0015, day 14 p = 0.0067, day 20 p = 0.0073, day 30 p = 0.0132, day 40 p = 0.0137, day 50 p = 0.0157. In b day 5 p = 0.0004, day 7 p = 0.0014, day 10 p = 0.0003, day 14 p = 0.0218, day 20 p = 0.0169, day 30 p = 0.0002, day 40 p = 0.0371, day 50 p = 0.0327. c, d Frequency (c) and number (d) of CD11a+CD49d+ CD4 T cells in the peripheral blood of mice at indicated dpi with ZIKVCDN or ZIKVBR. Data are representative of two independent experiments with n = 3 mice per group, sampled repeatedly at indicated time points. Data were analyzed by two-tailed, unpaired Student’s t-test at each time point. In d day 0 p = 0.0407. e Viral RNA was quantified in the spleen using RT-qPCR analysis. Data are presented as PFU equivalents per gram of tissue after comparison to a standard curve of Ct value versus log10(PFU) for each isolate. Mice were sacrificed 12 hpi and 3, 5, and 7 dpi with ZIKVCDN or ZIKVBR, or following mock-infection or injection with UV-ZIKV (12 hpi only). Data are representative of three independent experiments, with n = 3 mice per group at each time point. Data were analyzed by two-tailed, unpaired Student’s t-test at each time point, 12 hpi p = 0.001, 5 dpi p = 0.000079, 7 dpi p = 0.00014. f, g Viral burden in the spleen (f) and kidney (g) were quantified via plaque assay 7 dpi with each ZIKV isolate. N.D. indicates no data recorded above the LOD (dotted line). Data are pooled from two experiments with n = 5 mice per group. All data are shown as mean ± SEM and *p < 0.05, **p < 0.01, ***p < 0.001, and ****p < 0.0001. Red squares = ZIKVCDN-infected mice, blue triangles = ZIKVBR-infected mice, black squares UV-ZIKV-injected mice. Source data are provided as a Source Data file.
Fig. 2
Fig. 2. ZIKVBR induces a less robust CD8 T cell response that does not respond to the immunodominant Env294302 epitope.
a Total spleen cellularity 7 dpi with ZIKVCDN or ZIKVBR, p = 0.0146. bg Representative flow cytometry plots (b), frequency (d), and number (e) of CD8α+ T cells 7 dpi with ZIKVCDN or ZIKVBR. In d p = 0.0047 and in e, p = 0.0008. Representative flow cytometry plots (c), frequency (f), and number (g) of CD8αloCD11ahi CD8 T cells in the spleen 7 dpi with ZIKVCDN or ZIKVBR. In f p = 0.0002 and in g, p = 0.0004. hj Representative flow cytometry plots of H-2Db Env294302 tetramer-positive CD8αloCD11ahi CD8 T cells from ZIKVCDN and ZIKVBR-infected mice (h), and frequency (i) and number (j) of H-2Db Env294302 tetramer-positive CD8αloCD11ahi CD8 T cells in the spleen 7 dpi with ZIKVCDN or ZIKVBR. In i p = 0.000019 and in j, p = 0.000045. All data are representative of four independent experiments with n = 3 mice per group and are shown as mean ± SEM. All data were analyzed by a two-tailed, unpaired Student’s t-test. *p < 0.05, **p < 0.01, ***p < 0.001, and ****p < 0.0001. Red squares = ZIKVCDN-infected mice, blue triangles = ZIKVBR-infected mice. Source data are provided as a Source Data file.
Fig. 3
Fig. 3. CD8 T cells present a less activated phenotype following ZIKVBR infection.
ac Representative flow cytometry plots of CD127 and KLRG1 expression by CD8αloCD11ahi CD8 T cells from ZIKVCDN and ZIKVBR-infected mice (a), and frequency (b) and number (c) of CD127loKLRG1hi CD8αloCD11ahi CD8 T cells (circles; TEC) and CD127hiKLRG1lo CD8αloCD11ahi CD8 T cells (squares; MPC) in the spleen 7 dpi with ZIKVCDN or ZIKVBR. In b TEC p = 0.0004 and MPC p = 0.0002. In c TEC p = 0.000049 and MPC p = 0.0103. df Representative histogram (d), frequency (e) and number (f) of CD62L+ CD8αloCD11ahi CD8 T cells in the spleen 7 dpi with ZIKVCDN or ZIKVBR. Line on histogram indicates gating strategy used to identify CD62L+ cells. In e p = 0.0003 and in f p = 0.01. gi Representative histogram (g), frequency (h), and number (i) of granzyme B+ CD8αloCD11ahi CD8 T cells in the spleen 7 dpi with ZIKVCDN or ZIKVBR. Shaded histogram indicates isotype control. Line on histogram indicates gating strategy used to identify granzyme B+ cells. In h p = 0.0026 and in i, p = 0.0005. All data are representative of two independent experiments with n = 3 mice per group and are shown as mean ± SEM. All data were analyzed by a two-tailed, unpaired Student’s t-test. *p < 0.05, **p < 0.01, ***p < 0.001, and ****p < 0.0001. Red symbols = ZIKVCDN-infected mice, blue symbols = ZIKVBR-infected mice. Source data are provided as a Source Data file.
Fig. 4
Fig. 4. Reduced IFN-I production and dendritic cell activation following ZIKVBR infection do not impact antigen-experienced CD8 T cell division.
a, b Ifna (a) and Ifnb1 (b) mRNA expression in the spleen were analyzed by RT-qPCR 12 hpi with ZIKVCDN or ZIKVBR, or mock-infection. Data are expressed as fold change over expression in mock-infected mice 12 hpi. Dotted line indicates a fold change of 1. Data are representative of two independent experiments with n = 3 mice per group, and were analyzed by two-tailed, unpaired Student’s t-test. In a p = 0.0047 and in b p = 0.000004. c Total bioactive IFN-I were analyzed in the serum 12 hpi with ZIKVCDN or ZIKVBR using the B16-blue reporter cell line. Dotted line indicates average OD in the serum of mice 12 h post-mock infection. Data are representative of two independent experiments with n = 3 mice per group, and were analyzed by two-tailed, unpaired Student’s t-test, p = 0.000011. df Representative flow cytometry plots of CD8αloCD11ahi CD8 T cells from ZIKVCDN- or ZIKVBR-infected mice treated with PBS 2 and 3 dpi (d), and from ZIKVBR-infected mice treated with pI:C 2 and 3 dpi. Frequency (e) and number (f) of CD8αloCD11ahi CD8 T cells in the spleen 7 dpi with ZIKVCDN or ZIKVBR, after treatment with either PBS or pI:C 2 and 3 dpi. Data are representative of two independent experiments with n = 5 mice per group and were analyzed by one-way ANOVA with Tukey’s post-test for multiple comparisons. In e ZIKVCDN + PBS versus ZIKVBR + PBS p = 0.0000001, ZIKVCDN + PBS versus ZIKVBR + pI:C p = 0.0000041, ZIKVBR + PBS versus ZIKVBR + pI:C p = 0.0112. In f ZIKVCDN + PBS versus ZIKVBR + PBS p = 0.000000008, ZIKVCDN + PBS versus ZIKVBR + pI:C p = 0.000000059. gi Representative histogram (g), frequency (h), and number (i) of BrdU+ CD8αloCD11ahi CD8 T cells in the spleen 7 dpi with ZIKVCDN or ZIKVBR. Line on histogram indicates gating strategy used to identify BrdU+ cells. Data are representative of two independent experiments with n = 3 mice per group, and were analyzed by two-tailed, unpaired Student’s t-test. In i p = 0.0013. jm Representative histograms and geometric mean fluorescence intensity (gMFI) of CD80 (j, k) and CD86 (l, m) expression on CD3CD19NK1.1 CD11c+MHC-II+ splenic DCs 2 dpi with ZIKVCDN or ZIKVBR, or injection with an equivalent dose of UV-ZIKV. Data are representative of two independent experiments with n = 3 mice per group, and were analyzed by one-way ANOVA with Tukey’s post-test of multiple comparisons. In k ZIKVCDN versus UV-ZIKV p = 0.0002 and ZIKVCDN versus ZIKVBR p = 0.0001. In m ZIKVCDN versus UV-ZIKV p = 0.000002 and ZIKVCDN versus ZIKVBR p = 0.000002. All data are shown as mean ± SEM. *p < 0.05, **p < 0.01, ***p < 0.001, and ****p < 0.0001. Red squares and red lines = ZIKVCDN-infected mice, blue triangles and blue lines = ZIKVBR-infected mice, black squares and black lines = UV-ZIKV-injected mice, gray lines = isotype controls. Source data are provided as a Source Data file.
Fig. 5
Fig. 5. ZIKVBR infection suppresses antigen cross-presentation and immunoproteasome induction.
a TCR Vβ subunit usage among CD8αloCD11ahi CD8 T cells 7 dpi with ZIKVCDN or ZIKVBR. Data are representative of two independent experiments with n = 3 mice per group. b, c Proliferation dye dilution in OT-I CD8 T cells 3 days following co-culture with BMDCs. Prior to co-culture with labeled OT-I CD8 T cells, DCs were infected with ZIKVCDN or ZIKVBR, or UV-inactivated ZIKVCDN or ZIKVBR, at a MOI of 5 for 6 h, followed by a 4-h incubation with LPS and either OVA257264 peptide (b) or OVA protein (c). Data are representative of three independent experiments. d mRNA expression of Ifng in the spleen was analyzed by RT-qPCR 12 hpi with ZIKVCDN or ZIKVBR, or mock-infection. Data are expressed as fold change over expression in mock-infected mice 12 hpi. Dotted line indicates a fold change of 1. Data are pooled from two independent experiments with n = 3 mice per group and were analyzed by two-tailed, unpaired Student’s t-test, p = 0.0313. e mRNA expression of Psmb8 in the spleen was analyzed by RT-qPCR 12 hpi with ZIKVCDN or ZIKVBR, or mock-infection. Data are expressed as fold change over expression in mock-infected mice 12 hpi. Dotted line indicates a fold change of 1. Data are pooled from two independent experiments with n = 3 mice per group and were analyzed by two-tailed, unpaired Student’s t-test, p = 0.0466. fh Representative flow cytometry plots of H-2Db Env294302 tetramer-positive CD8αloCD11ahi CD8 T cells from ZIKVCDN-infected mice following treatment with vehicle control or ONX 0914 (f). Frequency (g) and number (h) of H-2Db Env294302 tetramer-positive CD8αloCD11ahi CD8 T cells in the spleen 7 dpi with ZIKVCDN. Mice were treated s.c. with vehicle control or ONX 0914 prior to infection. Data are pooled from two independent experiments with n = 3 (first experiment), n = 4 (ONX 0914 treated, second experiment), or n = 5 mice per group (vehicle-treated, second experiment), and were analyzed by two-tailed, unpaired Student’s t-test. In g p = 0.0034 and in h p = 0.0414. All data are shown as mean ± SEM. *p < 0.05, and **p < 0.01. Red squares and red lines = ZIKVCDN-infected mice or BMDC, blue triangles and blue lines = ZIKVBR-infected mice or BMDC, black lines = UV- ZIKVBR inoculated BMDCs, gray lines = UV-ZIKVCDN inoculated BMDCs. Source data are provided as a Source Data file.
Fig. 6
Fig. 6. ZIKVBR infection actively suppresses the Env294302-specific CD8 T cell response during co-infection.
a, b Ifna (a) and Ifnb1 (b) mRNA expression in the spleen were analyzed by RT-qPCR 12 hpi with ZIKVCDN or ZIKVBR, co-infection, injection with UV-ZIKV, or mock-infection. Data are expressed as fold change over expression in mock-infected mice 12 hpi. N.D. indicates no expression was detected by RT-qPCR. In a UV-ZIKV versus ZIKVCDN + ZIKVBR p = 0.0082 and ZIKVBR versus ZIKVCDN + ZIKVBR p = 0.0085. In b ZIKVCDN versus ZIKVBR p = 0.008 and ZIKVBR versus ZIKVCDN + ZIKVBR p = 0.0045. c Total bioactive IFN-I were analyzed in the serum 12 hpi with ZIKVCDN or ZIKVBR, co-infection, injection with UV-ZIKV, or mock-infection using the B16-blue reporter cell line. Dotted line indicates average OD in the serum of mice 12 h post-mock infection. UV-ZIKV versus ZIKVCDN p = 0.000029, UV-ZIKV versus ZIKVCDN + ZIKVBR p = 0.00006, ZIKVBR versus ZIKVCDN p = 0.000022, ZIKVBR versus ZIKVCDN + ZIKVBR p = 0.000046. df Representative flow cytometry plots of H-2Db Env294302 tetramer-positive CD8αloCD11ahi CD8 T cells from ZIKVCDN-, ZIKVBR- or co-infected mice (d). Frequency (e) and number (f) of H-2Db Env294302 tetramer-positive CD8αloCD11ahi CD8 T cells in the spleen 7 dpi with ZIKVCDN or ZIKVBR, or co-infection. In e ZIKVCDN versus ZIKVBR p = 0.000007, ZIKVCDN versus ZIKVCDN + ZIKVBR p = 0.0112, ZIKVBR versus ZIKVCDN + ZIKVBR p = 0.000044. In f ZIKVCDN versus ZIKVBR p = 0.000016, ZIKVCDN versus ZIKVCDN + ZIKVBR p = 0.0003, ZIKVBR versus ZIKVCDN + ZIKVBR p = 0.0034. All data are representative of two independent experiments with n = 3 mice per group and are shown as mean ± SEM. All data were analyzed by one-way ANOVA with Tukey’s post-test of multiple comparisons. UV-ZIKV group in b was excluded from statistical analysis. *p < 0.05, **p < 0.01, ***p < 0.001, and ****p < 0.0001. Red squares = ZIKVCDN-infected mice, blue triangles = ZIKVBR-infected mice, inverted blue triangles = ZIKVCDN + ZIKVBR co-infected mice, black squares = UV-ZIKV-injected mice. Source data are provided as a Source Data file.

Similar articles

Cited by

References

    1. Dick GW, Kitchen SF, Haddow AJ. Zika virus. I. Isolations and serological specificity. Trans. R. Soc. Trop. Med. Hyg. 1952;46:509–520. doi: 10.1016/0035-9203(52)90042-4. - DOI - PubMed
    1. Kindhauser MK, Allen T, Frank V, Santhana RS, Dye C. Zika: the origin and spread of a mosquito-borne virus. Bull. World Health Organ. 2016;94:675–686C. doi: 10.2471/BLT.16.171082. - DOI - PMC - PubMed
    1. Rajah MM, Pardy RD, Condotta SA, Richer MJ, Sagan SM. Zika virus: emergence, phylogenetics, challenges, and opportunities. ACS Infect. Dis. 2016;2:763–772. doi: 10.1021/acsinfecdis.6b00161. - DOI - PubMed
    1. Duffy MR, et al. Zika virus outbreak on Yap Island, Federated States of Micronesia. N. Engl. J. Med. 2009;360:2536–2543. doi: 10.1056/NEJMoa0805715. - DOI - PubMed
    1. Mallet, H. P., Vial, A. L. & Musso, D. Bilan de l’épidémie à virus Zika survenue en Polynésie française entre octobre 2013 et mars 2014. De la description de l’épidémie aux connaissances acquises après l’évènement. Bulletin épidémiologique hebdomadaire 367–373 (2016).

Publication types

Substances