. 2021 Jun 30;12(1):4045.
doi: 10.1038/s41467-021-24316-0.

RAS-inhibiting biologics identify and probe druggable pockets including an SII-α3 allosteric site

Affiliations

RAS-inhibiting biologics identify and probe druggable pockets including an SII-α3 allosteric site

Katarzyna Z Haza et al. Nat Commun. .

Abstract

RAS mutations are the most common oncogenic drivers across human cancers, but there remains a paucity of clinically-validated pharmacological inhibitors of RAS, as druggable pockets have proven difficult to identify. Here, we identify two RAS-binding Affimer proteins, K3 and K6, that inhibit nucleotide exchange and downstream signaling pathways with distinct isoform and mutant profiles. Affimer K6 binds in the SI/SII pocket, whilst Affimer K3 is a non-covalent inhibitor of the SII region that reveals a conformer of wild-type RAS with a large, druggable SII/α3 pocket. Competitive NanoBRET between the RAS-binding Affimers and known RAS binding small-molecules demonstrates the potential to use Affimers as tools to identify pharmacophores. This work highlights the potential of using biologics with small interface surfaces to select unseen, druggable conformations in conjunction with pharmacophore identification for hard-to-drug proteins.


Conflict of interest statement

M.J. works for Avacta Life Sciences who licensed the Affimers from the University of Leeds. M.J., M.J.M., D.C.T., and A.L.T. all own personal shares in Avacta Life Sciences. The remaining authors declare no competing interests.

Figures

Fig. 1
Fig. 1. Biochemical analysis of RAS-binding Affimers.
a Nucleotide exchange assay shows 3 Affimers, K3 (green triangles), K6 (turquoise triangles), and K37 (yellow triangles), inhibit SOS1-mediated nucleotide exchange, whilst K19 (orange diamonds) and K68 (magenta triangles) show inhibition of intrinsic nucleotide exchange and K69 (purple hexagons) and K91 (navy stars) do not inhibit nucleotide exchange at 10 µM. KRAS alone is shown as black squares and in the presence of SOS1cat as red circles. b Affimers K3, K6, and K37 demonstrate dose-response inhibition of KRASWT nucleotide exchange (Data fitted to the Hill Model ([Affimer] vs. response (three parameters)), n = 3 independent experiments for K3 and K6 and n = 5 for K37). c Immunoprecipitation of KRAS with GST-RAF-RBD is inhibited by the RAS-binding Affimers, K3, K6, and K37 compared to control Affimer (Variable regions of AAAA and AAE) which does not differ from the no Affimer (PBS). GST alone does not pull down RAS (Quantification using ImageQuantTL; n = 3 independent experiments). d A representative Western blot of the pull-down experiment from c. Data are mean ± SEM, One-way ANOVA with Dunnett’s post-hoc test *p = 0.0307 K6, p = 0.0439 K37, ***p = 0.0002 GST, ****p < 0.0001 K3. SOScat catalytic domain of SOS1 (Son of Sevenless). Con. Control Affimer, RBD RAS Binding Domain, IP immunoprecipitation, GST Glutathione-S-Transferase.
Fig. 2
Fig. 2. Affimers bind to intracellular RAS and inhibit downstream signaling.
a Ni-NTA immunoprecipitation of transiently expressed intracellularly His-tagged Affimers with endogenous RAS from HEK293 cells. RAS-binding Affimers, K3, K6, and K37, pulled down endogenously expressed RAS, whilst the control Affimer did not. A representative blot from 3 independent experiments is shown. b, c HEK293 cells were co-transfected with FLAG-ERK1 plasmid and pCMV6 encoding tGFP tagged Affimers. Twenty-four hours post-transfection, cells were serum-starved and treated with EGF for 5 min. FLAG-ERK1 was precipitated from cell lysates and analyzed for phosphorylation. b shows a representative blot from 3 independent experiments quantified in (c) showing that Affimers K6 and K37 significantly reduced ERK phosphorylation by over 60% while Affimer K3 reduced it by 30%. (One-way ANOVA with Dunnett’s post-hoc test **p = 0.0002 K3, ****p < 0.0001 K6, and p < 0.0001 K37). d RAS-binding Affimers reduce EGF-induced phosphorylation and nuclear translocation of endogenous ERK in HEK293 cells as measured by immunofluorescence as a percentage of the control Affimer, with Affimers K6 and K37 showing inhibition of over 80% whilst Affimer K3 inhibit by 50% in GFP-expressing cells over 1500 arbitrary units (One-way ANOVA with Dunnett’s post-hoc test ****p < 0.0001, n = 3 independent experiments). e Representative images of the effects of RAS-binding Affimers, K3, K6, and K37, and the control Affimer on EGF-stimulated upregulation of pERK in HEK293 cells. A selection of GFP-positive cells (green) expressing RAS Affimers (arrowed) show reduced staining for pERK (yellow). Scale bars are 50μm. f Assessment of Affimer expression level on pERK inhibition as determined by immunofluorescence, increased GFP expression, and thus Affimer expression shows a reduction in pERK nuclear translocation (n = 3 independent experiments). g RAS-binding Affimers inhibition of EGF-induced phosphorylation and nuclear translocation of endogenous ERK in mouse embryonic fibroblasts (MEFs) expressing single human RAS isoforms as measured by immunofluorescence as a percentage of the control Affimer. Affimers K6 and K37 shown inhibition in all RAS isoforms, whilst Affimer K3 inhibited KRAS and HRAS to a lesser degree with no inhibition of NRAS (Two-way ANOVA with Tukey’s post-hoc test *p = 0.0237 HRAS vs. NRAS and **p = 0.0096 KRAS vs. NRAS, n = 3 independent experiments). Data are mean ± SEM. Con. Control Affimer (Variable regions of AAAA and AAE), EGF epidermal growth factor, tGFP turbo green fluorescent protein, WCL whole cell lysate, IP immunoprecipitation, Empty transfection reagents only.
Fig. 3
Fig. 3. RAS-binding Affimers show different mutant specificities.
a Panc 10.05 (KRASG12D), (b) SW620 (KRASG12V), and (c) NCI-H460 (KRASQ61H) cells were co-transfected with FLAG-ERK1 plasmid and pCMV6 encoding tGFP tagged Affimers. Twenty-four hours post transfection cells were serum-starved for 1 h. FLAG-ERK1 was precipitated from cell lysates using anti-FLAG beads and analyzed for phosphorylation by immunoblotting with anti-ERK and anti-phospho-ERK antibodies. Representative blots are shown together with quantification graphs. All three RAS-binding Affimers, K3, K6, and K37, inhibit ERK phosphorylation in Panc 10.05 cells (a) One-way ANOVA with Dunnett’s post-hoc test compared to control Affimer, ****p < 0.0001) and SW620 cells (b) One-way ANOVA with Dunnett’s post-hoc test compared to control Affimer **p = 0.0026 K3, p = 0.0054 K6, and p = 0.0088 K37). The magnitude of inhibition by Affimers K3 and K37 is reduced in NCI-H460 cells (c) One-way ANOVA with Dunnett’s post-hoc test compared to control Affimer *p = 0.0269 K3, **p = 0.0062 K6, *p = 0.0210 K37). d RAS-binding Affimers inhibit EGF-induced phosphorylation and nuclear translocation of endogenous ERK in mouse embryonic fibroblasts (MEFs) expressing single human KRAS mutants (G12D, G12V, Q61R) as measured by immunofluorescence as a percentage of the control Affimer. Only Affimer K3 shows weaker inhibition in the Q61R expressing cell line (Two-way ANOVA with Tukey’s post-hoc compared to KRASWT for each Affimer *p = 0.0221. Data are mean ± SEM, n = 3 independent experiments for all cell lines. Con. Control Affimer (Variable regions of AAAA and AAE), EGF epidermal growth factor, tGFP turbo green fluorescent protein, IP immunoprecipitation, Empty transfection reagents only, WT wild type.
Fig. 4
Fig. 4. Variable region 1 of Affimer K6 binds between Switch I and Switch II of KRAS.
a Affimer K6 (green) was co-crystallized with KRASGDP (slate) and solved to a resolution of 1.9 Å. The switch I (magenta), switch II (orange) and α3 helix (black) are depicted, showing their relative positioning around variable region 1 of Affimer K6. b Intramolecular and intermolecular interactions in the KRAS:Affimer K6 co-crystal structure are depicted; black dotted lines represent the hydrogen bonds that stabilize the critical hydrophobic contacts. c Affimer K6 (VR1) and KRAS interactions shown in planar form. Hydrogen bonds are shown as black, dotted lines between the contributing atoms; additional hydrophobic interactions are represented by arcs, their spokes radiating towards the residues they contact. (Data was generated using PDBePISA (CCP4i) and verified in MacPyMOL). d Alanine scanning data of the variable regions of Affimer K6 highlights Affimer residues important for inhibition of nucleotide exchange and the importance of VR2. This highlights the residues that are important for both KRAS:K6 interactions and intra-Affimer interactions that stabilize the conformation of Affimer K6. Unaltered K6 is shown in black, variable region 1 residues are shown in dark gray, variable region 2 residues in light gray, and removal of variable region 2 (ΔVR2) in white. (n = 3 independent experiments). e Comparison of Affimer K6 tripeptide, P42, W43, F44, (green) with the small molecules (yellow) that bind the same SI/SII pocket. Data are mean ± SEM, One-way ANOVA with Dunnett’s post hoc test *p = 0.0224 Q45A **p = 0.0002 F40A ****p < 0.0001 P42A, W43A, F44A, R73A, and ΔVR2. Images were generated in MacPyMOL v1.7.2.3, and ChemDraw Prime 16.0. VR variable region.
Fig. 5
Fig. 5. Affimers K3 and K6 bind KRAS with nanomolar affinity.
SPR measured binding activities for Affimer K6 with GDP bound KRAS (a), GppNHp bound KRAS (b) and Affimer K3 with GDP bound KRAS (c), GppNHp bound KRAS (d). Affimers were immobilized on streptavidin-coated CM5 sensor chips via C-terminal biotin and differing concentrations of GDP or GppNHp bound KRAS flowed over. Representative curves of 3 replicate experiments are shown with experimental data in color and Langmuir 1:1 fitting curves in black.
Fig. 6
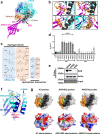
Fig. 6. Variable region 1 of Affimer K3 explores a druggable pocket between the switch II region and α3 helix of KRAS.
a Affimer K3 (magenta) was co-crystallized with KRASGDP (cyan) and solved to a resolution of 2.1 Å. The switch I (deep blue), switch II (orange) and α3 helix (dark gray) are depicted, showing their relative positioning around variable region 1 of Affimer K3. b Intramolecular and intermolecular interactions in the KRAS:Affimer K3 co-crystal structure is depicted; black dotted lines represent hydrogen bonds. c All intermolecular interactions are shown in planar form. Hydrogen bonds are shown as short dotted black lines between the contributing atoms; electrostatic interactions are shown as long dashed black lines additional hydrophobic interactions are represented by arcs, their spokes radiating towards the residues they contact (Data was generated using PDBePISA (CCP4i) and verified in MacPyMOL). d Alanine scanning data of the variable regions of Affimer K3 highlights Affimer residues important for inhibition of nucleotide exchange. Unaltered K3 is shown in black, variable region 1 residue are shown in dark gray, and variable region 2 residues in light gray (One-way ANOVA with Dunnett’s post hoc test ****p < 0.0001, n = 3 independent experiments). e Mutation of KRAS H95 affects the ability of Affimer K3 to bind, H95Q and H95L represent the residues in HRAS and NRAS, respectively, a representative blot is shown (n = 3 independent experiments). f Binding of Affimer K3 causes a conformational shift to Switch II compared to WT-KRASGDP. The KRAS molecule (cyan) from KRAS:Affimer K3 co-crystal structure was overlaid with WT-KRASGDP (deep blue; PDB code: 4OBE). Conformational shifts were observed in the switch II region (red-dotted box). g Alterations in the conformation of the Switch II region (orange and α3 helix (black) (top row) and the corresponding alterations in the electrostatics (bottom row). Residues 41–45 of Affimer K3 (green) shown with KRASGDP (left-hand panels), overlaid with the co-crystallized KRAS:ARS1620 structure (middle panels, PBD: 5V9U) and KRAS:AMG510 structure (right-hand panels, PDB: 6OIM) (ARS1620 is shown in yellow and AMG510 is shown in magenta). Data are mean ± SEM, n = 3 independent experiments. Images were generated in MacPyMOL v1.7.2.3, and ChemDraw Prime 16.0. VR variable region.
Fig. 7
Fig. 7. Affimer:KRAS NanoBRET can be used to identify small molecules which bind in the SI/SII or SII/α3 pocket.
Increased Affimer (acceptor) to KRAS (donor) ratio increases the NanoBRET signal as measured by NanoBRET Ratio for Affimers K3, K6, and K69 with KRASWT(a)) and Affimers K3 and K69 with KRASG12C(b)). Small molecule BI-2852 binds in the SI/SII pocket and increasing concentrations displace Affimer K6 reducing the NanoBRET Ratio with no impact on NanoBRET signal from Affimer K69 that binds between helix 4 and helix 5 (c)). ARS-1620 covalently tethers to C12 in KRASG12C and occupies the SII pocket, and increasing concentrations displace Affimer K3 reducing the NanoBRET Ratio with no impact on NanoBRET signal from Affimer K69 (d)). e Affimer K69 (blue) binds the allosteric lobe between helices 4 and 5 on the opposite side of KRAS (gray) to Affimers K3 (magenta) and K6 (green). Data are mean ± SEM, fitted to 3 parameters [agonist]/[inhibitor] vs. response model in Prism, n = 3 independent experiments for all assays. Images were generated in MacPyMOL v1.7.2.3 from PDB codes 6YXW (K3), 6YR8 (K6), and 7NY8 (K69). Control Affimer (Variable regions of AAAA and AAE).

Similar articles

Cited by

References

    1. Hobbs GA, Der CJ, Rossman KL. RAS isoforms and mutations in cancer at a glance. J. Cell Sci. 2016;129:1287. - PMC - PubMed
    1. O’Bryan JP. Pharmacological targeting of RAS: recent success with direct inhibitors. Pharm. Res. 2019;139:503–511. doi: 10.1016/j.phrs.2018.10.021. - DOI - PMC - PubMed
    1. Buhrman G, et al. Analysis of binding site hot spots on the surface of Ras GTPase. J. Mol. Biol. 2011;413:773–789. doi: 10.1016/j.jmb.2011.09.011. - DOI - PMC - PubMed
    1. Grant BJ, et al. Novel Allosteric Sites on Ras for Lead Generation. PLoS ONE. 2011;6:e25711. doi: 10.1371/journal.pone.0025711. - DOI - PMC - PubMed
    1. Cruz-Migoni A, et al. Structure-based development of new RAS-effector inhibitors from a combination of active and inactive RAS-binding compounds. Proc. Natl Acad. Sci. USA. 2019;116:2545–2550. doi: 10.1073/pnas.1811360116. - DOI - PMC - PubMed

Publication types