

Data-driven time-dependent state estimation for interfacial fluid mechanics in evaporating droplets
- PMID: 34193897
- PMCID: PMC8245485
- DOI: 10.1038/s41598-021-92965-8
Data-driven time-dependent state estimation for interfacial fluid mechanics in evaporating droplets
Abstract
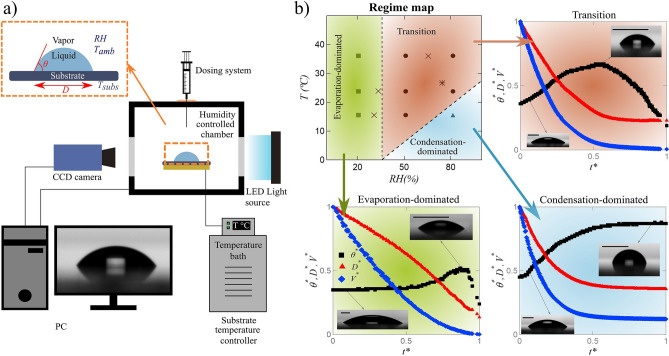
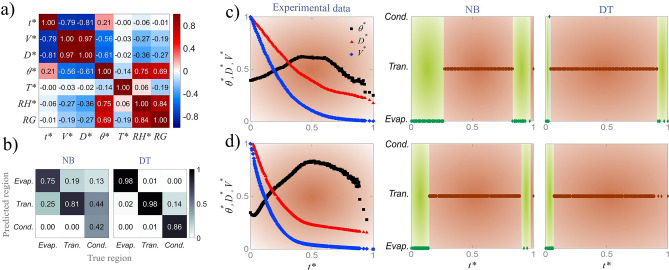
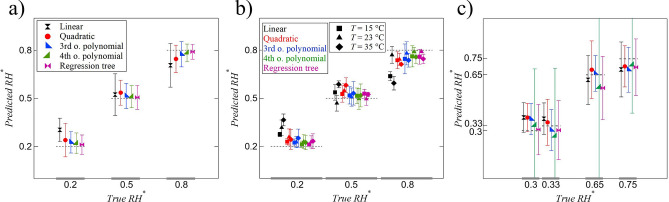
Droplet evaporation plays crucial roles in biodiagnostics, microfabrication, and inkjet printing. Experimentally studying the evolution of a sessile droplet consisting of two or more components needs sophisticated equipment to control the vast parameter space affecting the physical process. On the other hand, the non-axisymmetric nature of the problem, attributed to compositional perturbations, introduces challenges to numerical methods. In this work, droplet evaporation problem is studied from a new perspective. We analyze a sessile methanol droplet evolution through data-driven classification and regression techniques. The models are trained using experimental data of methanol droplet evolution under various environmental humidity levels and substrate temperatures. At higher humidity levels, the interfacial tension and subsequently contact angle increase due to higher water uptake into droplet. Therefore, different regimes of evolution are observed due to adsorption-absorption and possible condensation of water which turns the droplet from a single component into a binary system. In this work, machine learning and data-driven techniques are utilized to estimate the regime of droplet evaporation, the time evolution of droplet base diameter and contact angle, and level of surrounding humidity. Droplet regime is estimated by classification algorithms through point-by-point analysis of droplet profile. Decision tree demonstrates a better performance compared to Naïve Bayes (NB) classifier. Additionally, the level of surrounding humidity, as well as the time evolution of droplet base diameter and contact angle, are estimated by regression algorithms. The estimation results show promising performance for four cases of methanol droplet evolution under conditions unseen by the model, demonstrating the model's capability to capture the complex physics underlying binary droplet evolution.
Conflict of interest statement
The authors declare no competing interests.
Figures
Similar articles
-
Construction of an active humidity regulation setup for NMR/MRI-Observation and simulation of the controlled evaporation of sessile water droplets.J Magn Reson. 2023 Mar;348:107389. doi: 10.1016/j.jmr.2023.107389. Epub 2023 Jan 31. J Magn Reson. 2023. PMID: 36731352
-
Effect of gravity-induced shape change on the diffusion-limited evaporation of thin sessile and pendant droplets.Phys Rev E. 2025 Apr;111(4-2):045107. doi: 10.1103/PhysRevE.111.045107. Phys Rev E. 2025. PMID: 40410957
-
Evaporation of Dilute Sodium Dodecyl Sulfate Droplets on a Hydrophobic Substrate.Langmuir. 2019 Aug 13;35(32):10453-10460. doi: 10.1021/acs.langmuir.9b00824. Epub 2019 Jul 24. Langmuir. 2019. PMID: 31291117 Free PMC article.
-
Recent advances in droplet wetting and evaporation.Chem Soc Rev. 2018 Jan 22;47(2):558-585. doi: 10.1039/c6cs00902f. Chem Soc Rev. 2018. PMID: 29090296 Review.
-
Simultaneous spreading and evaporation: recent developments.Adv Colloid Interface Sci. 2014 Apr;206:382-98. doi: 10.1016/j.cis.2013.08.006. Epub 2013 Sep 4. Adv Colloid Interface Sci. 2014. PMID: 24075076 Review.
Cited by
-
Predicting the effects of environmental parameters on the spatio-temporal distribution of the droplets carrying coronavirus in public transport - A machine learning approach.Chem Eng J. 2022 Feb 15;430:132761. doi: 10.1016/j.cej.2021.132761. Epub 2021 Oct 7. Chem Eng J. 2022. PMID: 34642569 Free PMC article.
-
Fundamentals of Monitoring Condensation and Frost/Ice Formation in Cold Environments Using Thin-Film Surface-Acoustic-Wave Technology.ACS Appl Mater Interfaces. 2023 Jul 26;15(29):35648-35663. doi: 10.1021/acsami.3c04854. Epub 2023 Jul 11. ACS Appl Mater Interfaces. 2023. PMID: 37432769 Free PMC article.
References
-
- Bonn D, Eggers J, Indekeu J, Meunier J, Rolley E. Wetting and spreading. Rev. Mod. Phys. 2009;81:739. doi: 10.1103/RevModPhys.81.739. - DOI
-
- Plawsky J, et al. Nano-and microstructures for thin-film evaporation—a review. Nanosc. Microsc. Thermophys. Eng. 2014;18:251–269. doi: 10.1080/15567265.2013.878419. - DOI
-
- Andalib S, Kavehpour P. Fluorescence microscopy of precursor films in evaporating droplets. APS Div. Fluid Dyn. Meet. Abstr. 2017;20:Q11–003.
-
- De Gans B-J, Duineveld PC, Schubert US. Inkjet printing of polymers: State of the art and future developments. Adv. Mater. 2004;16:203–213. doi: 10.1002/adma.200300385. - DOI
Grants and funding
LinkOut - more resources
Full Text Sources
