

Trait variations and expression profiling of OsPHT1 gene family at the early growth-stages under phosphorus-limited conditions
- PMID: 34193908
- PMCID: PMC8245478
- DOI: 10.1038/s41598-021-92580-7
Trait variations and expression profiling of OsPHT1 gene family at the early growth-stages under phosphorus-limited conditions
Abstract
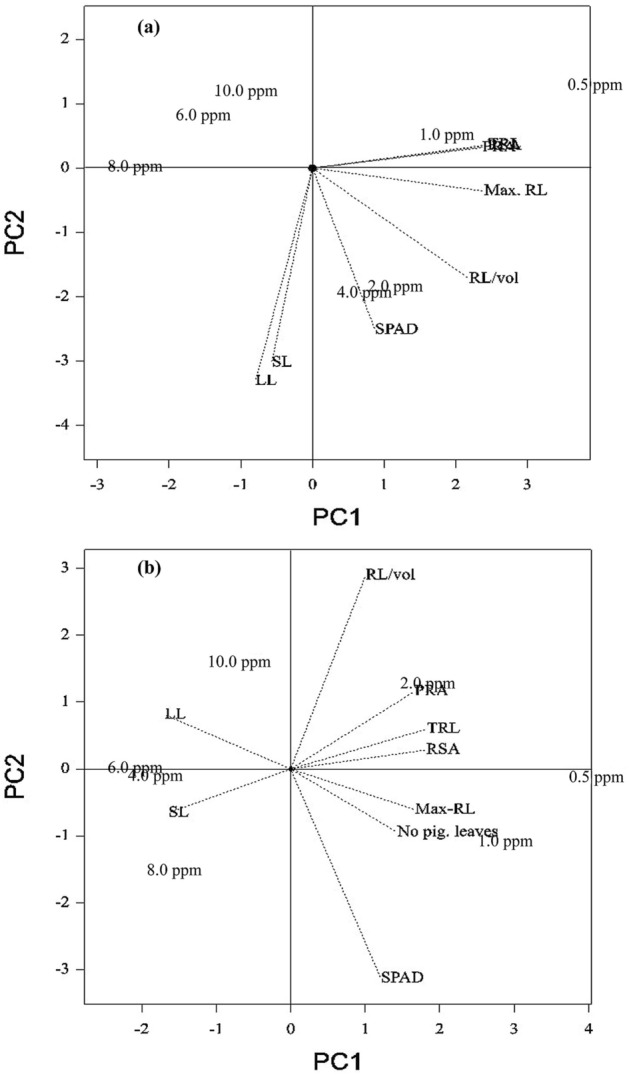
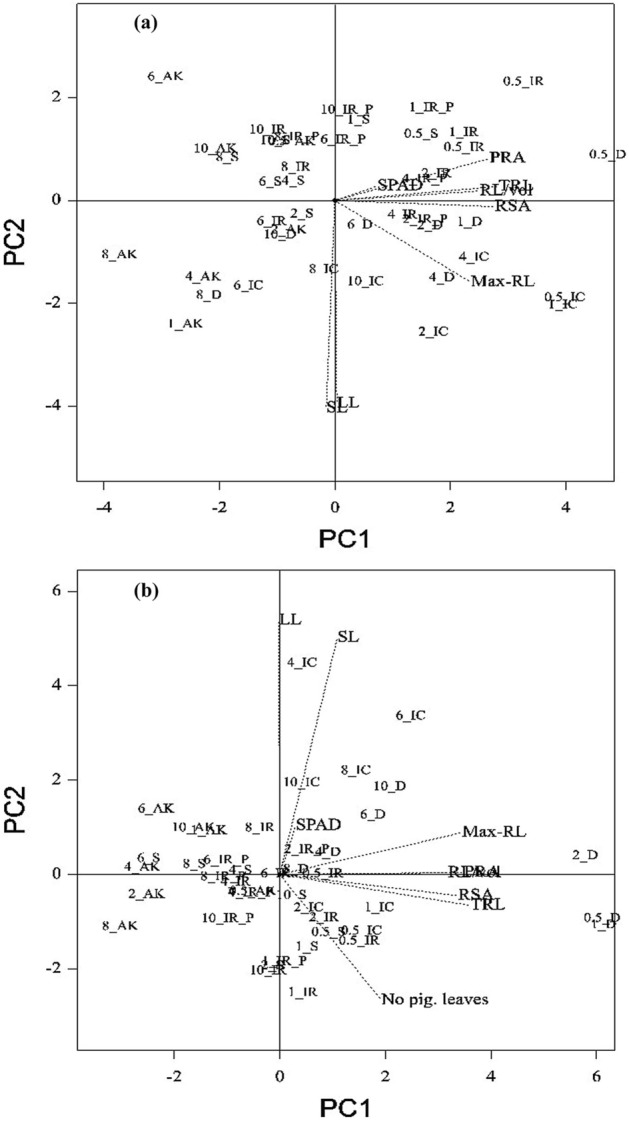
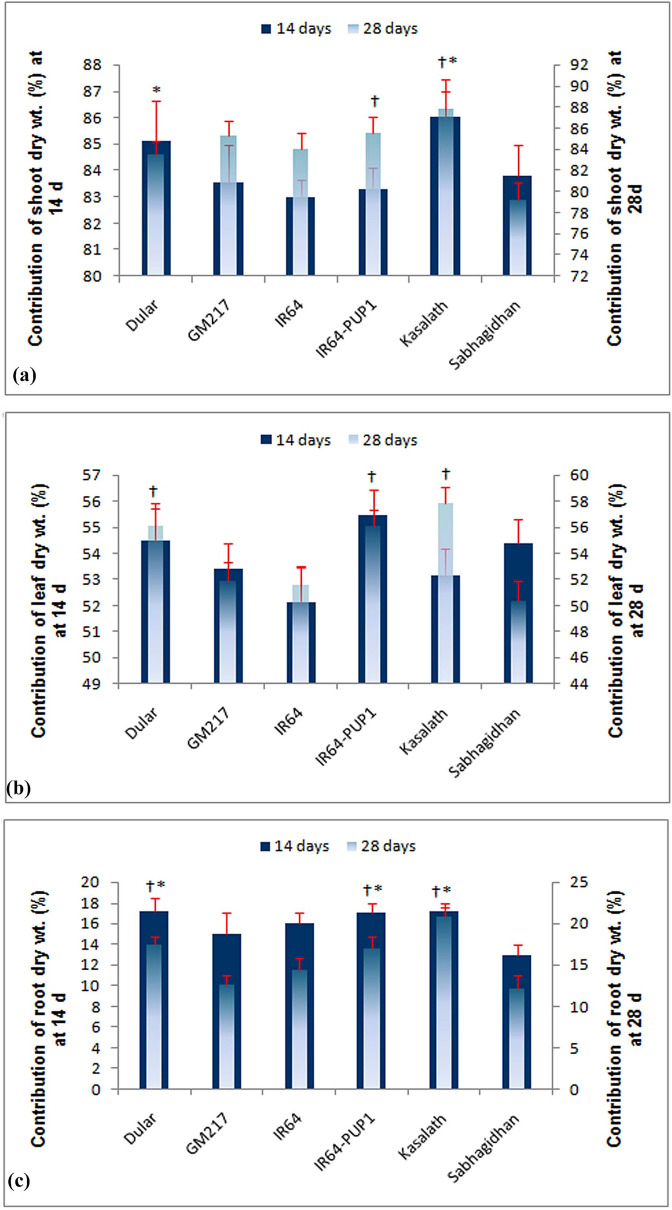
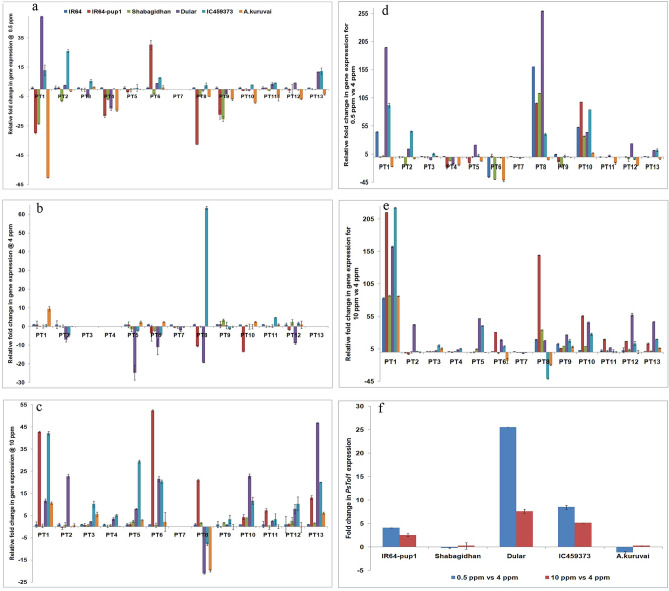
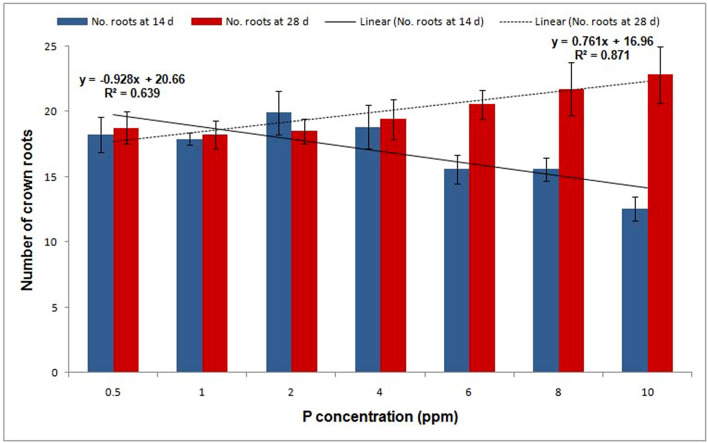
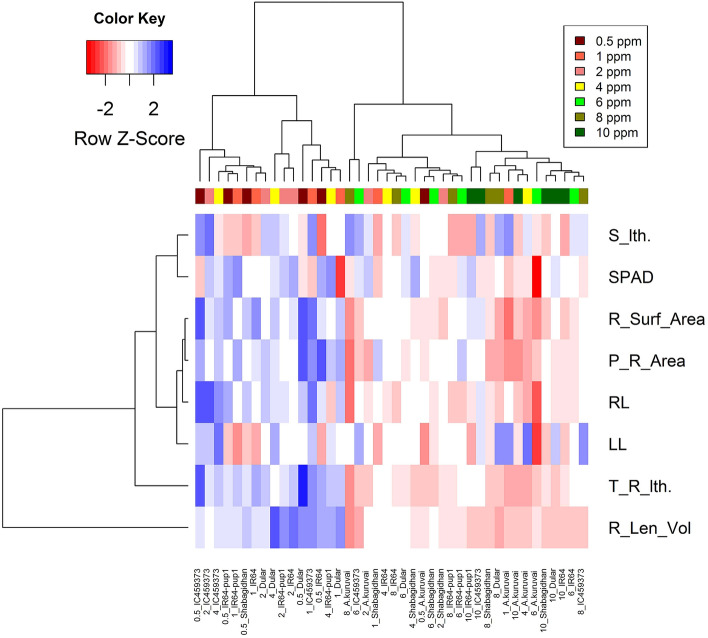
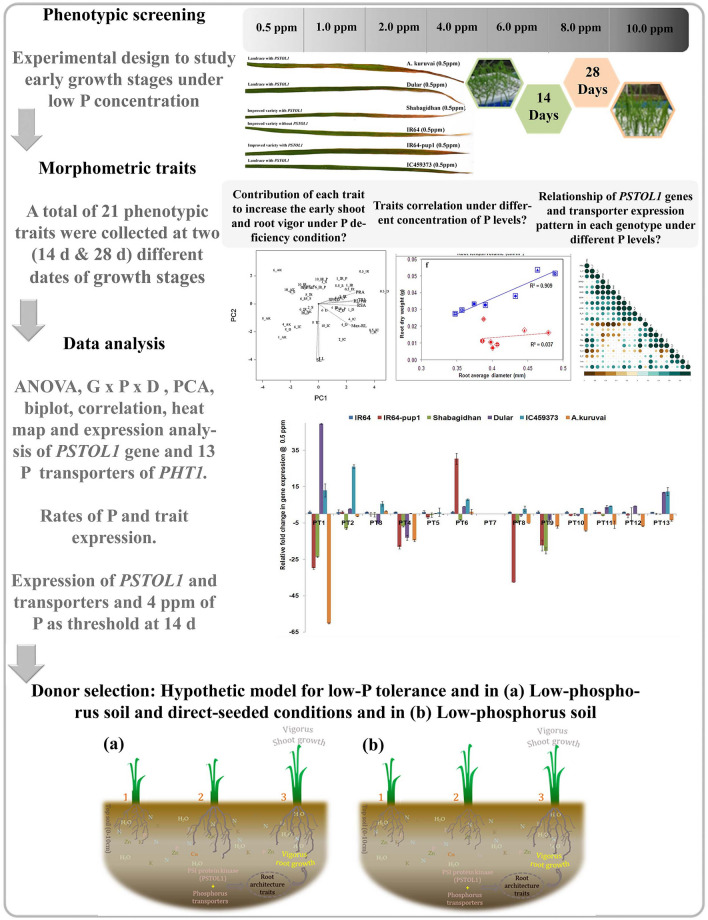
To better understand the early response of genotypes to limited-phosphorus (P) conditions and the role of the phosphate transporter OsPHT1 gene family in the presence of PSTOL1, it is essential to characterize the level of tolerance in rice under limited-P conditions. In the present experiment, six rice genotypes were studied in three-way interactions [genotype (G) × phosphorus (P) × duration (D)] by comparing them at two instances (14 d and 28 d) under seven different concentrations of P (0.5‒10.0 ppm) in a hydroponic system. Trait differences and interactions of these traits were clearly distinguished among the various P rates. However, aboveground trait expression registered increased growth from 6.0 to 10.0 ppm of P. The major root-attributed traits in 0.5 ppm of P are significantly increased vis-à-vis 10 ppm of P. Analysis of variance displayed a significant difference between the genotypes for PSTOL1 and PHT1 expression. In low P, maximum root length with a shoot and root dry weight was observed in a new indigenous accession, IC459373, with higher expression of PSTOL1 than in Dular and IR64-Pup1 in 0.5 ppm of P at 14 d. Among the 13 PHT1 genes, OsPT1, OsPT2, OsPT6, and OsPT13 showed significant upregulation in IC459373, Dular, and IR64-Pup1. These results indicated that studying the expression levels of the PSTOL1 and PHT1 gene family at the early growth stages would be helpful in identifying superior donors to improve low-P tolerance and P-use efficiency in rice breeding programs.
Conflict of interest statement
The authors declare no competing interests.
Figures
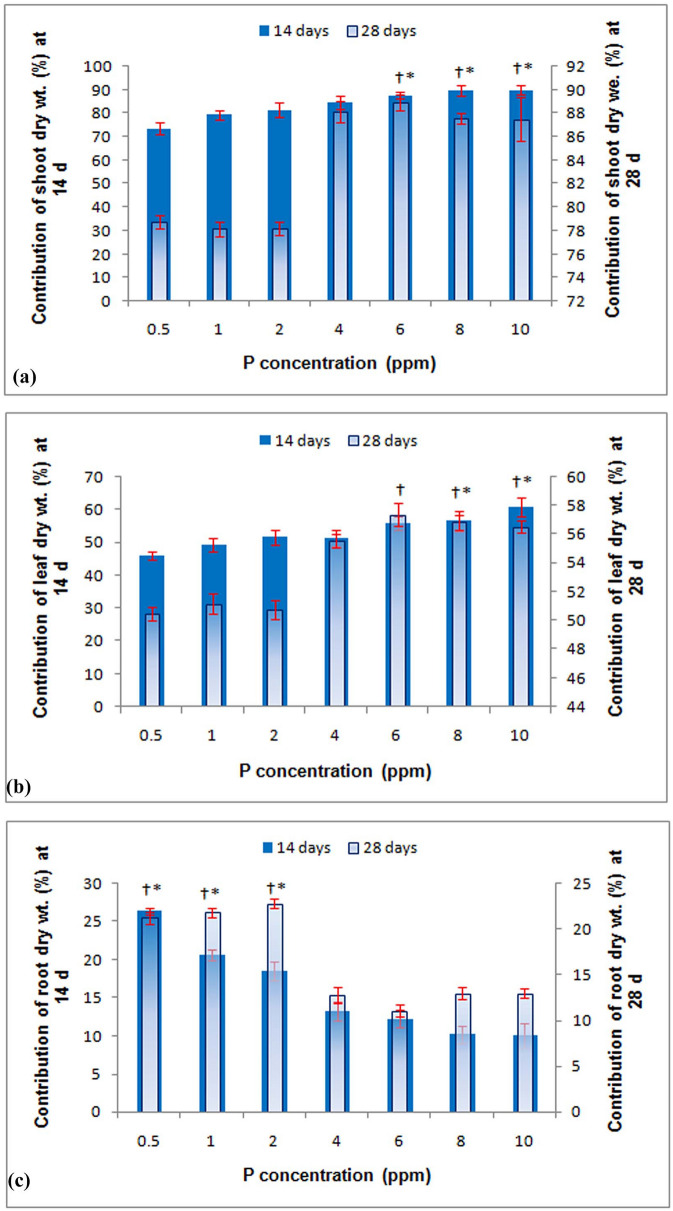
 − 6 ppm, ■ − 8 ppm, and
  − 10 ppm.
Similar articles
-
The protein kinase Pstol1 from traditional rice confers tolerance of phosphorus deficiency.Nature. 2012 Aug 23;488(7412):535-9. doi: 10.1038/nature11346. Nature. 2012. PMID: 22914168
-
Two rice phosphate transporters, OsPht1;2 and OsPht1;6, have different functions and kinetic properties in uptake and translocation.Plant J. 2009 Mar;57(5):798-809. doi: 10.1111/j.1365-313X.2008.03726.x. Epub 2008 Nov 22. Plant J. 2009. PMID: 18980647
-
Phosphate acquisition efficiency and phosphate starvation tolerance locus (PSTOL1) in rice.J Genet. 2014 Dec;93(3):683-8. doi: 10.1007/s12041-014-0424-6. J Genet. 2014. PMID: 25572226
-
Environmental Control of Phosphorus Acquisition: A Piece of the Molecular Framework Underlying Nutritional Homeostasis.Plant Cell Physiol. 2021 Sep 24;62(4):573-581. doi: 10.1093/pcp/pcab010. Plant Cell Physiol. 2021. PMID: 33508134 Review.
-
Are we ready to improve phosphorus homeostasis in rice?J Exp Bot. 2018 Jun 27;69(15):3515-3522. doi: 10.1093/jxb/ery163. J Exp Bot. 2018. PMID: 29788117 Review.
Cited by
-
Superior Haplotypes for Early Root Vigor Traits in Rice Under Dry Direct Seeded Low Nitrogen Condition Through Genome Wide Association Mapping.Front Plant Sci. 2022 Jul 8;13:911775. doi: 10.3389/fpls.2022.911775. eCollection 2022. Front Plant Sci. 2022. PMID: 35874029 Free PMC article.
-
The Landscape of Presence/Absence Variations during the Improvement of Rice.Genes (Basel). 2024 May 19;15(5):645. doi: 10.3390/genes15050645. Genes (Basel). 2024. PMID: 38790274 Free PMC article.
-
Cross-Talk between Transcriptome Analysis and Physiological Characterization Identifies the Genes in Response to the Low Phosphorus Stress in Malus mandshurica.Int J Mol Sci. 2022 Apr 28;23(9):4896. doi: 10.3390/ijms23094896. Int J Mol Sci. 2022. PMID: 35563283 Free PMC article.
-
Overexpression of a Plasma Membrane H+-ATPase Gene OSA1 Stimulates the Uptake of Primary Macronutrients in Rice Roots.Int J Mol Sci. 2022 Nov 11;23(22):13904. doi: 10.3390/ijms232213904. Int J Mol Sci. 2022. PMID: 36430382 Free PMC article.
-
Phosphate transporter gene families in rye (Secale cereale L.) - genome-wide identification, characterization and sequence diversity assessment via DArTreseq.Front Plant Sci. 2025 Jun 16;16:1529358. doi: 10.3389/fpls.2025.1529358. eCollection 2025. Front Plant Sci. 2025. PMID: 40589952 Free PMC article.
References
-
- Dobermann, A. & Fairhurst, T. Rice: nutrient disorders and nutrient management. Potash and Phosphate Institute (PPI), Potash and Phosphate Institute of Canada (PPIC) and International Rice Research Institute (IRRI), Philippines, pp. 135–138 (2000)
-
- Wissuwa M, Ae N. Further characterization of two QTLs that increase phosphorus uptake of rice (Oryza sativa L.) under phosphorus deficiency. Plant Soil. 2001;237:275–286. doi: 10.1023/A:1013385620875. - DOI
-
- Malhotra, H., Sharma, S. & Pandey, R. Phosphorus nutrition: plant growth in response to deficiency and excess. In Plant Nutrients and Abiotic Stress Tolerance (pp. 171–190). Singapore: Springer (2018).
Publication types
MeSH terms
Substances
LinkOut - more resources
Full Text Sources
