

Published Erratum
doi: 10.1038/s41598-021-93282-w.
Author Correction: Atmospheric CO2 during the Mid-Piacenzian Warm Period and the M2 glaciation
Affiliations
- PMID: 34193956
- PMCID: PMC8245415
- DOI: 10.1038/s41598-021-93282-w
Item in Clipboard
Published Erratum
Author Correction: Atmospheric CO2 during the Mid-Piacenzian Warm Period and the M2 glaciation
Sci Rep.
.
No abstract available
Figures
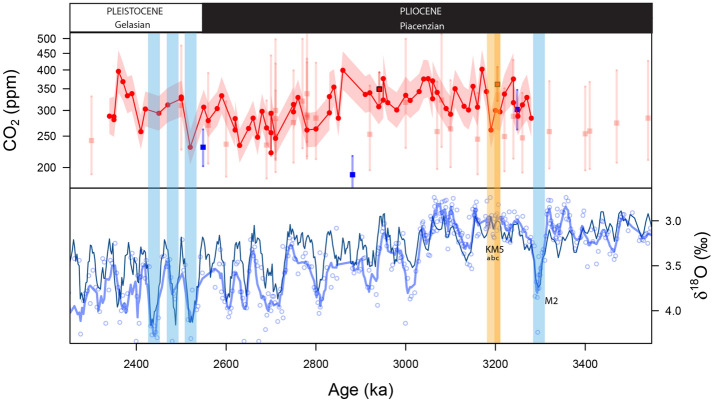
Top panel: Current CO2 estimates from boron isotopes across the Plio-Pleistocene boundary. G. ruber data in red circles from site 999 (Martinez-Boti et al.13), T. sacculifer in red squares from site 999 (Seki et al.14), blue squares from site 926 (Sosdian et al.20) and pale red squares from site 999 (Bartoli et al.12). Bottom Panel: δ18O from benthic foraminifer Cibicidoides wuellerstorfi at ODP Site 999 (blue circles) with a 5 point running mean (this study and ref.53) compared to the benthic isotope stack of ref.19. M2 glacial and early Pleistocene strong glacials are highlighted in blue for context. Interglacial KM5 and KM5c are highlighted in yellow and orange, respectively. Note that there are no estimates for the M2 glacial and very few across the mid-Piacenzian warm period (mPWP), the low resolution of previous studies makes pin-pointing individual interglacials such as the KM5c future analogue difficult. These studies also differ in their estimates of Mid-Piacenzian CO212,13,14,20.

Top panel: Red circles and lines show δ11B-derived CO2 data from Globigerinoides ruber at ODP Site 999 (this study and Martinez-Boti et al.13, Chalk et al.18), red squares are Trilobatus sacculifer at ODP 999 (this study and Seki et al.14), purple squares are T. sacculifer from ODP 668 (Honisch et al.23) and blue squares are T. sacculifer from ODP 926 (Sosdian et al.20). Black solid line shows ice core-derived CO2 from ref.58. Left; Late Pleistocene CO2 from boron isotopes14,18,23,52 and ice core data. Also shown are CO2 projections in line with RCP8.5 at current emission rates to the year 2040 (black broken line). Middle column; MPT CO2 estimates18,23 including disturbed ice estimates24,25 (Note: age adjusted for scale). Right; mPWP estimates of CO2 (this study combined with Martinez-Boti et al.13), new data from T. sacculifer is shown in red squares and shows no offset from G. ruber estimates. Second panel: Time periods as above, LR04 and ODP 999 δ18O from C. wuellerstorfi18,19,53. Third panel: Iron mass accumulation rate from the Southern Atlantic ODP Site 109028. Fourth panel: % Northern Component Water (NCW) estimated from δ13C in benthic foraminifera (grey) and ɛNd from fish debris (dark green) in the deep North Atlantic (core U131331). Note the lag of ocean circulation and CO2 relative to the M2 glaciation31.
Erratum for
-
Atmospheric CO2 during the Mid-Piacenzian Warm Period and the M2 glaciation.Sci Rep. 2020 Jul 9;10(1):11002. doi: 10.1038/s41598-020-67154-8. Sci Rep. 2020. PMID: 32647351 Free PMC article.
References
Publication types
LinkOut - more resources
Full Text Sources
