. 2021 Jul;6(7):852-864.
doi: 10.1038/s41564-021-00929-5. Epub 2021 Jun 30.

The plant NADPH oxidase RBOHD is required for microbiota homeostasis in leaves

Affiliations

The plant NADPH oxidase RBOHD is required for microbiota homeostasis in leaves

Sebastian Pfeilmeier et al. Nat Microbiol. 2021 Jul.

Abstract

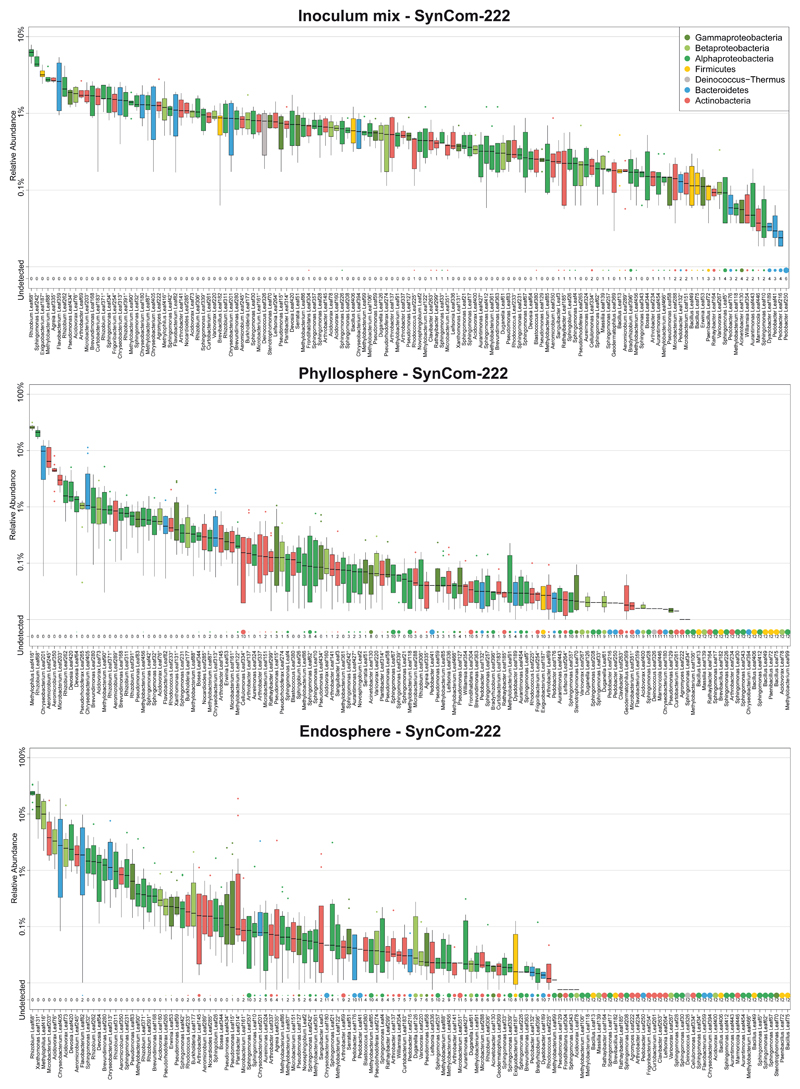
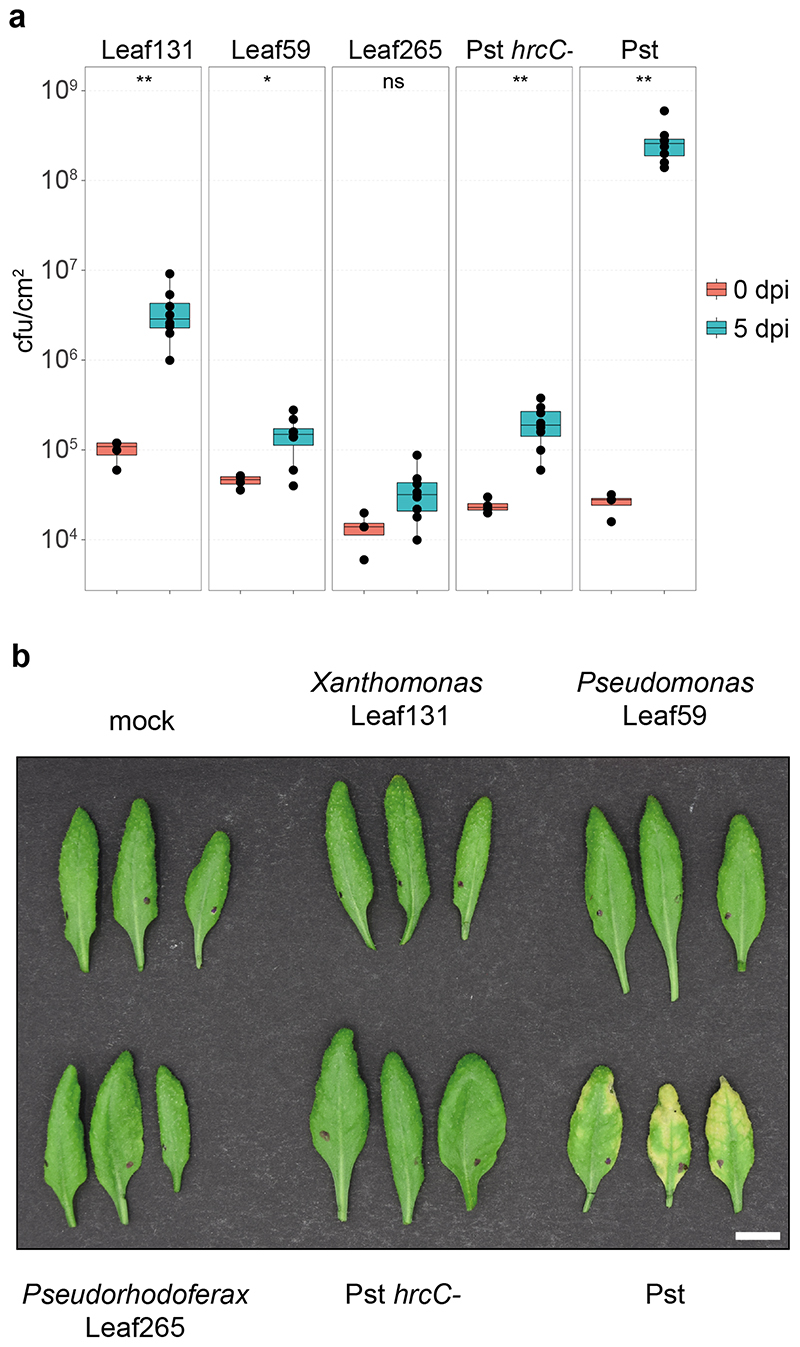
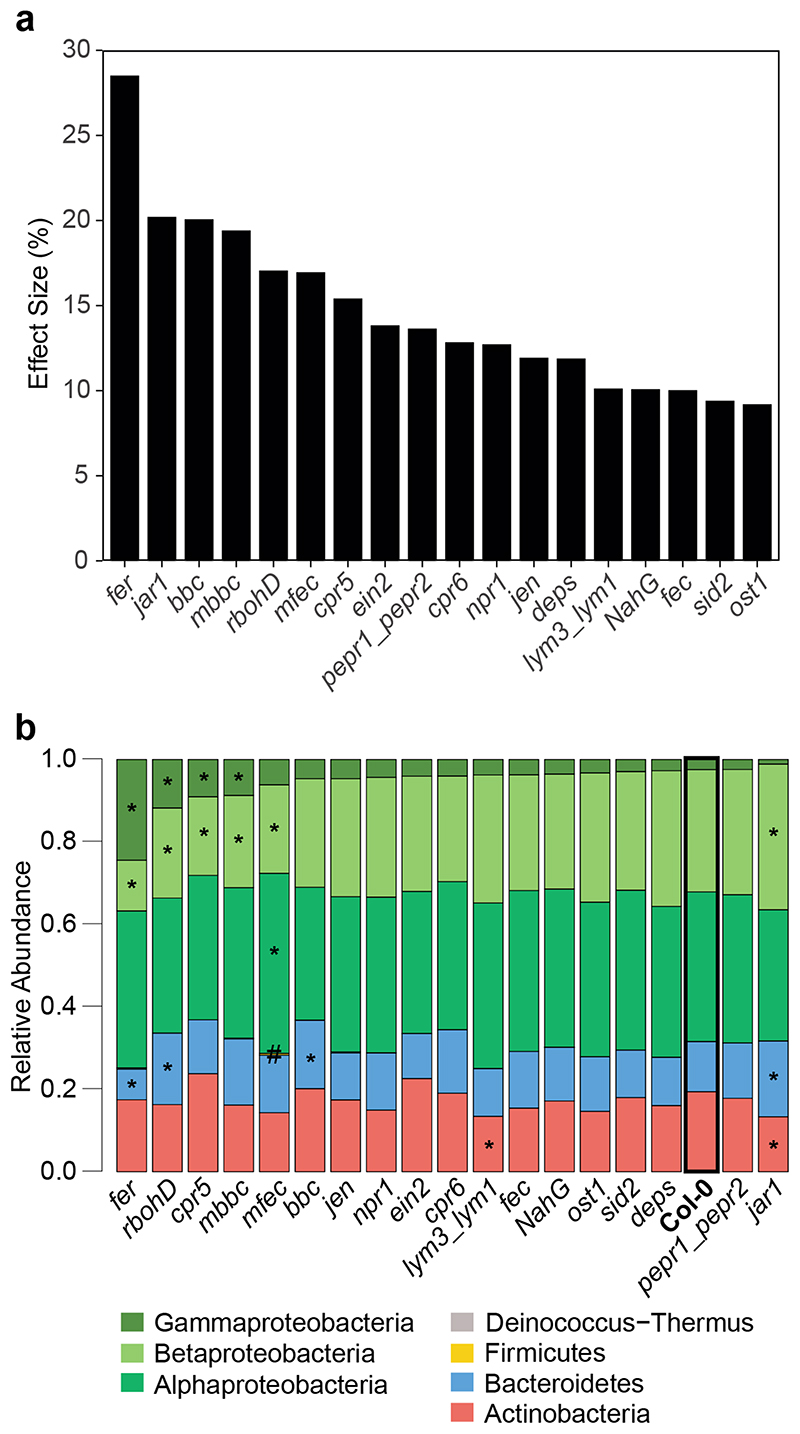
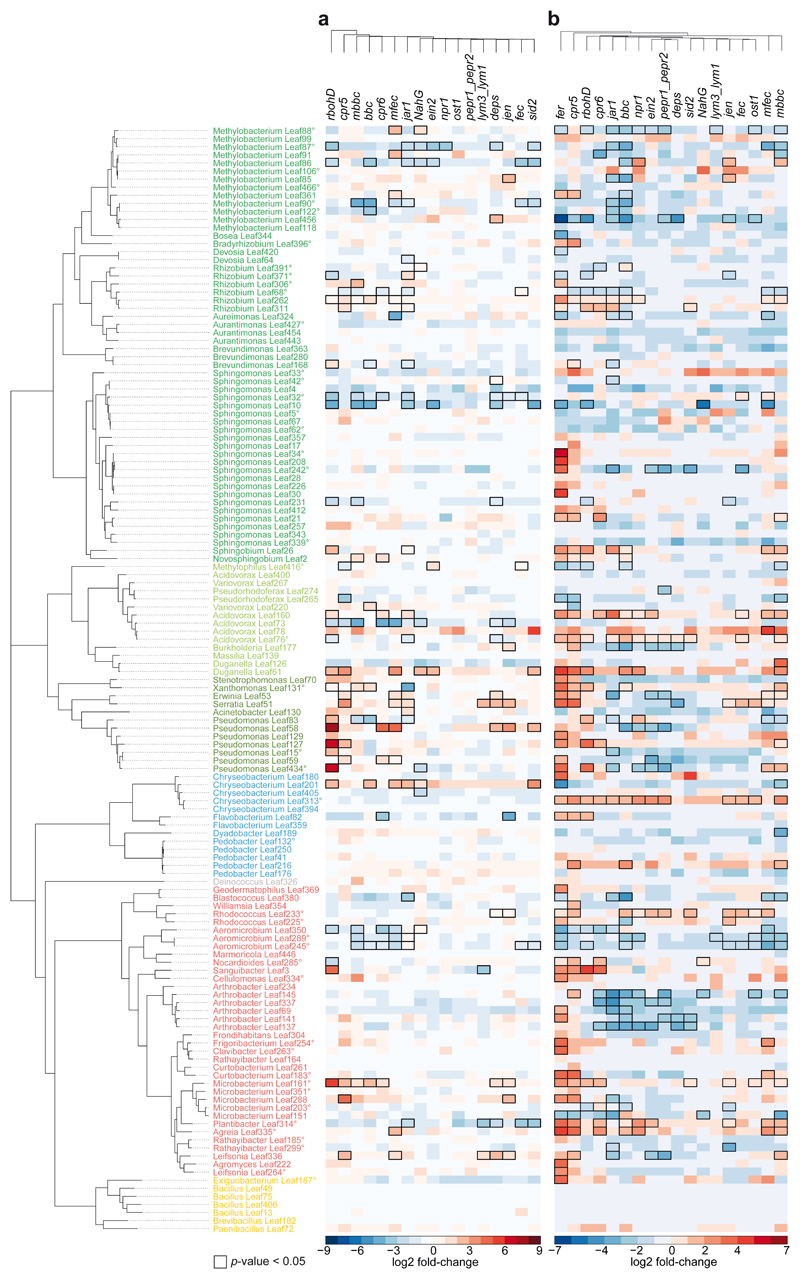
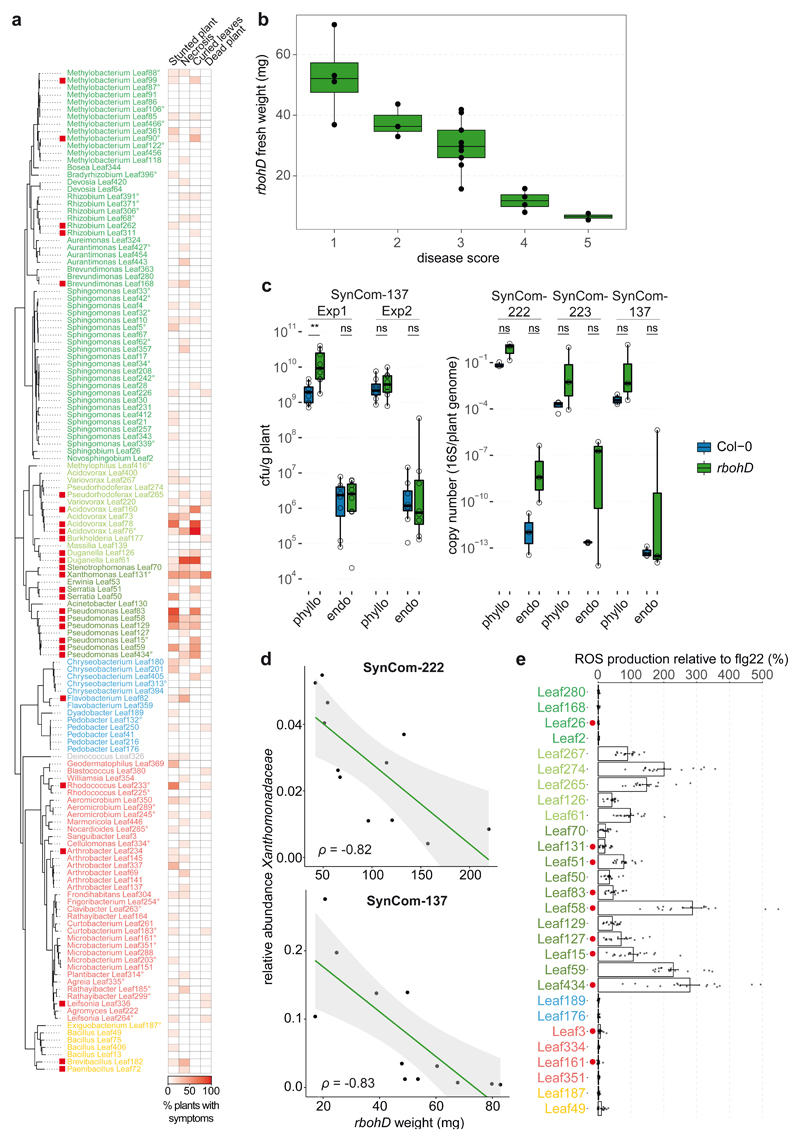
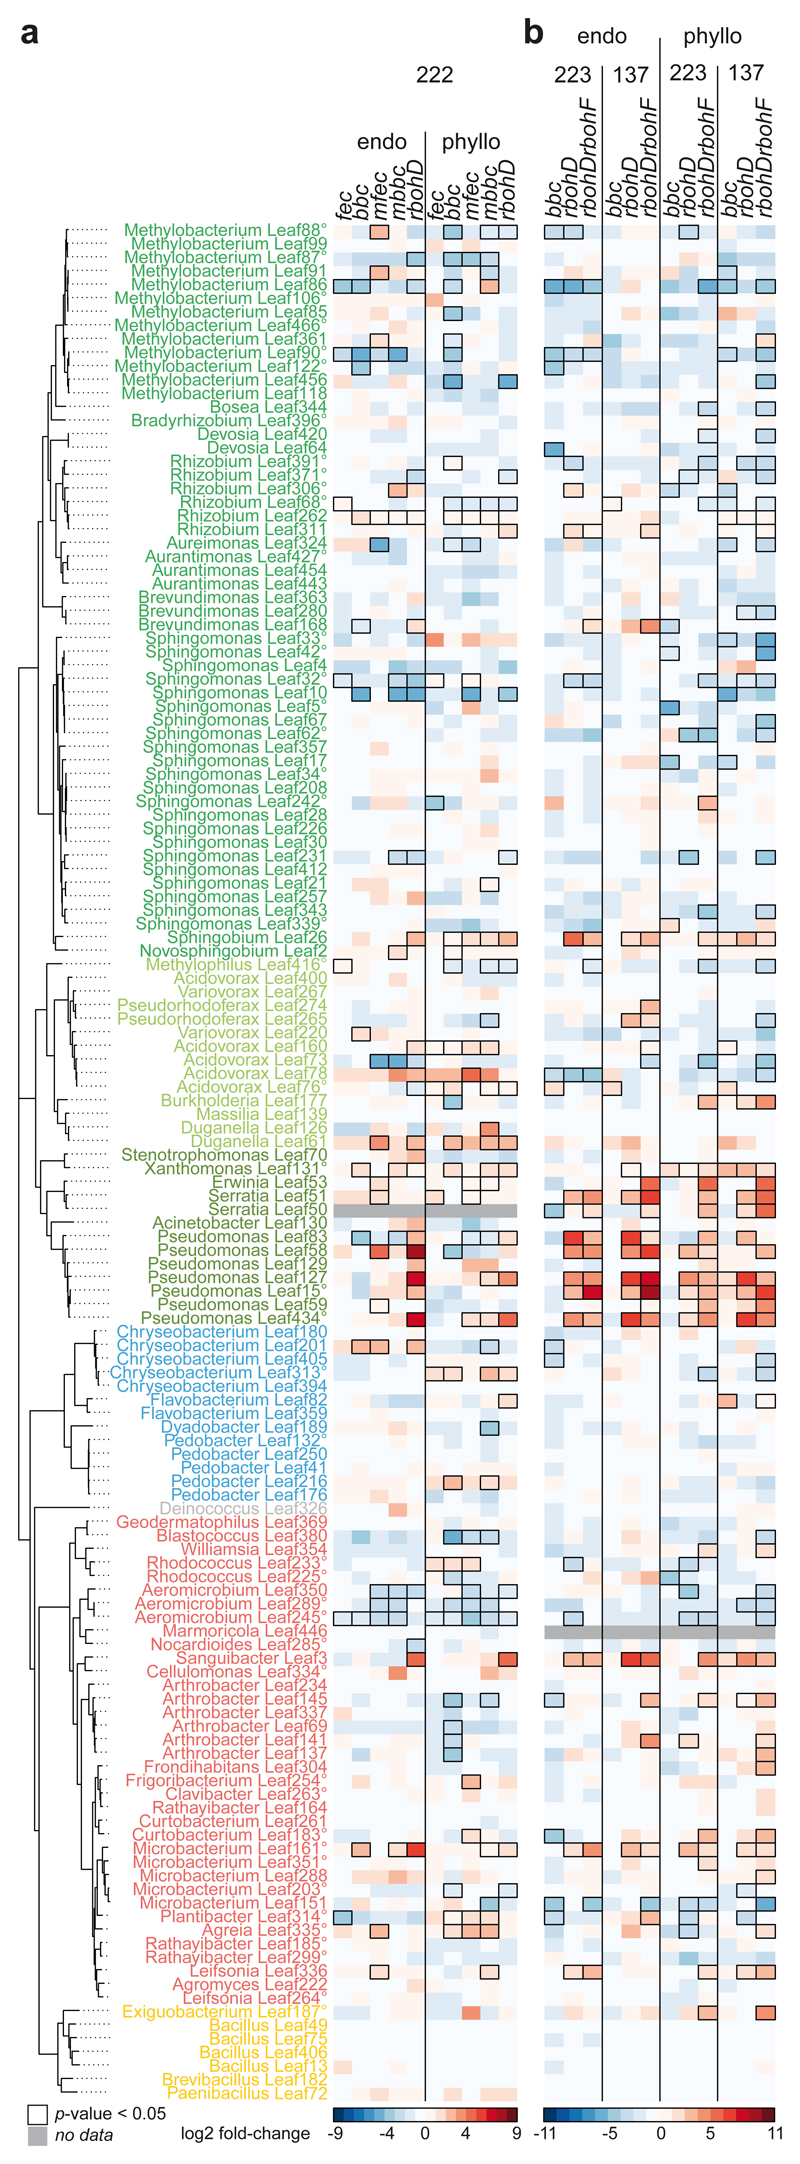
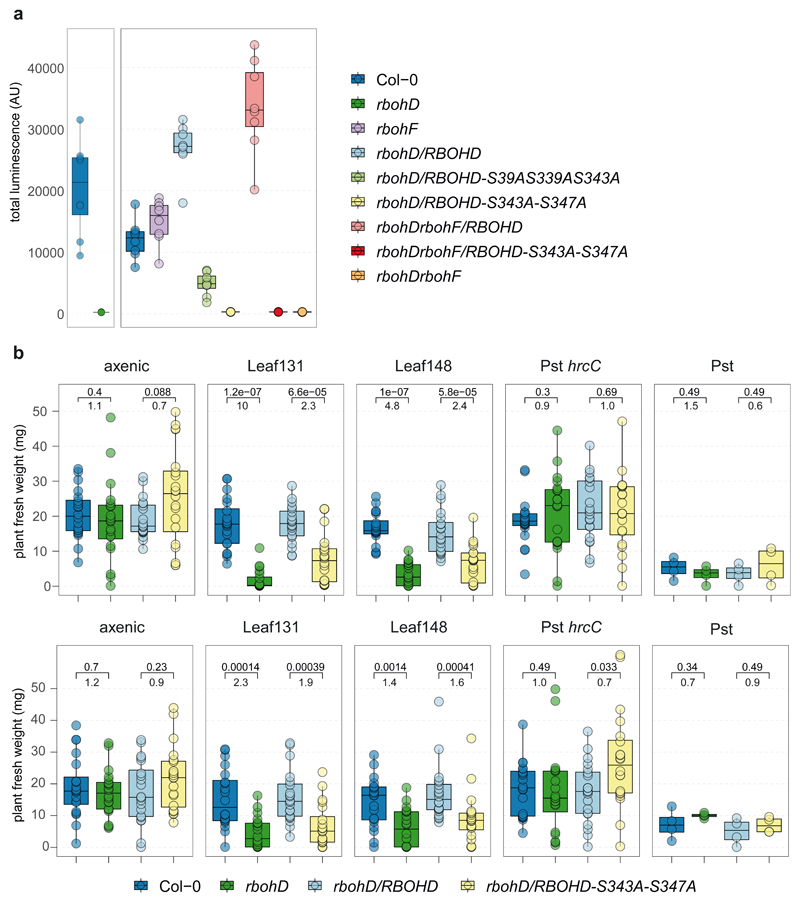
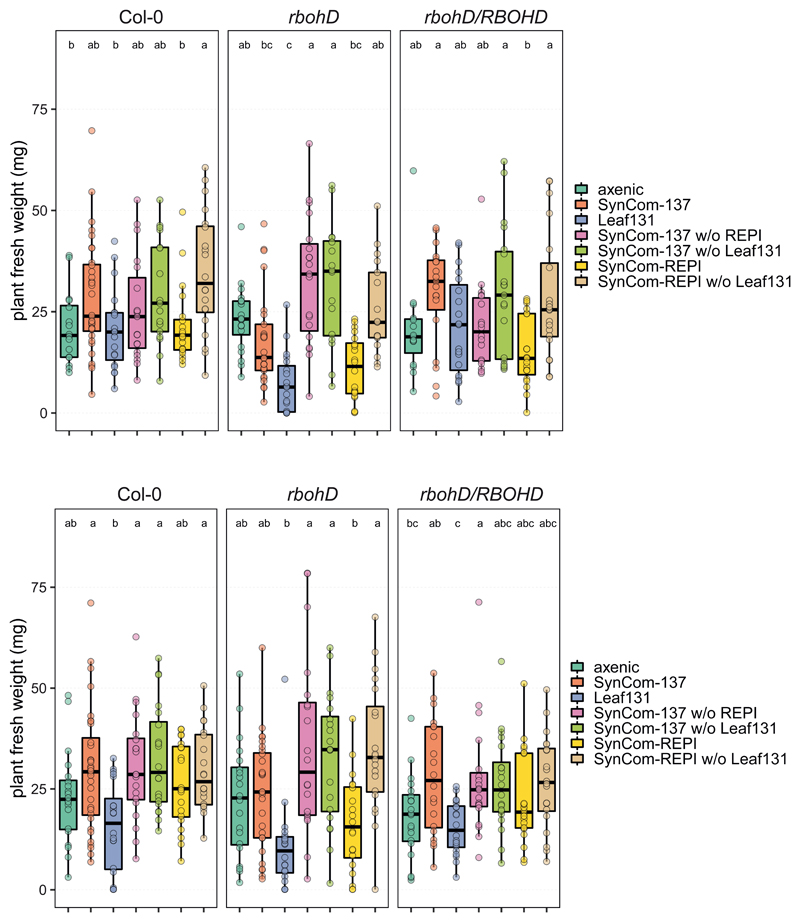
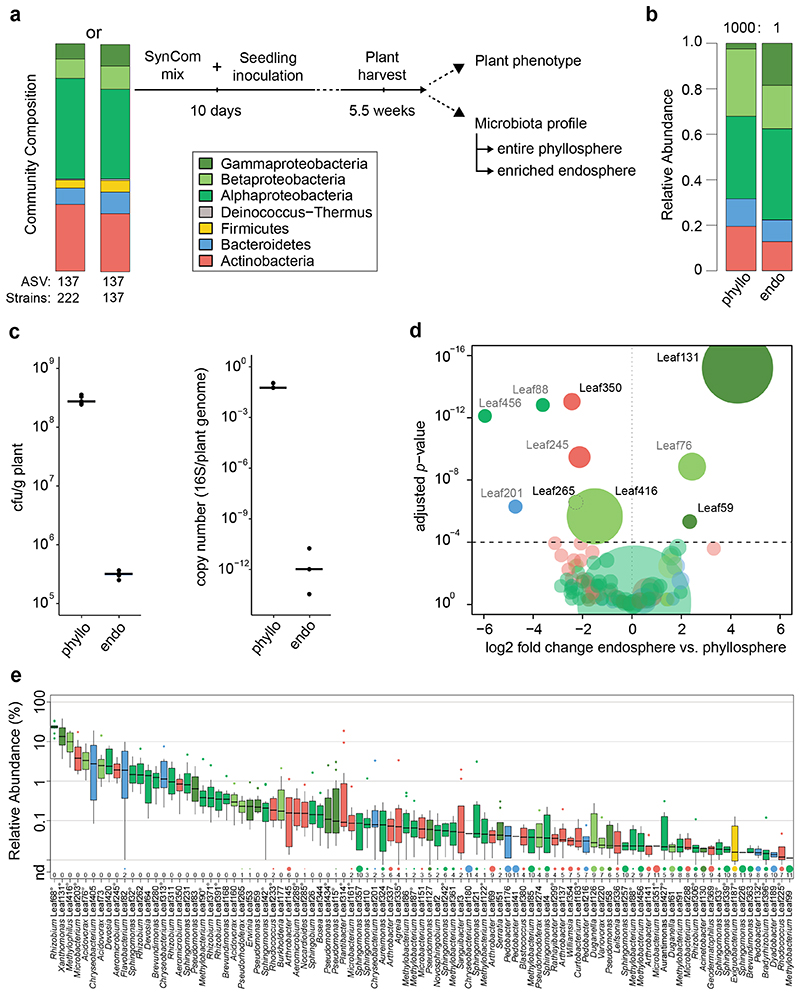
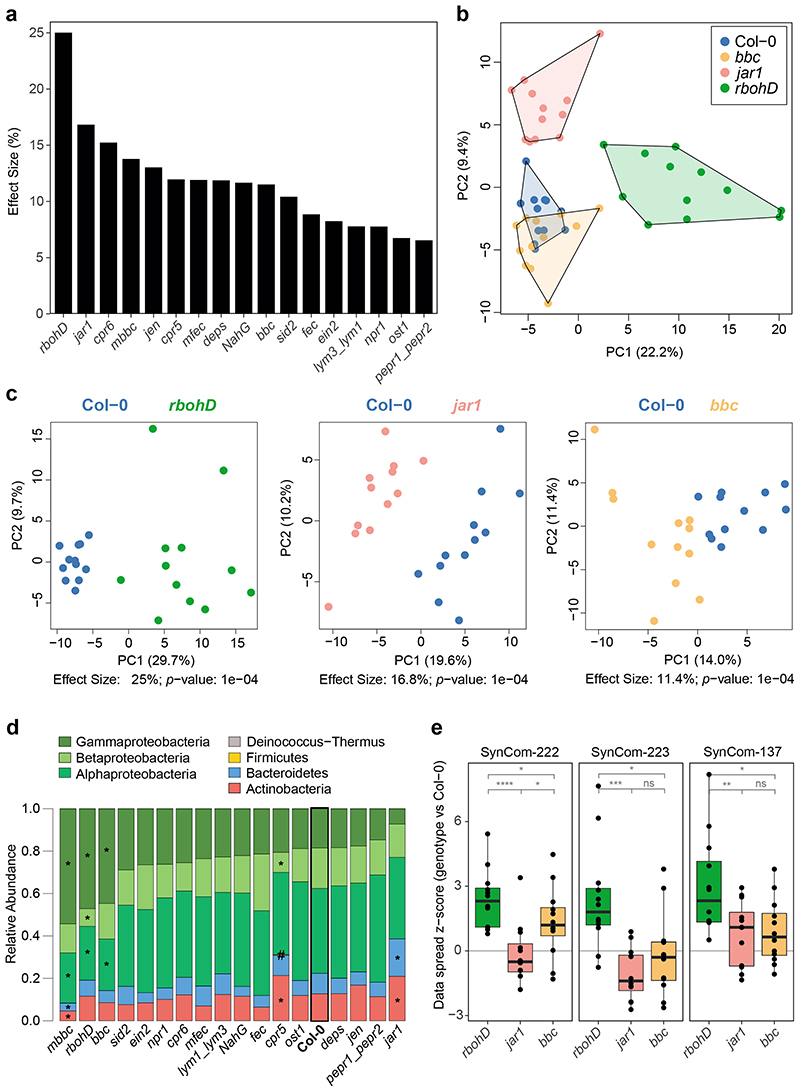
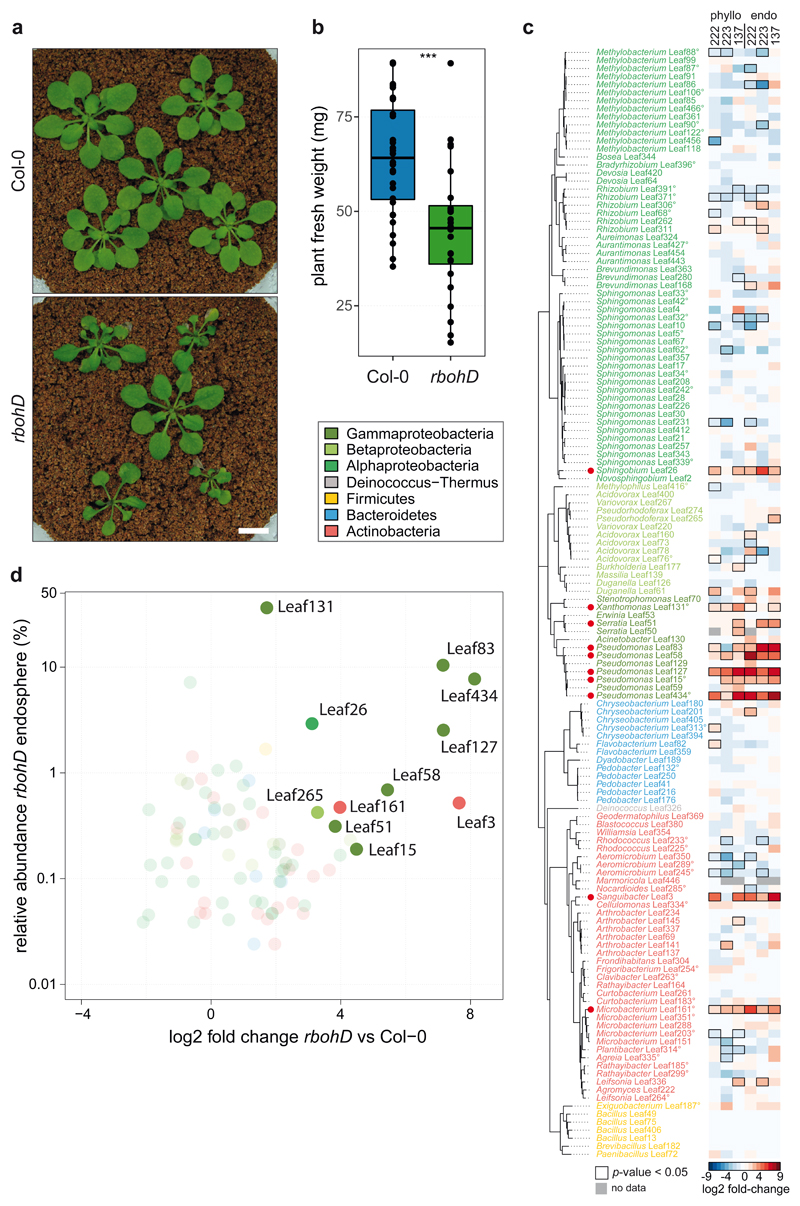
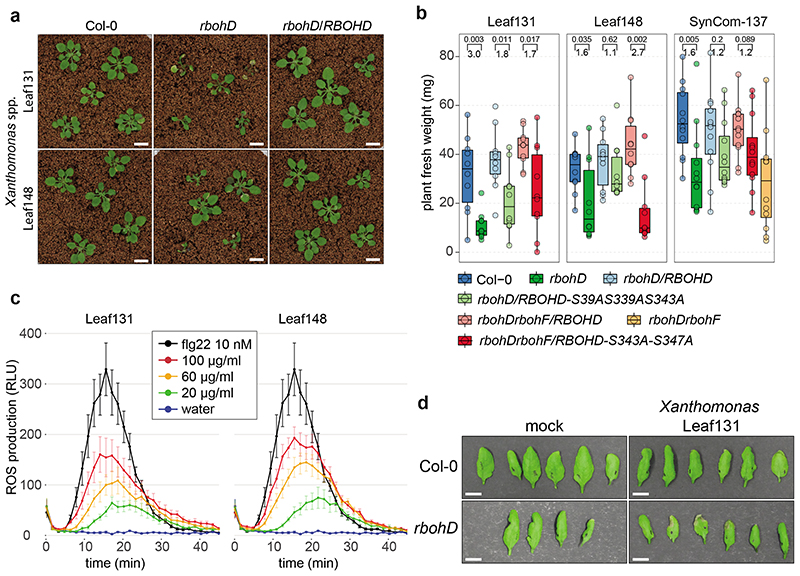
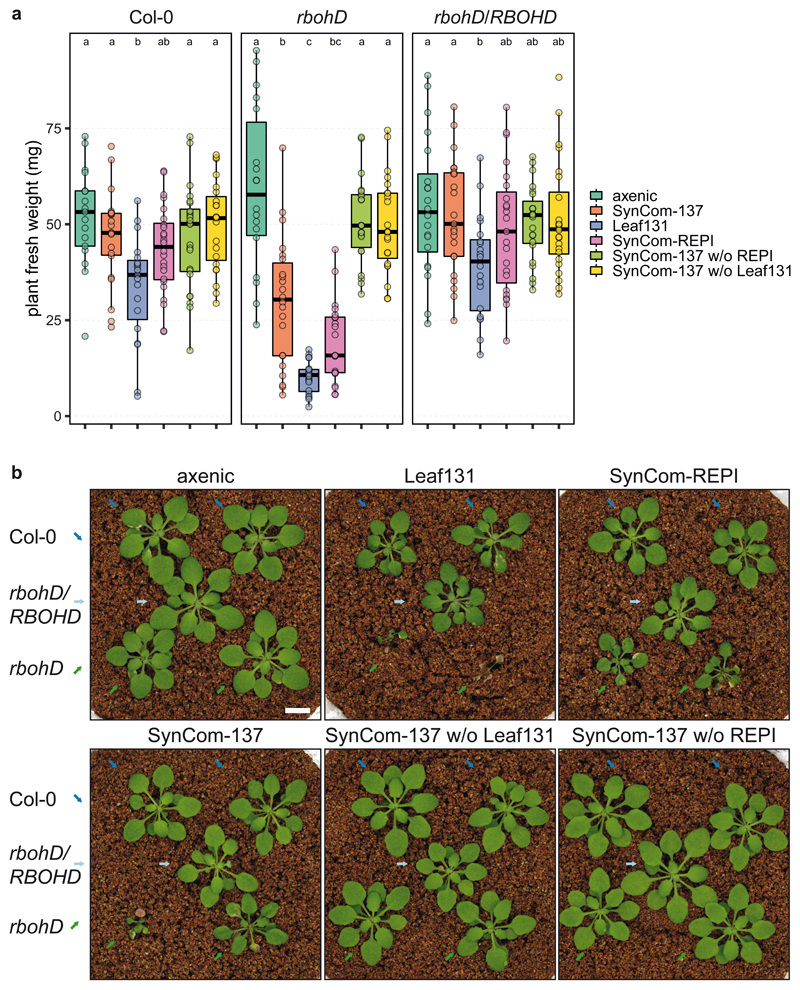
The plant microbiota consists of a multitude of microorganisms that can affect plant health and fitness. However, it is currently unclear how the plant shapes its leaf microbiota and what role the plant immune system plays in this process. Here, we evaluated Arabidopsis thaliana mutants with defects in different parts of the immune system for an altered bacterial community assembly using a gnotobiotic system. While higher-order mutants in receptors that recognize microbial features and in defence hormone signalling showed substantial microbial community alterations, the absence of the plant NADPH oxidase RBOHD caused the most pronounced change in the composition of the leaf microbiota. The rbohD knockout resulted in an enrichment of specific bacteria. Among these, we identified Xanthomonas strains as opportunistic pathogens that colonized wild-type plants asymptomatically but caused disease in rbohD knockout plants. Strain dropout experiments revealed that the lack of RBOHD unlocks the pathogenicity of individual microbiota members driving dysbiosis in rbohD knockout plants. For full protection, healthy plants require both a functional immune system and a microbial community. Our results show that the NADPH oxidase RBOHD is essential for microbiota homeostasis and emphasizes the importance of the plant immune system in controlling the leaf microbiota.


Conflict of interest statement

Competing interests

The authors declare no competing interests.

Figures

Extended Data Fig. 1
Extended Data Fig. 1. SynCom-222 composition of inoculum, phyllosphere and endosphere.
Relative abundance of strains (or ASVs indicated by superscript circle) determined by 16S rDNA amplicon sequencing of samples from SynCom-222 inoculum mix, phyllosphere and endosphere samples of A. thaliana Col-0. Box plots show the median with upper and lower quartiles and whiskers present 1.5x interquartile range. "Undetected" and dot size indicate the number of plant replicates where a given strain was not detected (n=12). Colors represent strain phylogeny.
Extended Data Fig. 2
Extended Data Fig. 2. A. thaliana Col-0 leaves after infiltration with bacterial strains.
a) Bacterial load measured as colony forming units (CFU)/cm2 at 0 and 5 days post infiltration (dpi). Xanthomonas Leaf131, Pseudomonas Leaf59, Pseudorhodoferax Leaf265, Pseudomonas syringae pv. tomato DC3000 (Pst) hrcC- and wild-type Pst were infiltrated at OD=0.002 (~106 CFU/ml) into leaves of soil-grown, four-week-old Col-0 plants. Infiltrated leaves were harvested, surface sterilized in 70% ethanol and homogenized before serial dilution plating. Box plots show the median with upper and lower quartiles and whiskers present 1.5x interquartile range. Statistical differences were calculated with two-tailed Mann-Whitney U-test (0 dpi, n=4; 5 dpi, n=8; ns, not significant; * p<0.05, ** p<0.01). b) Photographs of leaves from Col-0 five days after treatments as described above. White bar indicates one cm.
Extended Data Fig. 3
Extended Data Fig. 3. Genotype effect on bacterial community in phyllosphere.
a) Effect of plant genotype on phyllosphere community. The bacterial community of each genotype was compared to Col-0 wild-type in principal component analysis (PCA, n=12) followed by PERMANOVA (permutations=10,000), and the effect size of the genotype was plotted in decreasing order. Effect size represents variance explained by genotype (p-value<0.05, Benjamini-Hochberg adjusted; n=12). b) Relative abundance of phyllosphere bacteria on the indicated plant genotypes. Asterisks (or hash tags for Firmicutes) denote significant differences in taxa on genotypes compared to Col-0 in a two-sided t-test (p<0.05, Benjamini-Hochberg adjusted, n=12).
Extended Data Fig. 4
Extended Data Fig. 4. Overview and clustering of community profiles on genotypes versus Col-0.
a) Strain changes in endosphere communities are displayed in a heatmap as log2 fold-change of strains in the endosphere of the individual genotypes versus Col-0 (columns). Strains or ASVs (indicated by superscript circle) of SynCom-222 are ordered and colored by phylogeny. Hierarchical clustering (R command hclust, method "single") of genotypes was performed on an Euclidean distance matrix of log2 fold-changes between test conditions and controls. b) Strain changes in phyllosphere communities shown in the heatmap with genotype clustering as described above. Differential strain abundance was calculated using DESeq2, and statistical significance was expressed with p-values (two-sided Wald test, Benjamini-Hochberg adjusted): the black cell rectangle highlights significant changes p<0.05.
Extended Data Figure 5
Extended Data Figure 5. Microbiota-induced disease in rbohD is linked to the enrichment of Xanthomonadaceae.
a) Screening of plant phenotypes and disease symptoms in rbohD after colonization with individual bacterial strains. Germ-free, 10-day-old rbohD seedlings were inoculated with a bacterial suspension (OD600 ranging from 0.02 to 0.08), and the plant phenotype was examined after 3.5 weeks (n=8). Inoculated plants showed a variety of phenotypes, e.g., stunted plants, necrotic lesions, curled leaves or dead plants. Phenotype-inducing strains were selected based on symptoms and are highlighted by red rectangles in the phylogeny. b) Disease index was assessed in rbohD plants: 1, healthy; 2, mild symptoms on individual leaves; 3, stronger symptoms on multiple leaves; 4, strong symptoms on whole plant; 5, severe symptoms or dead plant. The graph displays the plant fresh weight (mg) of SynCom-137-inoculated rbohD plants (n=20) per disease category. Box plots show the median with upper and lower quartiles and whiskers present 1.5x interquartile range. c) Bacterial load in SynCom-137-inoculated Col-0 and rbohD plants measured as colony forming units (CFU) per gram of plant fresh weight isolated from the endosphere and phyllosphere (n=16; two-tailed Mann-Whitney U-test; ns, not significant; **, p<0.01). Bacterial load in Col-0 and rbohD plants inoculated with the indicated SynCom represented by qPCR of the bacterial 16S rDNA gene relative to plant gene. Box plots show the median with upper and lower quartiles and whiskers present 1.5x interquartile range. Statistical significance was calculated by two-tailed Mann-Whitney U-test (n=3, each pool of four DNA samples; ns, not significant). qPCR data for SynCom-222 in Col-0 are the same as in Figure 1c. d) Correlation analysis between the relative abundance of Xanthomonadaceae in phyllosphere samples of rbohD inoculated with the indicated SynCom and plant fresh weight. The Spearman coefficient ρ (p-value<0.01) was calculated using ggscatter command (ggpubr, R), grey area shows 95% confidence interval of regression line in green. Correlation data on endosphere samples was not possible due to bulk surface sterilization of plants. e) ROS accumulation was measured in leaf discs with a luminol-based assay after treatment with extracts from heat-killed bacteria. ROS production was recorded for 45 min, and luminescence counts were integrated over time. ROS triggered by individual treatments were normalized to ROS production by 10 nM flg22. Normalized ROS accumulation is shown for each bacterial strain. Barplots show mean and error bars show standard deviation (n=16; combined data from two independent experiments). Red dots indicate rbohD-enriched strains.
Extended Data Fig. 6
Extended Data Fig. 6. The community assembly of rbohD and rbohDrbohF substantially differs from that of other PTI genotypes.
The heatmap shows log2 fold-changes in strain abundance on different genotypes compared to Col-0 wild-type. Columns show endosphere and phyllosphere samples from plants inoculated with either a) SynCom-222 or b) SynCom-223 or SynCom-137. Strains (or ASVs indicated by superscript circles) are ordered and colored by phylogeny. Statistical significance of differential strain abundances was calculated with the two-sided Wald test (DESeq2 package, R) and highlighted with a black cell rectangle for p<0.05 (n=12; Benjamini-Hochberg adjusted).
Extended Data Fig. 7
Extended Data Fig. 7. PTI-associated phosphorylation sites of RBOHD are involved in resistance to opportunistic pathogens.
a) ROS production of A. thaliana Col-0, rbohD, rbohF, rbohD/RBOHD, rbohD/RBOHD-S39AS339AS343A, rbohD/RBOHD-S343A-S347A, rbohD/RBOHD-S343A-S347A, rbohDrbohF/RBOHD, rbohDrbohF/RBOHD-S343A-S347A and rbohDrbohF, after treatment with 100 nM flg22. ROS production was measured in leaf discs from soil-grown plants with a luminol-based assay and expressed as integrated luminescence over 45 min (AU, arbitrary units). Box plots show the median with upper and lower quartiles and whiskers present 1.5x interquartile range. b) Fresh weight of Col-0, rbohD, rbohD/RBOHD, and rbohD/RBOHD-S343A-S347A inoculated with individual strains of Xanthomonas spp. Leaf131, Leaf148, Pst hrcC-, and Pst wild-type or mock-inoculated with 10 mM MgCl2. Germ-free 10-day-old seedlings were inoculated with OD=0.02 of the respective strains. Box plots show the median with upper and lower quartiles and whiskers present 1.5x interquartile range. Significant differences were calculated between the mutants and their respective controls (n=20; two-tailed Mann-Whitney U-test). Brackets above bar plots indicate comparison groups with p-values displayed above and fold-change below. Data from two independent experiments are shown in separate graphs.
Extended Data Fig. 8
Extended Data Fig. 8. Leaf131 is required and sufficient for disease in rbohD.
Two independent replicate experiments with dropout synthetic communities as presented in Figure 5. In addition, SynCom-REPI without (w/o) Leaf131 was tested and compared to SynCom-REPI. Significant differences were calculated with ANOVA and Tukey's HSD post-hoc test (n=20, letters indicate significance groups, α=0.05).
Figure 1
Figure 1. Characterization of the At-LSPHERE model community in the phyllosphere and endosphere of Arabidopsis thaliana.
a) Schematic workflow of SynCom experiments. Two types of SynCom (SynCom-222 and SynCom-137) with similar taxonomic compositions but different numbers of strains as indicated below the stacked bar plot were used (see Supplementary Table). Colors represent bacterial phyla and classes for Proteobacteria. In the experiments, germ-free Arabidopsis thaliana seedlings were inoculated after 10 days, and aboveground plant tissue was harvested 5.5 weeks after germination. Plant phenotype was characterized by scoring disease symptoms and fresh weight measurements. Bacterial community profiles were determined for the entire phyllosphere community and the endosphere-enriched community by 16S rDNA amplicon sequencing. b) Community composition in the A. thaliana phyllosphere (“phyllo”) and endosphere (“endo”) after inoculation with SynCom-222 on phylum and class level for Proteobacteria. Numbers above bar stacks indicate a 1000-fold difference between bacterial loads in both compartments. c) Overall bacterial load on SynCom-inoculated plants measured by colony forming units per gram plant fresh weight (n=5) and by qPCR of bacterial 16S rDNA relative to plant gene abundance in the phyllosphere and endosphere (n=3). d) Volcano plot shows log2-fold changes in strain abundances of SynCom-222 between phyllosphere and endosphere samples (n=12). Dot size represents relative abundance in endosphere. Statistical significance of differential strain abundance is expressed with p-values determined by two-sided Wald test and Benjamini-Hochberg adjusted. Black labels highlight strains that were affected in all three SynCom experiments (see Source Data Figure 1). e) Relative abundance of strains (or ASVs indicated by superscript circles) determined by 16S rDNA amplicon sequencing of the SynCom-222 endosphere. Detected strains with relative abundance >0.01% are displayed (see entire graph in Extended Data Figure 1). Box plots show the median with upper and lower quartiles and whiskers present 1.5x interquartile range. “nd” and dot size indicate the number of plant replicates where a given strain was not detected (n=12). Colors represent strain phylogeny.
Figure 2
Figure 2. Effect of plant genotype on the leaf endosphere community.
a) The endosphere bacterial community (SynCom-222) of each plant genotype was compared to Col-0 wild-type plants in principal component analysis (PCA, n=12) followed by PERMANOVA (permutations=10,000), and the effect size of the genotype was plotted in decreasing order. b) PCA of bacterial endosphere communities in Col-0 (blue), bbc (orange), jar1 (pink) and rbohD (green). PC1 and PC2 are principal components PC1 and PC2 with their explained variance (%). c) Exemplary PCA of endosphere communities in rbohD, jar1 and bbc. Effect size represents variance explained by genotype, and statistical significance is expressed with p-values determined by PERMANOVA (Benjamini-Hochberg adjusted, n=12). PCA results for all genotypes can be found in Source Data of Fig. 2a. d) Relative abundance of phyla (and classes for Proteobacteria) of endosphere bacteria on the indicated plant genotypes. Genotypes are ordered by decreasing abundance of Gammaproteobacteria. Asterisks (or hash tags for Firmicutes) denote significant differences in taxa on a genotype compared to Col-0 in a two-sided t-test (p<0.05, Benjamini-Hochberg adjusted, n=12). e) Community spread of genotypes rbohD, jar1 and bbc relative to Col-0 in PCA. The community spread was calculated as the Euclidean distance of data points to the centroid in PCA. Distances of genotypes were normalized to the median distance of Col-0 as the z-score. Community spread was calculated for SynCom-222, SynCom-223 and SynCom-137. Box plots show the median with upper and lower quartiles and whiskers present 1.5x interquartile range. Statistical differences were determined by two-sided t-test (n=12; ns, not significant; *p<0.05; **p<0.01; ***p<0.001).
Figure 3
Figure 3. The plant mutant rbohD shows a dysbiosis phenotype and assembles a microbiota enriched in Gammaproteobacteria.
a) Representative pictures of five-week-old Col-0 and rbohD inoculated with SynCom-137. White bar indicates one cm. b) Fresh weight of aboveground plant tissue of Col-0 and rbohD inoculated with SynCom-137. Box plots show the median with upper and lower quartiles and whiskers present 1.5x interquartile range (n= 12; two-tailed Mann-Whitney U-test; ***, p<0.001). c) Heatmap shows log2 fold-changes of strains in phylogenetic order in rbohD compared to Col-0 wild-type plants. Columns show phyllosphere and endosphere samples from plants inoculated with either SynCom-222, SynCom-223 or SynCom-137. Black rectangles show significant changes, p<0.05 (n=12; Wald test, Benjamini-Hochberg adjusted). Strains (or ASVs indicated by superscript circles) are colored according to phylogeny. Red dots highlight enriched strains in rbohD across multiple experiments. d) Volcano plot shows the relative abundance of rbohD-enriched strains of SynCom-137 in rbohD endosphere (log2-fold-changes in rbohD compared to Col-0 with adjusted p-value <0.05).
Figure 4
Figure 4. Xanthomonas Leaf131 and Leaf148 are opportunistic pathogens in immunocompromised rbohD.
a) Pictures of Col-0, rbohD and rbohD/RBOHD plants inoculated with Xanthomonas Leaf131 or Leaf148. Germ-free 10-day-old seedlings were inoculated with bacterial solution at OD=0.02 (~107 CFU/ml). White bar indicates one cm. b) PTI-associated phosphorylation sites of RBOHD are involved in resistance to opportunistic pathogens and in microbiota homeostasis. Fresh weight of phyllosphere plant tissue from Col-0, rbohD, rbohD/RBOHD, rbohD/RBOHD-S39AS339AS343A, rbohDrbohF/RBOHD, rbohDrbohF/RBOHD-S343A-S347A and rbohDrbohF after inoculation with either single strain Xanthomonas Leaf131 or Leaf148 or SynCom-137. Box plots show the median with upper and lower quartiles and whiskers present 1.5x interquartile range. Brackets denote comparison groups, and the number above indicates the p-value of two-tailed Mann-Whitney U-test and the number below the fold-change in plant weight (n=10). c) Apoplastic ROS production was measured over time in leaf discs with a luminol-based assay after treatment with water, 10 nM flg22 or extracts from heat-killed Xanthomonas Leaf131 and Leaf148 adjusted to the indicated total protein concentrations. ROS production is displayed as relative light units (RLU) and curves show the mean (n=8) and error bars the standard error. d) Photographs of leaves from Col-0 and rbohD five days after infiltration with 10 mM MgCl2 or Xanthomonas Leaf131 at OD=0.002 (~106 CFU/ml). White bar indicates one cm.
Figure 5
Figure 5. Xanthomonas Leaf131 causes dysbiosis in rbohD.
a) Fresh weight of Col-0, rbohD and rbohD/RBOHD plants inoculated with either 10 mM MgCl2 (axenic), SynCom-137, single strain Leaf131, SynCom-REPI (containing 32 rbohD-enriched and phenotype-inducing strains), SynCom-137 without (w/o) Leaf131, SynCom-137 w/o REPI. Germ-free 10-day-old seedlings were inoculated with OD=0.02 of SynCom-137, and other inocula with lower strain numbers were diluted with 10 mM MgCl2 to obtain equal amounts of cells from each strain in the inoculum. Box plots show the median with upper and lower quartiles and whiskers present 1.5x interquartile range. Significant differences were calculated with ANOVA and Tukey’s HSD post-hoc test (n=20, letters indicate significance groups, α=0.05). b) Pictures of plants treated as indicated above. Genotypes Col-0, rbohD and rbohD/RBOHD were grown in the same microbox in rows, and different genotypes are highlighted by colored arrows (Col-0, blue; rbohD/RBOHD, light blue; rbohD, green). White bar indicates one centimeter. The experiment was repeated twice with additional treatments (see Extended Data Figure 8).

References

    1. Beattie GA, Lindow SE. Bacterial colonization of leaves: a spectrum of strategies. Phytopathol. 1999;89:353–359. - PubMed
    1. Vorholt JA. Microbial life in the phyllosphere. Nat Rev Microbiol. 2012;10:828–840. - PubMed
    1. Pieterse CM, et al. Induced systemic resistance by beneficial microbes. Annu Rev Phytopathol. 2014;52:347–375. - PubMed
    1. Müller DB, Vogel C, Bai Y, Vorholt JA. The plant microbiota: systems-level insights and perspectives. Annu Rev Genet. 2016;50:211–234. - PubMed
    1. Lugtenberg B, Kamilova F. Plant-Growth-Promoting Rhizobacteria. Annu Rev Microbiol. 2009;63:541–556. - PubMed

Publication types

MeSH terms

LinkOut - more resources