. 2021 Jul;595(7867):409-414.
doi: 10.1038/s41586-021-03669-y. Epub 2021 Jun 30.

Microbiota regulate social behaviour via stress response neurons in the brain

Affiliations

Microbiota regulate social behaviour via stress response neurons in the brain

Wei-Li Wu et al. Nature. 2021 Jul.

Abstract

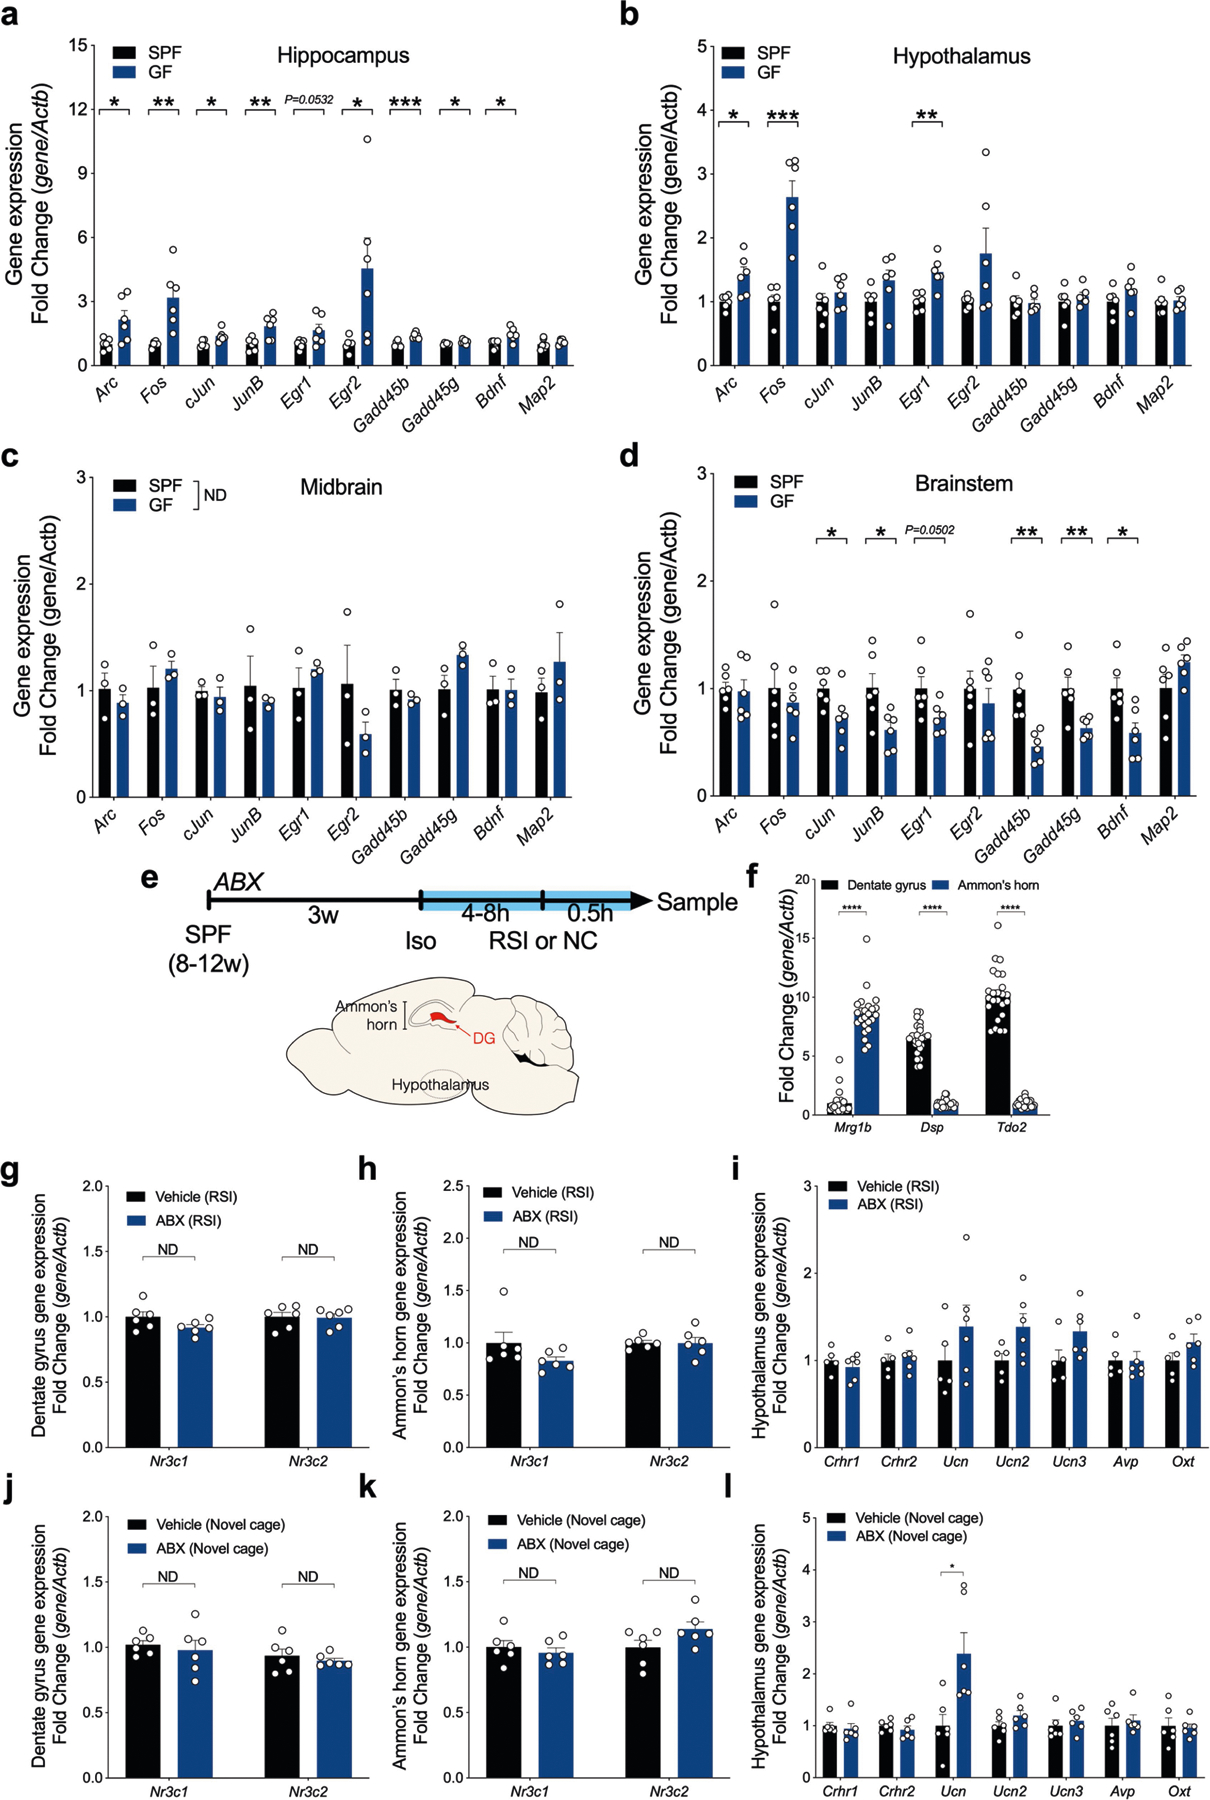
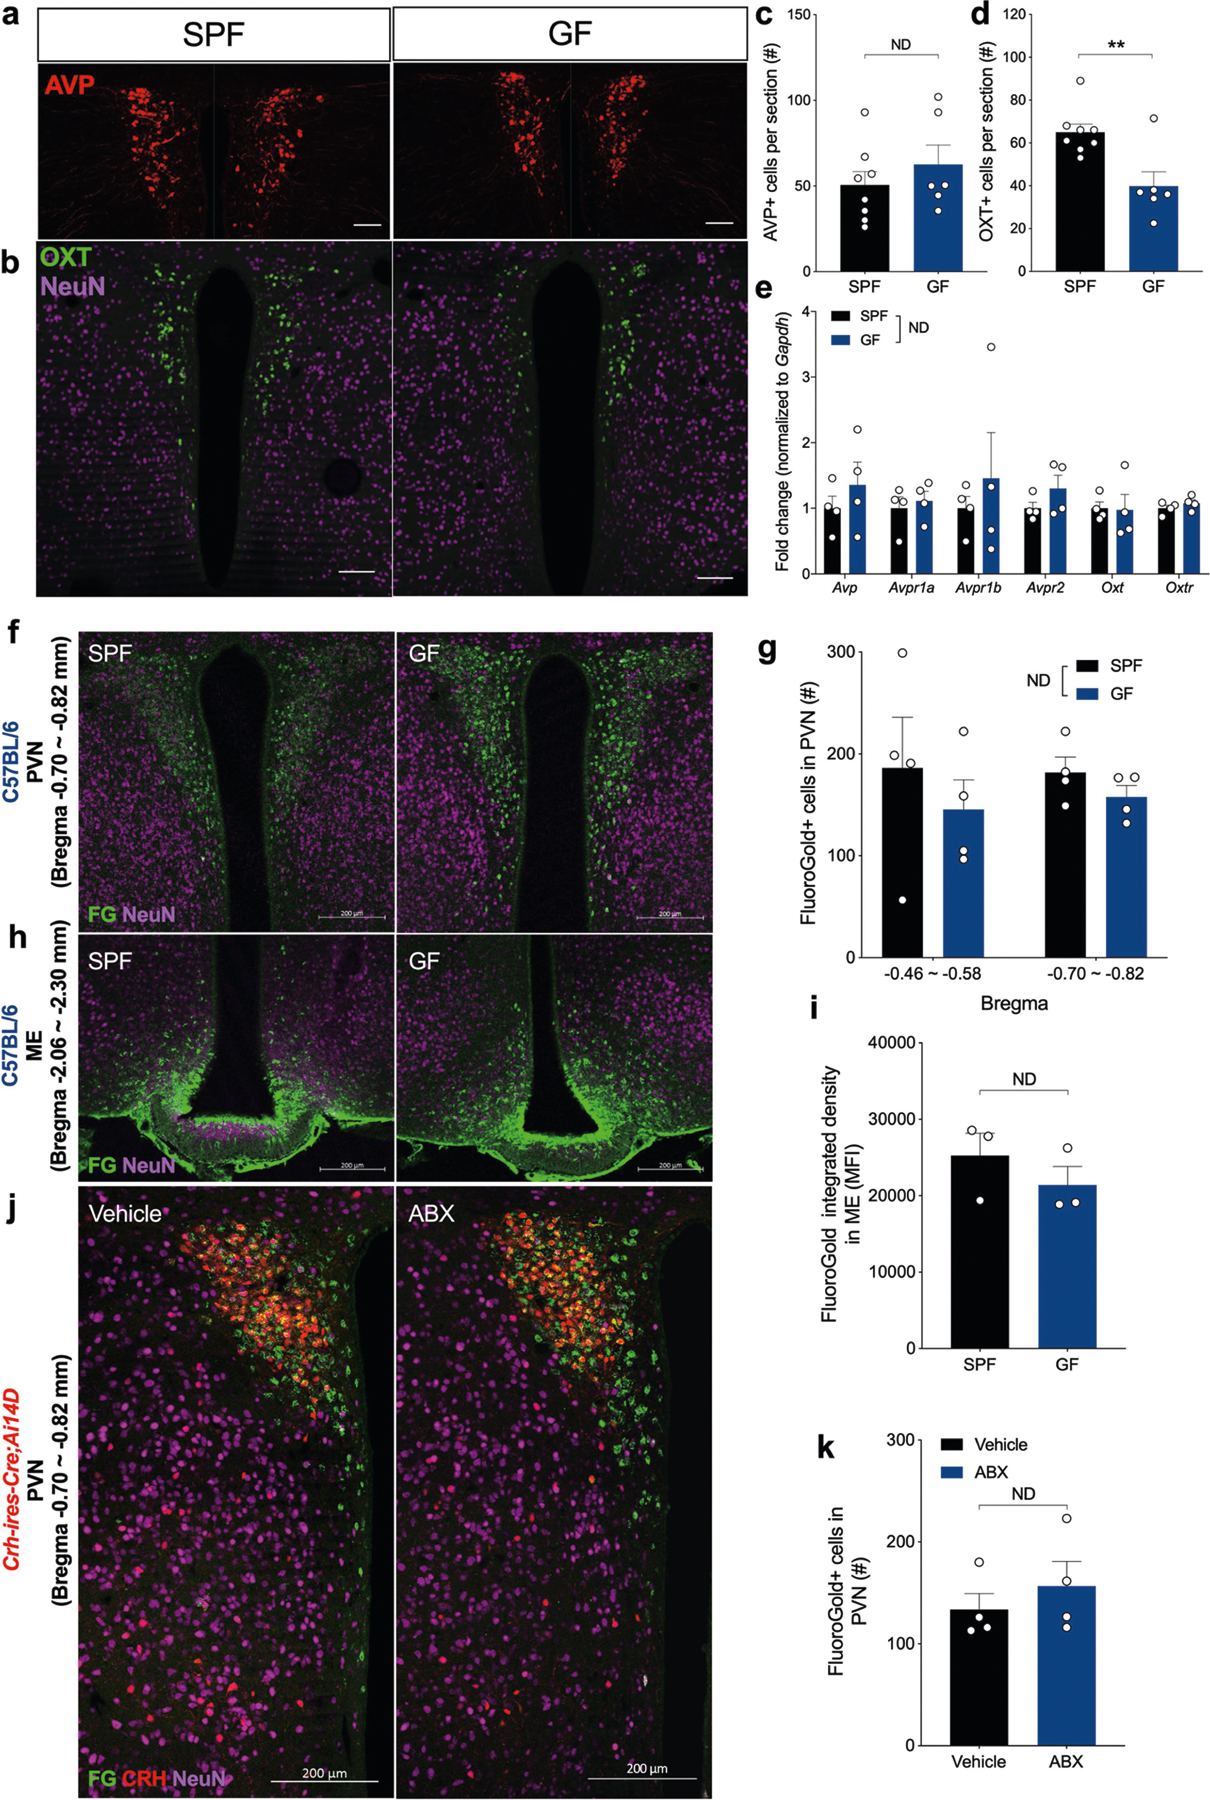
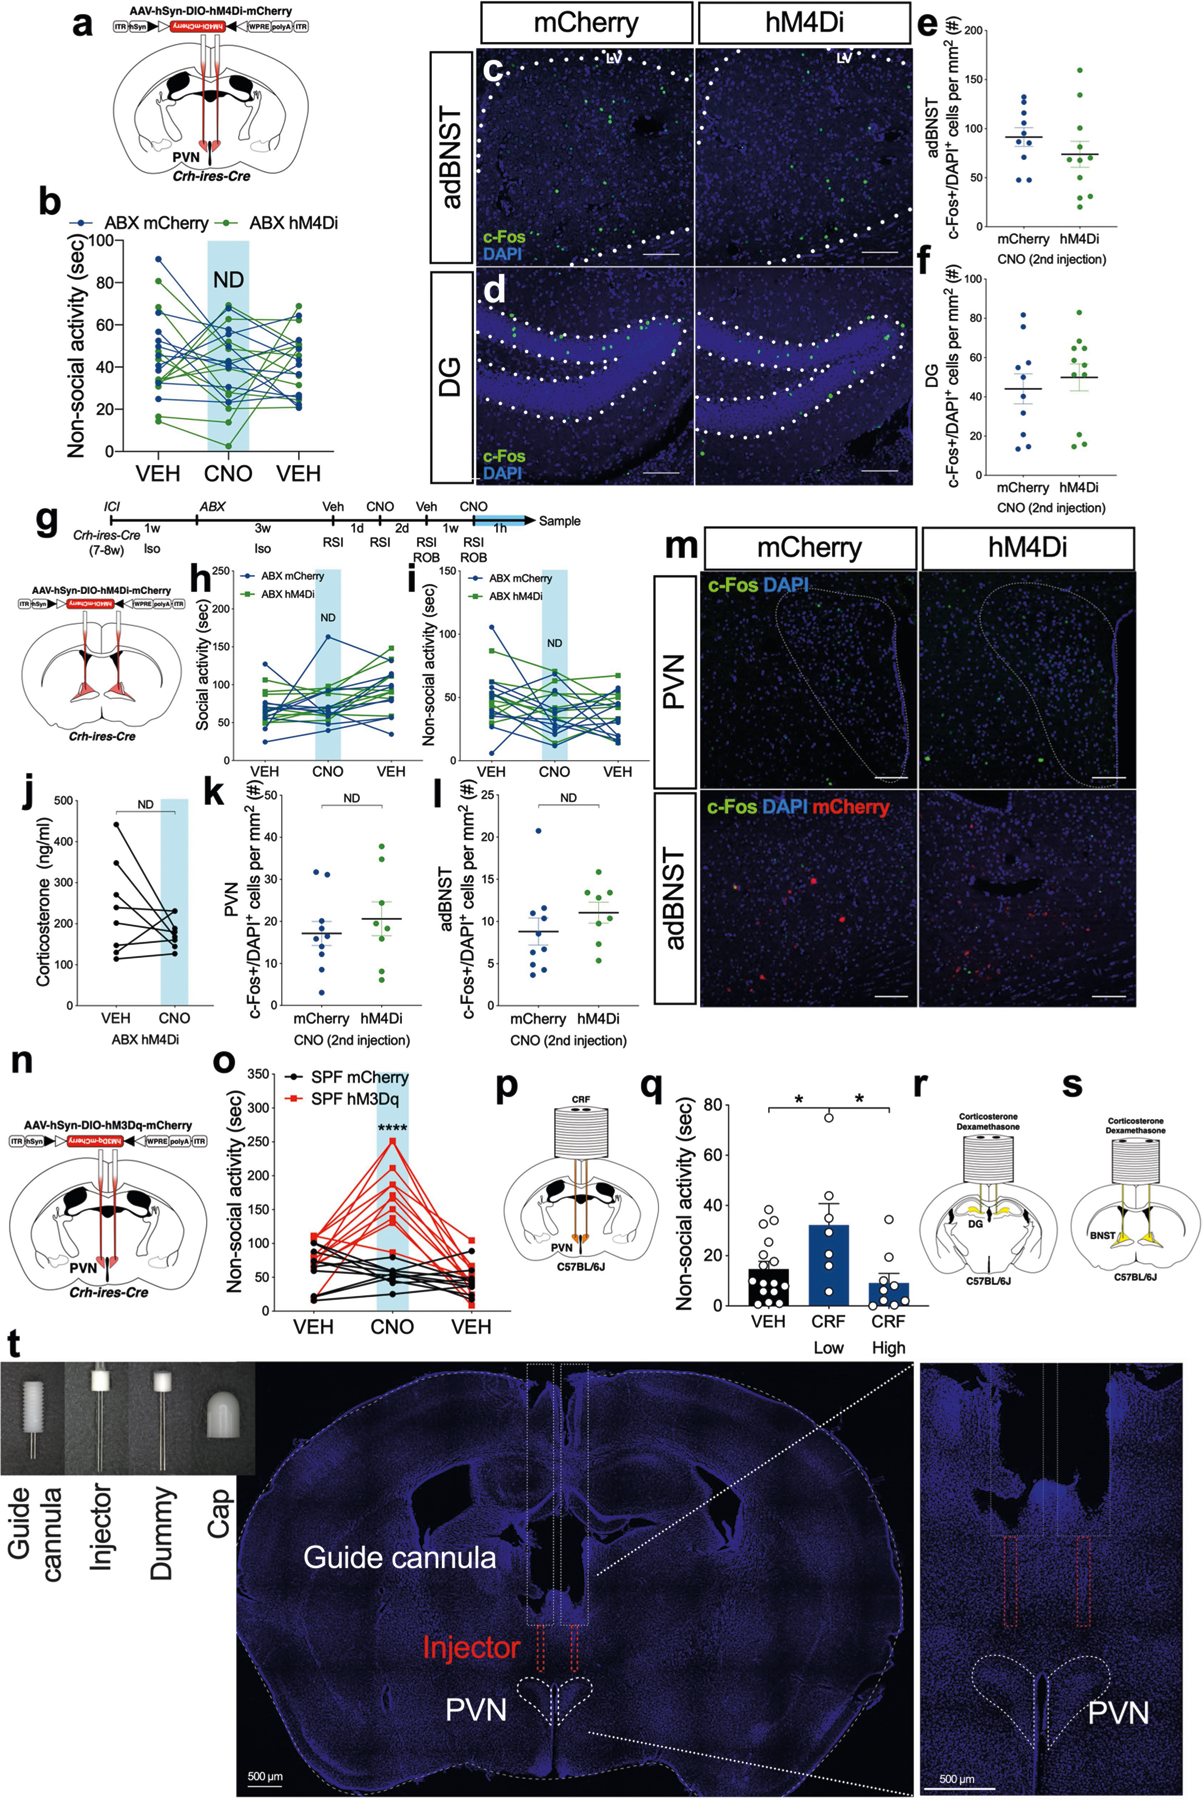
Social interactions among animals mediate essential behaviours, including mating, nurturing, and defence1,2. The gut microbiota contribute to social activity in mice3,4, but the gut-brain connections that regulate this complex behaviour and its underlying neural basis are unclear5,6. Here we show that the microbiome modulates neuronal activity in specific brain regions of male mice to regulate canonical stress responses and social behaviours. Social deviation in germ-free and antibiotic-treated mice is associated with elevated levels of the stress hormone corticosterone, which is primarily produced by activation of the hypothalamus-pituitary-adrenal (HPA) axis. Adrenalectomy, antagonism of glucocorticoid receptors, or pharmacological inhibition of corticosterone synthesis effectively corrects social deficits following microbiome depletion. Genetic ablation of glucocorticoid receptors in specific brain regions or chemogenetic inactivation of neurons in the paraventricular nucleus of the hypothalamus that produce corticotrophin-releasing hormone (CRH) reverse social impairments in antibiotic-treated mice. Conversely, specific activation of CRH-expressing neurons in the paraventricular nucleus induces social deficits in mice with a normal microbiome. Via microbiome profiling and in vivo selection, we identify a bacterial species, Enterococcus faecalis, that promotes social activity and reduces corticosterone levels in mice following social stress. These studies suggest that specific gut bacteria can restrain the activation of the HPA axis, and show that the microbiome can affect social behaviours through discrete neuronal circuits that mediate stress responses in the brain.


Conflict of interest statement

Competing interests W-L.W., M.D.A., B.D.N., and S.K.M. have filed a provisional patent on this work. All other authors declare no competing interests.

Figures

Extended Data Fig. 1 |
Extended Data Fig. 1 |. Social behaviours, non-social activity, c-Fos expression and corticosterone levels in GF and/or ABX-treated mice.
ac, Social activity in SPF and GF test mice (subject), in the context of SPF (a) or GF (b) novel mice. a, Anogenital sniff ****P < 0.0001, nose–nose sniff ****P < 0.0001, active approach ***P = 0.0003, push-crawl **P = 0.0055; b, anogenital sniff ****P < 0.0001, nose–nose sniff **P = 0.003, active approach **P = 0.0023; c, novel mouse effect P = 0.1133 (data from Fig. 1b, c). n = 20 SPF, 19 GF (vs SPF); 8 SPF, 8 GF (vs GF) mice. d, e, Social activity in vehicle (VEH)- and ABX-treated test mice (subject), in the context of SPF (d) or ABX-treated (e) novel mice. d, Anogenital sniff ***P = 0.0005, nose–nose sniff **P = 0.0028, active approach ***P = 0.0004, push-crawl P = 0.4601. n = 26 mice per group. e, P = 0.7039, n = 10 VEH, 9 ABX mice. f, Non-social activity in the reciprocal social interaction (RSI) paradigm in SPF, GF and ABX-treated mice (subject), in the context of SPF or GF novel mice. GF vs SPF novel mouse: P = 0.8086, n = 20 SPF, 19 GF mice. GF vs GF novel mouse: P = 0.1205, n = 8 mice per group. ABX vs SPF novel mouse: P = 0.5044, n = 26 mice per group. g, Non-social behaviour in a novel cage without the presence of a novel mouse. Grooming P = 0.482, digging P = 0.8689, rearing P = 0.4608 or total P = 0.1743. n = 8 SPF, 10 GF mice. h, Timeline schematic of guide cannula stereotaxic surgery, intracerebroventricular (ICV) injection of vehicle, ampicillin (A) and metronidazole (M), social behaviour, and sample collection. Social activity was tested in SPF mice injected ICV with antibiotics (subject), in the context of SPF novel mice. Social activity P = 0.5294, nose-to-nose P = 0.1784, nose-to-tail P = 0.4477. n = 12 mice per group. i, j, Timeline schematic of intraperitoneal (i.p.) injection of vehicle, ampicillin and metronidazole, open-field (OF) test, social behaviour, and sample collection. RSI (i) and open-field (j) test were tested in antibiotic-injected SPF mice (subject), in the context of SPF novel mice. Social activity P = 0.5583 (i); locomotion P = 0.3705 (j). n = 6 VEH, 4 ampicillin, 6 metronidazole mice. k, Social activity was tested in SPF, GF, VEH-treated and ABX-treated female mice (subject), in the context of SPF female novel mice. GF **P = 0.0053 and ABX *P = 0.0191. n = 10 SPF, 9 GF, 5 VEH, 5 ABX mice. l, The length of isolation shown in Fig. 1b did not affect social activity in GF or SPF controls. Microbiota effect ****P < 0.0001. n = 4 SPF (4–5 h), 7 SPF (5–6 h), 5 SPF (6–7 h), 2 SPF (7–8 h), 5 SPF (8–9 h), 10 GF (4–5 h), 3 GF (5–6 h), 4 GF (6–7 h), 6 GF (7–8 h), 4 GF (8–9 h) mice (data from Fig. 1b, c). m, Age of GF mice had no effect on social activity. P = 0.379. n = 6 (11–12 w), 5 (13 w), 8 (14–15 w) GF mice (data from Fig. 1b,d). nq, The distance travelled and social activity in the three-chamber social test for SPF and GF male mice (n, o) and VEH- and ABX-treated mice (p, q), in the context of SPF novel mice. n = 9 SPF, 10 GF, 10 VEH, 10 ABX mice. Distance moved in the sociability phase (n, GF **P = 0.0047; p, ABX P = 0.1246), time in chamber (o, left, SPF mouse (M) vs object (O) ****P < 0.0001, GF M vs O ***P = 0.0005; q, left, VEH M vs O P = 0.1220, ABX M vs O **P = 0.0063), and frequency entering chamber (o, right, SPF M vs O P = 0.1420, GF M vs O P = 0.0872; q, right, VEH M vs O P = 0.2194, ABX M vs O ***P = 0.0008). n = 9 SPF, 10 GF, 10 VEH, 10 ABX mice. r, Left, schematic of brain regions with high c-Fos expression after RSI (relevant to Fig. 1e–l). Right, representative images (from 6 SPF, 6 GF, 5 VEH, 5 ABX mice) of c-Fos staining in BLA in SPF, GF, VEH, and ABX after RSI. Scale bars, 200 μm. s, Quantification of c-Fos+ cells in BLA of GF and ABX mice. SPF vs GF P = 0.1014, VEH vs ABX P = 0.1095. n = 6 SPF, 6 GF, 5 VEH, 5 ABX mice. t, Quantification of c-Fos+ cells in various brain regions of SPF and GF mice. PVN P = 0.4239, adBNST P = 0.2571, DG P = 0.0818, BLA P = 0.2552. n = 5 SPF, 6 GF mice. u, Serum corticosterone levels in ABX-treated mice at isolation (iso), 0 h and 1 h post-RSI. VEH: Iso vs 0 h #P = 0.0129, Iso vs 1 h ##P = 0.0027, 0 h vs 1hr ##P = 0.0023; ABX: Iso vs 0 h P = 0.0624, Iso vs 1 h ##P = 0.0016, 0 h vs 1 h ##P = 0.0062. n = 5 mice per group. v, Serum corticosterone levels after novel cage exposure in GF and ABX-treated mice. ABX vs GF **P = 0.0085, SPF vs GF *P = 0.0125. n = 11 VEH, 11 ABX, 5 SPF, 4 GF mice. w, x, Serum corticosterone levels at different times of death in SPF and GF (w) and VEH and ABX mice (x) tested in Fig. 1m–o. GF ***P = 0.0005 (w), ABX **P = 0.0011 (x). w, n = 2 SPF (0–1 h), 5 SPF (1–2 h), 4 SPF (2–3 h), 4 SPF (3–4 h), 3 SPF (4–5 h), 9 GF (0–1 h), 3 GF (1–2 h), 4 GF (2–3 h), 6 GF (3–4 h), 4 GF (4–5 h) mice (data from Fig. 1m, n). x, n = 9 VEH (0–100 m), 17 VEH (100–200 m), 22 ABX (0–100 m), 4 ABX (100–200 m) mice (data from Fig. 1o). y, Social activity in SPF, GF and exGF test mice (subject), in the context of SPF novel mice. SPF vs GF ****P < 0.0001, SPF vs exGF ***P = 0.0001, GF vs exGF ****P < 0.0001. n = 20 SPF, 19 GF, 8 exGF mice (SPF and GF data from Fig. 1b, c). z, Serum corticosterone levels after RSI in exGF mice. SPF vs GF **P = 0.0012, GF vs exGF *P = 0.0467. n = 13 SPF, 18 GF, 8 exGF mice (SPF and GF data from Fig. 1b, c). Data shown as individual points with mean ± s.e.m. Data analysed by two-tailed unpaired t-test (a, b, dg, k, n, p, s, t); one-tailed paired t-test (o, q); one-way ANOVA (i, j, m, y, z), repeated measures (h) with Bonferroni’s multiple comparison post hoc test; two-way ANOVA (c, l, vx), repeated measures (u) with Bonferroni’s multiple comparison post hoc test. *P < 0.05, **P < 0.01, ***P < 0.001, ****P < 0.0001, ND: no difference. For more statistical details, see Supplementary Information.
Extended Data Fig. 2 |
Extended Data Fig. 2 |. The depletion of microbiota in GF and/or ABX-treated mice was demonstrated by absolute bacteria quantification, plating, microbiome analysis and profiling.
a, Bacterial DNA was detected using Femto DNA quantification methods. Bacterial DNA was completely absent from faecal samples collected from GF mice housed in closed IVC cages for one week (**P = 0.0038) and from adult mice treated with ABX for three weeks (**P = 0.0083). n = 4 mice per group. b, c, Colony-forming units (CFU) quantified by scoring colonies from faecal samples plated on brucella blood agar following three weeks ABX treatment. b, Aerobes were depleted at the first week of ABX treatment. VEH vs ABX: 1 w **P = 0.001, 2 w ***P = 0.0001, 3 w ****P < 0.0001. c, Anaerobes were completely depleted by the third week of ABX treatment. VEH vs ABX: 1 w P = 0.2237, 2 w *P = 0.0179, 3 w ****P < 0.0001. n = 4 mice per group. d, Representative images of caecum enlargement and brucella blood agar plating of caecal contents from VEH and ABX-treated mice. Plating of caecal contents showed that culturable bacteria were completely absent after 3 weeks of ABX treatment. e, f, Box plots of number of total reads (e) and total reads that matched sequences in 16S reference database (f) in VEH- and AVNM-treated mice, compared to negative controls. n = 8 VEH, 8 AVNM, 3 negative control. g, h, Box plots of alpha diversity as measured by number of observed ASVs (g) and Faith’s phylogenetic diversity (h) in VEH- and AVNM-treated mice, compared to negative controls. n = 8 VEH, 8 AVNM, 3 negative control. g, VEH vs AVNM ***P = 0.00093097; VEH vs negative control *P = 0.03169856. (h) VEH vs AVNM **P = 0.00113133; VEH vs negative control *P = 0.01430588. i, j, Principle coordinate analysis plots based on unweighted (i) and weighted (j) UniFrac distances between faecal samples from VEH- and AVNM-treated mice, compared to negative controls (rarified to 728 reads per sample). n = 8 VEH, 7 AVNM, 3 negative control. i, VEH vs AVNM ***P = 0.0002; VEH vs negative control **P = 0.0071. j, VEH vs AVNM ***P = 0.0005; VEH vs negative control **P = 0.0055. k, Relative abundance of major phyla in VEH- and AVNM-treated mice, compared to negative controls. n = 8 VEH, 7 AVNM, 3 negative control. ik, One AVNM mouse was found to be contaminated and excluded for the generation of the graphs. Data shown as individual points with mean ± s.e.m. (ac); box plots (eh) show median (centre line) and interquartile range (IQR) (box limits); whiskers show either 1.5 × IQR of the lower and upper quartiles or range. Data analysed by two-tailed unpaired t-test (a); two-way ANOVA, repeated measures (b, c) with Bonferroni’s multiple comparison post hoc test; Kruskal–Wallis test (g, h); permutational multivariate analysis of variance (PERMANOVA) (i, j). *P < 0.05, **P < 0.01, ***P < 0.001, ****P < 0.0001, ND: no difference. For more statistical details, see Supplementary Information.
Extended Data Fig. 3 |
Extended Data Fig. 3 |. Anxiety-like behaviour, locomotion, water intake, and olfactory investigative behaviour in GF and/or ABX-treated mice.
ah, Anxiety-like behaviour and locomotion were tested using the open-field test, light–dark box and elevated plus maze in SPF, GF, VEH-treated and ABX-treated mice. a, Locomotor activity measured in open-field test in GF mice showed no difference in distance travelled in open-field chamber. P = 0.8371. n = 9 SPF, 8 GF mice per group. b, Centre zone duration in open-field test in GF mice. GF mice spent longer in the centre of the open-field chamber than SPF mice. *P = 0.0108. n = 9 SPF, 8 GF mice per group. c, Light chamber duration measured in light–dark box for GF mice. GF mice spent longer in the light chamber than SPF mice. *P = 0.0442. n = 9 mice per group. d, Open arm duration measured in elevated plus maze for GF mice. GF mice spent longer in the open arm than SPF mice. *P = 0.0261. n = 9 mice per group. e, Locomotor activity measured in open-field test for ABX mice showed no difference in distance travelled in the open-field chamber. P = 0.3606. n = 10 mice per group. f, Duration in the centre zone measured in open-field test shows no difference in centre duration for ABX mice. P = 0.3372. n = 10 mice per group. g, Duration in the light chamber measured in light–dark box shows no difference in light chamber duration for ABX mice. P = 0.9381. n = 10 mice per group. h, Duration spent in open arm measured in elevated plus maze shows no difference in open arm duration for ABX mice. P = 0.8743. n = 10 mice per group. i, ABX mice show no change in the distance travelled in the open-field chamber. VEH vs ABX P = 0.6223. n = 15 mice per group. j, Water intake was monitored in GF mice housed in IVC cages for one week. GF mice showed no difference in water consumed. SPF vs GF P = 0.7591. n = 5 mice per group. k, The olfactory habituation/dishabituation test involves exposure to a series of odours: baseline (water), volatile non-social odours (almond and banana extracts), and social odours (C57BL/6 and BTBR cages). Time-course of sniffing time shows no difference for GF mice when exposed to water, almond extract, or banana extract. GF mice displayed increased sniffing time when exposed to the social odour from C57BL/6J mice, but not from BTBR mice. SPF vs GF: B6 Cage(1–1) *P = 0.0172, B6 Cage(1–2) *P = 0.0402. n = 10 SPF, 11 GF mice per group. l, Percentage investigation time in response to the first exposure to social odour was measured in the olfactory habituation/dishabituation test in SPF and GF mice. The percentage of investigation time decreased at the second and third exposures to the same social odour in both SPF and GF mice. The investigation time decreased when switched to BTBR odour in GF mice. SPF: B6 Cage 1–1 vs 1–2 **P = 0.0020, B6 Cage 1–1 vs 1–3 ***P = 0.0002, BTBR Cage 1–1 vs 1–2 ***P = 0.0002, BTBR Cage 1–1 vs 1–3 ****P < 0.0001; GF: B6 Cage 1–1 vs 1–2 *P = 0.0120, B6 Cage 1–1 vs 1–3 *P = 0.0397, BTBR Cage 1–1 vs 1–2 ****P < 0.0001, BTBR Cage 1–1 vs 1–3 ****P < 0.0001, B6 Cage 1–1 vs BTBR Cage 1–1 *P = 0.0143. n = 10 SPF, 11 GF mice per group. Data shown as individual points with mean ± s.e.m. Data analysed by two-tailed unpaired t-test (ah) and two-way ANOVA, repeated measures (il) with Bonferroni’s multiple comparison post hoc test. *P < 0.05, **P < 0.01, ***P < 0.001, ****P < 0.0001, ND: no difference. For more statistical details, see Supplementary Information.
Extended Data Fig. 4 |
Extended Data Fig. 4 |. IEG expression in the brains of GF mice and stress-related gene expression in the hippocampus and hypothalamus of ABX-treated mice.
ad, IEG expression was measured in GF mice taken from the isolator and temporarily mixed with other mice from different cages. SPF mice were sampled and handled following the same procedure. Mice were immediately killed and the brains were collected and analysed. Brains were dissected into hippocampus (a), hypothalamus (b), midbrain (c), and brainstem (d). IEG expression in each region was analysed by qRT–PCR. n = 6 mice per group. a, In the hippocampus, Arc (*P = 0.024), Fos (**P = 0.0036), cJun (*P = 0.0152), JunB (**P = 0.0077), Egr1 (P = 0.0532), Egr2 (*P = 0.0328), Gadd45b (***P = 0.0005), Gadd45g (*P = 0.0435), and Bdnf (*P = 0.0142) were upregulated in GF mice. Map2 P = 0.3874. n = 6 mice per group. b, In the hypothalamus, Arc (*P = 0.0108), Fos (***P = 0.0001), and Egr1 (**P = 0.0022) were upregulated in GF mice, with no change in Map2 gene expression. cJun P = 0.3859, JunB P = 0.106, Egr2 P = 0.0864, Gadd45b P = 0.8544, Gadd45g P = 0.4398, Bdnf P = 0.1517, Map2 P = 0.8255. n = 6 mice per group. c, No changes in IEG expression were found in the midbrains of GF mice. Arc P = 0.4733, Fos P = 0.455, cJun P = 0.6153, JunB P = 0.6154, Egr1 P = 0.4102, Egr2 P = 0.283, Gadd45b P = 0.424, Gadd45g P = 0.0852, Bdnf P = 0.9779, Map2 P = 0.4018. n = 3 mice per group. d, In the brainstem, cJun (*P = 0.0479), JunB (*P = 0.0244), Egr1 (P = 0.0502), Gadd45b (**P = 0.0022), Gadd45g (**P = 0.0075), and Bdnf (*P = 0.0127) were downregulated in GF mice. No change in Map2 was detected in all four brain regions in GF mice. Arc P = 0.8297, Fos P = 0.5208, Egr2 P = 0.5391, Map2 P = 0.1266. n = 6 mice per group. e, Timeline schematic of ABX treatment, single housing, behavioural manipulations, and tissue sampling. Tissues collected include hippocampal dentate gyrus (DG; red), hippocampal Ammon’s horn, and hypothalamus. f, Gene expression analysis in Ammon’s horn and DG was performed by qRT–PCR. Mgr1b is enriched in Ammon’s horn. Dsp and Tdo2 are specific to the DG. Analysis confirmed the specific dissection of the hippocampus into Ammon’s horn and DG. All ****P < 0.0001. n = 24 mice per group. g, h, Gene expression of glucocorticoid receptor (Nr3c1) and mineralocorticoid receptor (Nr3c2) in the hippocampus analysed by qRT–PCR. There was no difference between vehicle and ABX mice in DG (g, Nr3c1 P = 0.1016, Nr3c2 P = 0.8947) or Ammon’s horn (h, Nr3c1 P = 0.1379, Nr3c2 P = 0.9764) after RSI. n = 6 mice per group. i, Expression of stress-related genes (Crhr1 P = 0.4032, Crhr2 P = 0.6778, Ucn P = 0.2477, Ucn2 P = 0.0636, and Ucn3 P = 0.0797) and neuropeptide genes (Avp P = 0.9861 and Oxt P = 0.1445) were unchanged after reciprocal social interaction in ABX mice. n = 5 vehicle, 6 ABX mice per group. j, k, Expression of Nr3c1 and Nr3c2 does not differ between vehicle and ABX mice in DG (j, Nr3c1 P = 0.6206, Nr3c2 P = 0.5075) or Ammon’s horn (k, Nr3c1 P = 0.4873, Nr3c2 P = 0.0931) after novel cage exposure. n = 6 mice per group. l, Ucn gene expression is upregulated after novel cage exposure in ABX mice (*P = 0.013). Other stress-related genes (Crh1 P = 0.649, Crhr2 P = 0.3875, Ucn2 P = 0.1409, and Ucn3 P = 0.511) and neuropeptide genes (Avp P = 0.5809 and Oxt P = 0.8216) were unchanged. n = 6 mice per group. Data shown as individual points with mean ± s.e.m. Data analysed by two-tailed unpaired t-test (ad, fl). *P < 0.05, **P < 0.01, ***P < 0.001, ****P < 0.0001, ND: no difference. For more statistical details, see Supplementary Information.
Extended Data Fig. 5 |
Extended Data Fig. 5 |. Expression of oxytocin, vasopressin, and their receptors in the hypothalamus of GF mice and Fluorogold labelling of neurons in the PVN and median eminence (ME) of GF and/or ABX-treated mice.
a, b, Representative images (from 8 SPF and 6 GF mice) of vasopressin (a, AVP; red) and oxytocin (b, OXT; green) staining in brain sections after reciprocal social interaction. Scale bars, 100 μm. c, d, Quantification of AVP (c) and OXT (d) distribution in PVN of SPF and GF mice. No difference in the number of AVP neurons in PVN was detected in GF mice (P = 0.3869). OXT-positive cells were lower in GF mice (**P = 0.0049). n = 8 SPF, 6 GF mice per group. e, Gene expression of AVP, OXT, and their receptors analysed by qRT–PCR. No difference was found between naive SPF and GF mice. Avp P = 0.3992, Avpr1a P = 0.6361, Avpr1b P = 0.5471, Avpr2 P = 0.2168, Oxt P = 0.9281, Oxtr P = 0.3252. n = 4 mice per group. fi, GF and SPF mice were intraperitoneally injected with Fluorogold and killed six days later. PVN and ME were retrogradely labelled. f, Representative Fluorogold retrograde tracing and immunohistochemistry images of the PVN. Green, anti-Fluorescent Gold (Fluorogold); magenta: anti-NeuN. n = 4 mice per group. g, Number of Fluorogold+ cells in the PVN shows no difference between GF and SPF mice. SPF vs GF P = 0.2362. n = 4 mice per group. h, Representative Fluorogold retrograde tracing and immunohistochemistry images of the ME. Green: anti-Fluorescent Gold (Fluorogold); magenta: anti-NeuN. n = 3 mice per group. i, Integrated density of Fluorogold in the ME shows no difference between GF and SPF mice. P = 0.3723. n = 3 mice per group. j, k, ABX- or vehicle-treated Crh-ires-Cre;Ai14D mice were intraperitoneally injected with Fluorogold and killed six days later. PVN neurons were retrogradely labelled with Fluorogold. j, Representative Fluorogold retrograde tracing and immunohistochemistry images of the PVN. Green: anti-Fluorescent Gold (Fluorogold); red: corticotropin-releasing hormone (CRH); magenta: anti-NeuN. n = 4 mice per group. k, Number of Fluorogold+ cells in the PVN shows no difference between ABX and vehicle mice. P = 0.4545. n = 4 mice per group. Scale bars, 200 μm. Data analysed by two-tailed unpaired t-test (ce, i, k) and two-way ANOVA, repeated measures (g) with Bonferroni’s multiple comparison post hoc test. **P < 0.01; ND: no difference. For more statistical details, see Supplementary Information.
Extended Data Fig. 6 |
Extended Data Fig. 6 |. Perturbation of glucocorticoid and vagus-dependent signalling in GF and/or ABX-treated mice.
a, b, Social activity was tested using the RSI paradigm in VEH-sham, ABX-sham, and ABX-ADX mice injected with corticosterone (subject), in the context of SPF novel mice. Acute administration of corticosterone produced no difference between groups in social activity (a, P = 0.5697) or non-social activity (b, P = 0.6781). n = 5 VEH-sham, 7 ABX-sham, and 4 ABX-ADX mice per group (subject only). c, d, Non-social activity was recorded using the RSI paradigm in SPF and GF (c), VEH-sham, ABX-sham, and ABX-ADX mice (d) (subject), in the context of SPF novel mice. c, Non-social activity was analysed during the social interaction test in SPF and GF mice injected with metyrapone. Equally decreased non-social activity was detected in GF and SPF mice injected with metyrapone. SPF-CMC vs SPF-MET *P = 0.041, GF-CMC vs GF-MET *P = 0.0274. n = 5 SPF-CMC, 5 GF-CMC, 6 SPF-MET, 5 GF-MET mice per group (subject only). d, Non-social activity was analysed during the social interaction test in VEH-sham, ABX-sham, and ABX-ADX test mice injected with CMC, RU-486, or metyrapone (subject), in the context of SPF novel mice. Lower non-social activity was detected in ABX-ADX animals injected with RU-486 and ABX animals injected with metyrapone. First CMC: VEH-sham vs ABX-sham **P = 0.0034; RU-486: VEH-sham vs ABX-ADX *P = 0.0215; MET: VEH-sham vs ABX-sham ***P = 0.0006, VEH-sham vs ABX-ADX *P = 0.0145. n = 11 mice for VEH-sham, 18 ABX-sham and 11 ABX-ADX sham mice per group (subject only). e, The completeness of subdiaphragmatic vagotomy (SDV) was validated by fasting-induced food consumption for 2 h following intraperitoneal CCK-8 injection. Food intake was normalized by body weight. SDV mice showed increased food intake compared to sham mice. SPF naive control vs SPF naive CCK-8 **P = 0.0038, ABX-sham CCK-8 vs ABX-SDV CCK-8 **P = 0.0084. n = 6 control saline, 6 control CCK-8, 7 ABX-sham, and 4 ABX-SDV mice per group. f, Measurement of serum corticosterone concentrations showed no difference after social interaction in ABX-SDV mice, compared to ABX-sham mice. P = 0.8436. n = 9 ABX-sham, 8 ABX-SDV mice per group. g, Quantification of c-Fos+ cells in anterodorsal bed nucleus of stria terminalis (adBNST) and dentate gyrus (DG) of ABX-sham and ABX-SDV mice. Increased c-Fos+ cells were detected in adBNST (left, *P = 0.0451), but not in DG (right, P = 0.2577), after social interaction in ABX-SDV mice, compared to ABX-sham mice. n = 5 sham, 5 SDV mice per group. Data shown as individual points with mean ± s.e.m. Data analysed by one-way ANOVA with Bonferroni’s multiple comparison post hoc test (a, b); two-way ANOVA (c), repeated measures with mixed effect (d), with Bonferroni’s multiple comparison post hoc test; two-tailed unpaired t-test (eg). *P < 0.05, **P < 0.01, ***P < 0.001, ****P < 0.0001, ND: no difference. For more statistical details, see Supplementary Information.
Extended Data Fig. 7 |
Extended Data Fig. 7 |. Knockout of glucocorticoid receptors in specific brain regions in ABX-treated and SPF mice.
a, d, g Diagrams of virus injection into the DG (Nr3c1ΔDG; relevant to Fig. 2h, i), BNST (Nr3c1ΔBNST; relevant to Fig. 2j, k) and hypothalamus (Nr3c1ΔHYPO; relevant to Fig. 2l, m). b, e, h, Non-social activity recorded using the RSI paradigm in ABX mice (subject), in the context of SPF novel mice. b, No difference in non-social activity was detected in ABX Nr3c1ΔDG mice. Control vs Nr3c1ΔDG P = 0.1191. n = 7 mice per group (subject only). e, Minimal difference in non-social activity was detected in ABX Nr3c1ΔBNST mice. A decrease in non-social activity was detected only at the second CMC injection (*P = 0.0363). n = 7 mice per group (subject only). h, No difference in non-social activity was detected in Nr3c1ΔHYPO mice. Control vs Nr3c1ΔHYPO P = 0.0652. n = 6 control, 5 Nr3c1HYPO mice per group (subject only). c, Quantification of c-Fos+ cells in various brain regions of ABX Nr3c1ΔDG and control mice. Decreased c-Fos+ cells were detected in the PVN and adBNST after social interaction in ABX Nr3c1ΔDG mice compared to control mice. There was no change in c-Fos expression in the DG of ABX Nr3c1ΔDG mice. PVN ****P < 0.0001, adBNST **P = 0.0022, DG P = 0.9714. n = 7 mice per group. f, Quantification of c-Fos+ cells in various brain regions of ABX Nr3c1ΔBNST and control mice. Decreased c-Fos+ cells were detected in the PVN and adBNST after social interaction in ABX Nr3c1ΔBNST mice compared to control mice. There was no change in c-Fos staining in the DG. PVN ****P < 0.0001, adBNST ***P = 0.0002, DG P = 0.4187. n = 7 mice per group. i, Quantification of c-Fos+ cells in various brain regions of ABX Nr3c1ΔHYPO and control mice. Increased c-Fos+ cells were detected in DG and adBNST after social interaction in ABX Nr3c1ΔHYPO mice compared to control mice. There was no change in c-Fos expression in the PVN. PVN P = 0.1163, adBNST P = 0.0688, DG *P = 0.0389. n = 6 control, 5 Nr3c1ΔHYPO mice per group. j, Neuronal activity was measured by c-Fos staining of various brain sections. Representative images of c-Fos staining after social interaction in PVN, adBNST, and DG in Nr3c1ΔDG (from 7 animals each group), Nr3c1ΔBNST (from 7 animals each group) and Nr3c1ΔHYPO mice (from 6 control and 5 Nr3c1ΔHYPO animals), and their corresponding control groups. Scale bars, 100 μm. k, l, Social activity (k) and non-social activity (l) were tested using the RSI paradigm in SPF test mice (subject), in the context of SPF novel mice. SPF Nr3c1ΔDG mice did not display altered social activity (P = 0.4323) or non-social activity (P = 0.8234) compared to control mice with vehicle injection. n = 5 mice per group (subject only). m, Serum corticosterone concentrations show no change after social interaction in SPF Nr3c1ΔDG mice. P = 0.9935. n = 5 mice per group. n, o, Social activity (n) and non-social activity (o) were tested using the RSI paradigm in SPF test mice (subject) in the context of SPF novel mice. SPF Nr3c1ΔBNST mice showed reduced social activity compared to control mice with vehicle injection (*P = 0.0473). No change was observed in non-social activity between SPF control and Nr3c1ΔBNST mice (P = 0.4742). n = 5 mice per group (subject only). p, Serum corticosterone concentrations show no change after social interaction in SPF Nr3c1ΔBNST mice. P = 0.9312. n = 5 mice per group. q, r, Social activity (q) and non-social activity (r) were tested using the RSI paradigm in SPF test mice (subject), in the context of SPF novel mice. SPF Nr3c1HYPO mice did not display altered social activity (P = 0.1823) or non-social activity (P = 0.2339) compared to control mice with vehicle injection. n = 5 mice per group (subject only). s, Serum corticosterone concentrations show no change after social interaction in SPF Nr3c1ΔHYPO mice. P = 0.0701. n = 5 mice per group. Data shown as individual points with mean ± s.e.m. Data analysed by two-way ANOVA, repeated measures (b, e) with mixed effect (h) with Bonferroni’s multiple comparison post hoc test; two-tailed unpaired t-test (c, f, i, ks). *P < 0.05, **P < 0.01, ***P < 0.001, ****P < 0.0001, ND: no difference. For more statistical details, see Supplementary Information.
Extended Data Fig. 8 |
Extended Data Fig. 8 |. Manipulations of CRH neurons and glucocorticoidsensing neurons in ABX-treated and SPF mice.
a, Diagram of AAV-hSyn-DIO-hM4Di-mCherry (hM4Di) or AAV-hSyn-DIO-mCherry (mCherry) virus injection into the PVN of Crh-ires-Cre mice. b, Non-social activity in ABX-treated mCherry and hM4Di mice, with and without CNO (subject). hM4Di effect P = 0.4909. n = 10 mCherry, 11 hM4Di mice. c, d, Neuronal activity was measured by c-Fos staining of brain sections. Representative images (from 10 mCherry and 11 hM4Di mice) of c-Fos, mCherry and DAPI staining in the adBNST (c) and DG (d) in hM4Di and mCherry mice upon CNO injection after social interaction. Scale bars, 100 μm. e, f, Quantification of c-Fos+ cells in various brain regions of ABX hM4Di and mCherry mice. There was no change in c-Fos in the adBNST (e, P = 0.301) or DG (f, P = 0.5745) of ABX hM4Di mice upon CNO injection. n = 10 mCherry, 11 hM4Di mice per group. g, Top, timeline scheme of stereotaxic surgery, ABX treatment, drug administration, social behaviour, and sample collection. Crh-ires-Cre mice were stereotaxically injected with viruses into the BNST one week before ABX treatment at the age of 7–8 weeks. After three weeks of ABX treatment, social behaviour was tested in VEH- or CNO-injected mice. Bottom, diagram of virus injection into the BNST of Crh-ires-Cre mice to deliver AAV-hSyn-DIO-hM4Di-mCherry (hM4Di) or AAV-hSyn-DIO-mCherry (mCherry). h, Social activity was tested using the RSI paradigm in ABX test mice (subject), in the context of SPF novel mice. With VEH and CNO injection, there was no difference in social activity between mice injected with hM4Di and mice injected with mCherry. mCherry vs hM4Di P = 0.4722. n = 10 mCherry, 9 hM4Di mice per group (subject only). i, Non-social activity was recorded using the RSI paradigm in ABX mice (subject), in the context of SPF novel mice. With VEH and CNO injection, there was no difference in non-social activity between mice injected with hM4Di and mice injected with mCherry at the BNST. mCherry vs hM4Di P = 0.1921. n = 10 mCherry, 9 hM4Di mice per group (subject only). j, Serum corticosterone concentrations show no change after social interaction in ABX hM4Di mice when injected with CNO. P = 0.2063. n = 8 mice per group. k, l, Quantification of c-Fos+ cells in various brain regions of ABX hM4Di and mCherry mice. No change in c-Fos+ cells was detected in the PVN (k, P = 0.4792) or adBNST (l, P = 0.3054) after social interaction in ABX hM4Di mice with CNO injection, compared to mCherry mice. n = 10 mCherry, 8 hM4Di mice per group. m, Neuronal activity was measured by c-Fos staining of brain sections. Representative images (from 10 mCherry, 8 hM4Di mice) of c-Fos, mCherry and DAPI staining in the PVN and adBNST of hM4Di and mCherry mice with CNO injection after social interaction. Scale bars, 100 μm. am, All mice received antibiotics. n, Diagram of AAV-hSyn-DIO-hM3Dq-mCherry (hM3Dq) or AAV-hSyn-DIO-mCherry (mCherry) injection into the PVN. o, Relevant to Fig. 3h–j. Non-social activity was recorded using the RSI paradigm in SPF mice (subject), in the context of SPF novel mice. With VEH injection, there was no difference in non-social activity between mice injected with AAV-hSyn-DIO-hM3Dq-mCherry (hM3Dq) and mice injected with AAV-hSyn-DIO-mCherry (mCherry). Injection of CNO increased non-social activity in hM3Dq mice but not mCherry mice. SPF mCherry CNO vs SPF hM3Dq CNO ****P < 0.0001. n = 10 mCherry, 11 hM3Dq mice per group (subject only). p, Relevant to Fig. 3k–m. Diagram of guide cannula implantation into the PVN to deliver VEH or CRF. q, Non-social activity was recorded using the RSI paradigm in SPF mice (subject), in the context of SPF novel mice. Injection of CRF (low) increased non-social activity, whereas injection of CRF (high) did not alter non-social activity compared to VEH mice. VEH vs CRF(low) *P = 0.0427, CRF(low) vs CRF(high) *P = 0.0134. n = 16 VEH, 7 CRF (low), 9 CRF (high) mice per group (subject only). r, s, Relevant to Fig. 3n–p. Diagram of guide cannula implantation into the DG (r) or BNST (s) to deliver VEH, CORT, or DEX. t, Relevant to Fig. 3k–m. Correct guide cannula implantation into the PVN was validated by histological sectioning and DAPI staining for visualization of the PVN to confirm CRF injection. The customized guide cannula set includes guide cannula, injector, dummy, and cap (left). The guide cannula was implanted 0.5 mm above the PVN. The tip of the guide cannula track can be visualized in the thalamus region in each implanted mouse. The injector was designed to reach 0.5 mm below the tip of the guide cannula. As the injector was made of 33G fine needle, the needle track of the injector was not visible in the brain slice and is depicted in the image (middle). Enlarged image to show the guide cannula track and the depicted needle track above the PVN (right). Scale bars, 500 μm. Data shown as individual points with mean ± s.e.m. Data analysed by two-way ANOVA, repeated measures (b, h, i, o) with Bonferroni’s multiple comparison post hoc test; two-tailed unpaired (e, f, k, l) or paired t-test (j); one-way ANOVA with Bonferroni’s multiple comparison post hoc test (q). *P < 0.05, ****P < 0.0001, ND: no difference. For more statistical details, see Supplementary Information.
Extended Data Fig. 9 |
Extended Data Fig. 9 |. Retrograde neural tracing of the PVN and adBNST of GF and ABX-treated mice.
a, CTB-488 was stereotaxically injected into the PVN of GF and SPF C57BL/6J mice. The brains were removed seven days after injection. CTB-488 retrograde tracing was visualized by confocal imaging of brain sections counterstained with an antibody against NeuN. GF mice were treated with ABX after surgery. b, Quantification of CTB-488+ cells in various brain regions of SPF and GF mice. adBNST (P = 0.229); LS (P = 0.1373); MeA (P = 0.358). No difference in CTB-488 retrograde-labelled cells was detected between SPF and GF mice. n = 4 mice per group. c, Representative images (from 4 animals each group) of CTB-488 (green) labelling and NeuN (magenta) staining in the adBNST, MeA, and LS of SPF and GF mice. Scale bars, 100 μm. d, CTB-488 and Fluorogold were stereotaxically injected into the PVN and adBNST, respectively, in vehicle and ABX Crh-ires-Cre;Ai14D mice. Brains were removed 7 days after injection. Retrograde tracers were visualized by confocal imaging of brain sections counterstained with antibodies. e, Quantification of CTB-488+ cells in various brain regions of vehicle and ABX mice. No difference in CTB-488 retrograde-labelled cells was detected between vehicle and ABX mice. adBNST P = 0.2064, LS P = 0.4332, MeA P = 0.4366. n = 4 mice per group. f, Quantification of Fluorogold (FG)+ cells in various brain regions of vehicle and ABX mice. No difference in Fluorogold retrograde-labelled cells was detected between vehicle and ABX mice. adBNST P = 0.8922, LS P = 0.8715, MeA P = 0.7284. n = 4 mice per group. g, Representative images (from 4 animals each group) of CTB-488 (green) labelling, Fluorogold (blue) staining, and CRH+ tdTomato (red) cells in the adBNST, MeA, LS, and PVN of vehicle and ABX mice. Scale bars, 100 μm. Data shown as individual points with mean ± s.e.m. Data analysed by two-tailed unpaired t-test (b, e, f). ND: no difference. For more statistical details, see Supplementary Information.
Extended Data Fig. 10 |
Extended Data Fig. 10 |. Microbiome analysis of AVNM and AVM mice, and identification and effects of E. faecalis.
a, Quantification of c-Fos+ cells in PVN of AVNM and AVM mice. Decreased c-Fos+ cells are detected in PVN after social interaction in AVM mice compared to AVNM mice. ***P = 0.0003. n = 8 mice per group. b, Total microbial loads of faecal pellets from GF mice receiving faecal microbial transplants from AVM- or AVNM-treated mice. All measurements performed with digital PCR and normalized to faecal pellet weights. n = 11 GF-AVM, 9 GF-AVNM mice per group. c, Correlation between the log10abundance of Enterococcus as determined by taxon-specific dPCR and 16S rRNA gene amplicon sequencing with dPCR anchoring (relative abundance of Enterococcus measured by sequencing × total 16S rRNA gene copies measured by dPCR). n = 8 mice per group. d, Percentage abundance of taxa from faecal pellets of GF mice that received faecal microbial transplants from AVM- or AVNM-treated mice. n = 9 GF-AVNM, 11 GF-AVM mice per group. e, Social activity shown in Fig. 4i in vehicle (VEH) and ABX mice (subject) in the first RSI test. *P = 0.0321. n = 8 VEH, 15 ABX mice (data from Fig. 4i). f, Enterococcus faecalis-specific 16S rRNA gene copy number in faecal pellets from ABX mice colonized with E.f. for 3 weeks and VEH or ABX mice gavaged with control buffer. All measurements performed with qPCR and normalized to faecal bacteria 16S rRNA gene. High E.f. values in ABX + E.f. compared to VEH + Ctrl mice probably reflect reduced competition by other bacteria following antibiotic treatment. The dashed line represents E.f. expression in VEH + Ctrl mice. VEH + Ctrl vs ABX + E.f. **P = 0.002, ABX + Ctrl vs ABX + E.f. **P = 0.0015. n = 3 mice per group, subset selected from Extended Data Fig. 10g. g, Social activity (relevant to Fig. 4i) following three weeks of E. faecalis colonization using the RSI paradigm in VEH + Ctrl, ABX + Ctrl, and ABX + E.f. mice (subject). ABX + Ctrl vs ABX + E.f. *P = 0.0336. n = 8 VEH + Ctrl, 8 ABX + Ctrl, 7 ABX + E.f. mice. Note, ABX + Ctrl mice are half the same group used in i, and therefore show a baseline reduction in social activity (data from Fig. 4i). h, Social activity was tested using the RSI paradigm in SPF and GF mice and in GF mice colonized with E.f. at the perinatal stage (subject), in the context of SPF novel mice. GF mice colonized with E.f. display increased social activity, compared to GF control mice. SPF vs GF *P = 0.028, GF vs GF + E.f. **P = 0.0066. n = 6 SPF, 11 GF, 10 GF + E.f. mice per group (subject only). ik, Quantification of c-Fos+ cells in various brain regions of GF and GF + E.f. mice. Decreased c-Fos+ cells were detected in PVN (i, *P = 0.0167), adBNST (j, *P = 0.0467), and DG (k, **P = 0.0076) after social interaction in GF + E.f. mice compared to GF mice. n = 9 mice per group for PVN; n = 10 mice per group for DG; n = 10 GF, 9 GF + E.f. mice per group for adBNST. l, Serum corticosterone concentrations show no change after social interaction in GF + E.f. mice compared to GF mice. SPF vs GF P = 0.959, SPF vs GF + E.f. P = 0.0585, GF vs GF + E.f. P = 0.2642. n = 6 SPF, 11 GF, 10 GF + E.f. mice per group. Data shown as individual points with mean ± s.e.m. Data analysed by two-tailed unpaired t-test (a, e, ik); one-way ANOVA with Bonferroni’s multiple comparison post hoc test (fh, l). *P < 0.05, **P < 0.01, ***P < 0.001, ND: no difference. For more statistical details, see Supplementary Information.
Fig. 1 |
Fig. 1 |. The gut microbiome regulates social behaviour and serum corticosterone levels in mice.
a, Timeline schematic of studies using GF mice and ABX-treated SPF mice. Iso, isolation; RSI, reciprocal social interaction. b, c, Social activity of SPF and GF test mice (subject), in the context of SPF (b) and GF (c) novel mice. d, Social activity of adult SPF mice treated with ABX or vehicle. e, i, Representative images of c-Fos staining in brain sections from SPF and GF mice (e) and vehicle (VEH)- or ABX-treated SPF mice (i). adBNST, anterodorsal BNST; LV, lateral ventricle; 3V, third ventricle. Scale bars, 200 μm. fh, jl, Quantification of c-Fos+ cells in GF (fh) and ABX-treated (jl) mice. mo, Serum corticosterone levels in GF (m, n) and ABX-treated (o) mice following social interactions as shown. Data shown as individual points with mean ± s.e.m. from at least two independent trials. n = a, 20 SPF, 19 GF; b, n, 8; c, 26; fh, 6; jl, 5; m, 13 SPF, 18 GF; o, 30 mice per group. Two-tailed unpaired t-test (bd, fh, jo).
Fig. 2 |
Fig. 2 |. Microbiome modulation of glucocorticoid signalling alters social behaviour.
a, Timeline schematic for bf of ABX, ADX and SDV and treatment with CMC, MET, RU-486 and CCK-8 (cholecystokinin 8). b, Serum corticosterone in MET-injected GF mice. c, Social activity in MET-injected GF mice. d, Serum corticosterone in ABX-treated ADX mice. e, Social activity in ABX-treated ADX mice injected with RU-486 or MET. s, sham. f, Social activity in ABX-treated SDV mice. g, Timeline scheme for hm. ICI, intracerebral injection. h, j, l, Social activity in ABX-treated Nr3c1ΔDG (h), Nr3c1ΔBNST (j) and Nr3c1ΔHYPO (l) mice. i, k, m, Serum corticosterone in ABX-treated Nr3c1ΔDG (i), Nr3c1ΔBNST (k) and Nr3c1ΔHYPO (m) mice. Data shown as individual points with mean ± s.e.m. from at least two independent trials. n = b, c, 5 SPF-CMC, 5 GF-CMC, 6 SPF-MET, 5 GF-MET; d, e, 11 VEH-sham, 18 ABX-sham, 11 ABX-ADX; f, 7 VEH-sham, 9 ABX-sham, 6 ABX-SDV; hk, 7; l, 7 control, 5 Nr3c1ΔHYPO; m, 6 control, 5 Nr3c1ΔHYPO mice per group. Two-way ANOVA (b, c) with repeated measures (h, j), mixed-effects (e, l), one-way ANOVA (d, f) with Bonferroni multiple comparison test; two-tailed unpaired t-test (i, k, m).
Fig. 3 |
Fig. 3 |. CRH neurons and glucocorticoid receptors affect social behaviour.
a, Crh expression in hypothalamus of ABX mice exposed to novel cage or novel mouse (social). b, Timeline schematic for cg (mice received antibiotics). ROB, retro-orbital blood collection. c, Social activity in ABX Crh-ires-Cre mice injected in the PVN with AAV-hSyn-DIO-mCherry (mCherry) or AAV-hSyn-DIO-hM4Di-mCherry (hM4Di). d, Serum corticosterone in ABX- and CNO-treated mCherry and hM4Di mice. e, f, Representative images (from 10 mCherry, 11 hM4Di mice) of c-Fos, mCherry and DAPI staining (scale bars, 100 μm). g, Quantification of c-Fos+ cells in the PVN of ABX- and CNO-treated hM4Di and mCherry mice. h, Timeline schematic for i, j. i, Serum corticosterone in Crh-ires-Cre SPF mice injected in PVN with mCherry or AAV-hSyn-DIO-hM3Dq-mCherry (hM3Dq) and treated with CNO. j, Social activity in SPF mCherry or hM3Dq mice treated with CNO. k, n, Timeline schematics for lm, op. CRF, corticotropin releasing factor peptide; CORT, corticosterone; DEX, dexamethasone. l, m, Social activity in PVN CRF-injected SPF test mice. o, p, Social activity in CORT- or DEX-injected SPF test mice. Data shown as individual points with mean ± s.e.m. from at least two independent trials. n = a, 6 VEH, 6 ABX (novel cage), 5 VEH, 6 ABX (social exposure); c, g, 10 mCherry, 11 hM4Di; d, 9 mCherry, 10 hM4Di; i, j, 10 mCherry, 11 hM3Dq; l, m, 9 CRFhigh, 7 CRFlow; o, 7; p, 8 VEH, 8 CORT, 6 DEX mice per group. Two-way ANOVA (a) with repeated measures (c, j), one-way ANOVA with repeated measures (o) with mixed effects (p) with Bonferroni multiple comparison test; two-tailed paired (d, i, l, m) and unpaired t-test (g). NS, not significant.
Fig. 4 |
Fig. 4 |. Enterococcus faecalis restores social deficits and corticosterone levels in mice.
a, Timeline schematics for b, c, f (left) and d, e, g (right). b, Social activity in mice treated with various antibiotic combinations (see main text). c, Serum corticosterone levels after social interaction in AVM- and AVNM-treated mice. d, Social activity in GF mice receiving faecal transplants from AVNM- or AVM-treated donor mice. e, Serum corticosterone levels in GF mice receiving faecal transplants from AVNM- or AVM-treated donor mice. f, Composition of bacteria (at family level) in faeces from AVNM- and AVM-treated donor mice. g, Enterococcus loads in faecal pellets from GF mice that received faecal transplants from AVNM- and AVM-treated donor mice. Red dashed line, lower limit of quantification (LLOQ). h, Timeline schematic depicts two rounds of RSI (first, baseline 3-week ABX effects; second, 3-week E.f. colonization effects). ABX mice colonized with E. faecalis (ABX + E.f.). Control buffer was given to vehicle (VEH + Ctrl) and ABX (ABX + Ctrl) mice. i, Social activity in VEH + Ctrl, ABX + Ctrl and ABX + E.f. mice. j, Serum corticosterone levels in ABX + Ctrl mice after second RSI. Data shown as individual points with mean ± s.e.m. from at least two independent trials. n = b, c, 8; d, e, 12 GF-AVNM, 14 GF-AVM; g, 11 GF-AVM, 9 GF-AVNM; i, 8 VEH, 8 ABX, 7 ABX + E.f.; j, 7 VEH + Ctrl, 8 ABX + Ctrl,7 ABX + E.f. mice per group. One-way ANOVA (b, j), two-way ANOVA with repeated measures (i) with Bonferroni multiple comparison test; two-tailed unpaired t-test (ce). NS, not significant.

Similar articles

Cited by

References

    1. Anderson DJ Circuit modules linking internal states and social behaviour in flies and mice. Nat. Rev. Neurosci 17, 692–704 (2016). - PubMed
    1. Chen P & Hong W Neural circuit mechanisms of social behavior. Neuron 98, 16–30 (2018). - PMC - PubMed
    1. Buffington SA et al. Microbial reconstitution reverses maternal diet-induced social and synaptic deficits in offspring. Cell 165, 1762–1775 (2016). - PMC - PubMed
    1. Desbonnet L, Clarke G, Shanahan F, Dinan TG & Cryan JF Microbiota is essential for social development in the mouse. Mol. Psychiatry 19, 146–148 (2014). - PMC - PubMed
    1. Rogers GB et al. From gut dysbiosis to altered brain function and mental illness: mechanisms and pathways. Mol. Psychiatry 21, 738–748 (2016). - PMC - PubMed

Publication types