. 2021 Jul;595(7867):450-454.
doi: 10.1038/s41586-021-03680-3. Epub 2021 Jun 30.

G-protein activation by a metabotropic glutamate receptor

Affiliations

G-protein activation by a metabotropic glutamate receptor

Alpay B Seven et al. Nature. 2021 Jul.

Abstract

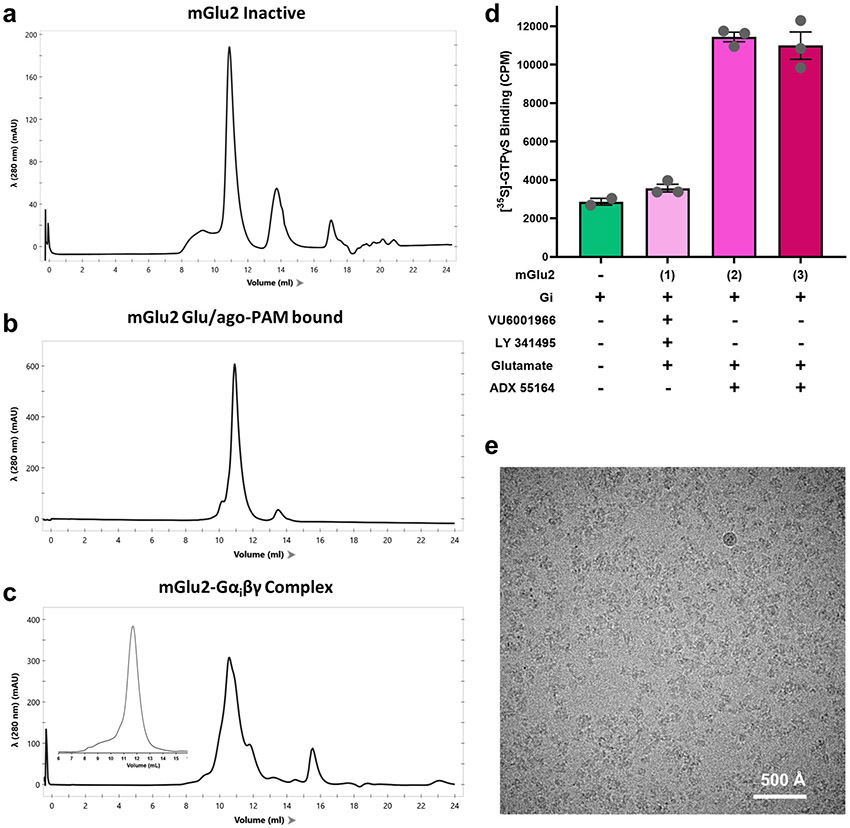
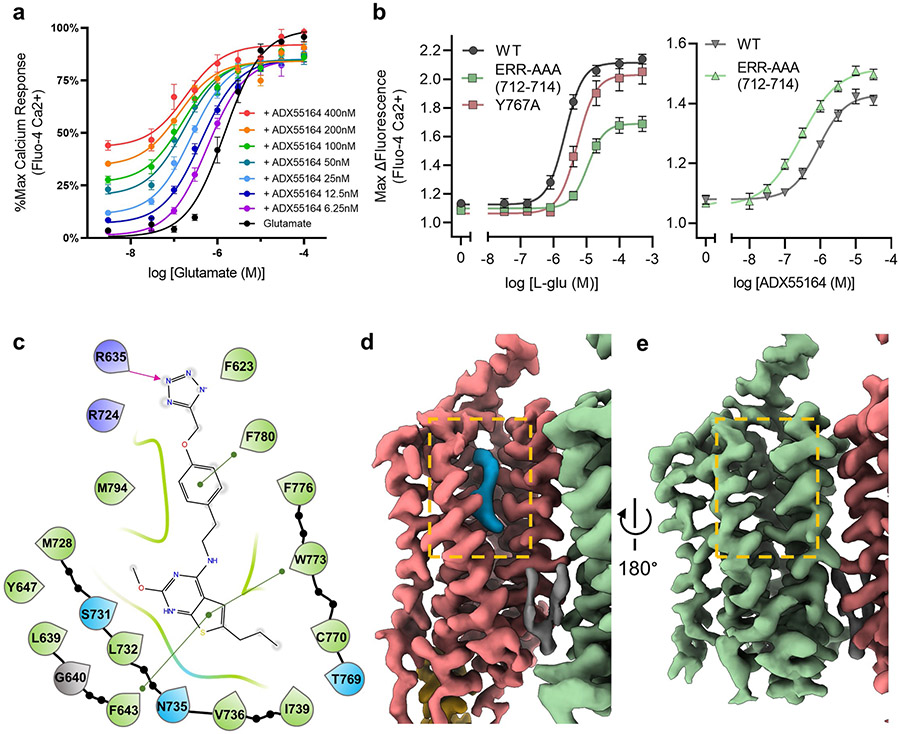
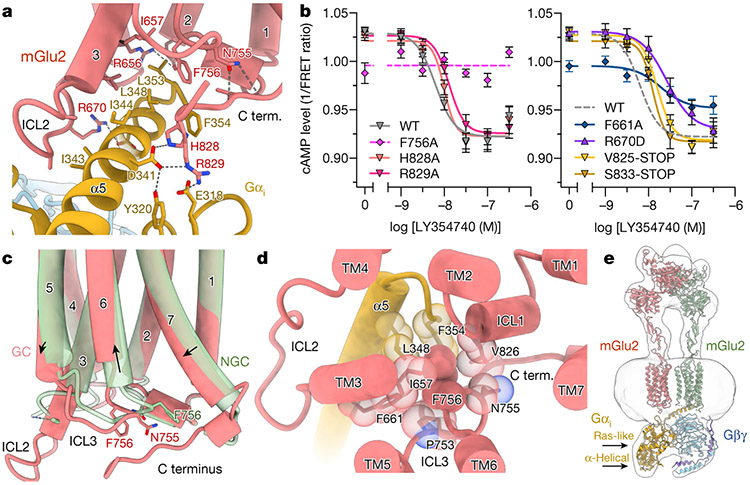
Family C G-protein-coupled receptors (GPCRs) operate as obligate dimers with extracellular domains that recognize small ligands, leading to G-protein activation on the transmembrane (TM) domains of these receptors by an unknown mechanism1. Here we show structures of homodimers of the family C metabotropic glutamate receptor 2 (mGlu2) in distinct functional states and in complex with heterotrimeric Gi. Upon activation of the extracellular domain, the two transmembrane domains undergo extensive rearrangement in relative orientation to establish an asymmetric TM6-TM6 interface that promotes conformational changes in the cytoplasmic domain of one protomer. Nucleotide-bound Gi can be observed pre-coupled to inactive mGlu2, but its transition to the nucleotide-free form seems to depend on establishing the active-state TM6-TM6 interface. In contrast to family A and B GPCRs, G-protein coupling does not involve the cytoplasmic opening of TM6 but is facilitated through the coordination of intracellular loops 2 and 3, as well as a critical contribution from the C terminus of the receptor. The findings highlight the synergy of global and local conformational transitions to facilitate a new mode of G-protein activation.


Figures

Extended Data Fig. 1 ∣
Extended Data Fig. 1 ∣. Preparation of cryo-EM samples.
a-c, Size-exclusion chromatography profiles of purified inactive-state mGlu2 (a), Glu/ago-PAM-bound state mGlu2 (b) and the mGlu2–Gi complex (c), repeated three times with similar results. Inset in c shows the size-exclusion profile of purified Gi heterotrimer. d, Gi protein nucleotide exchange stimulated by purified mGlu2 preparations in (1) inactive state, (2) Glu/ago-PAM-bound state and (3) active state preparation used for cryo-EM studies of the mGlu2–Gi complex, as determined in a GTPγS binding assay. mGlu2 purified in the presence of antagonist LY341495 and NAM VU6001966 did not produce a substantial increase in GαI GTPγS binding above the intrinsic binding of Gi alone. By contrast, mGlu2 purified in the presence of the agonist glutamate and ago-PAM ADX55164 produced a roughly 3.5-fold increase in Gi GTPγS binding. Data represent mean ± s.e.m. of reactions performed in triplicate. e, Representative cryo-EM micrograph of mGlu2–Gi–scFv complex from a single dataset with 45,371 micrographs.
Extended Data Fig. 2 ∣
Extended Data Fig. 2 ∣. Cryo-EM processing summary of mGlu2 in its inactive and Glu/ago-PAM-bound states.
a, Cryo-EM data processing workflow for the mGlu2 inactive state. b, Fourier shell correlation (FSC) curves for the mGlu2 inactive state cryo-EM maps of the ECD focused refinement and the global refinement. c, Angular distribution heat map of particles for reconstruction of the mGlu2 inactive state. d, Cryo-EM data processing workflow for the Glu/ago-PAM-bound state of mGlu2. e, FSC curves of the Glu/ago-PAM bound state of mGlu2 for the VFT focused refinement and the global refinement. f, Angular distribution heat map of particle projections in reconstruction of the Glu/ago-PAM-bound state of mGlu2. FSC curves and local refinement spectra were determined using CryoSPARC. Dashed lines represent the resolution at 0.143 FSC. All the processing steps were performed with Relion 3.1 (red) or CryoSPARC 3.1 (blue).
Extended Data Fig. 3 ∣
Extended Data Fig. 3 ∣. Cryo-EM processing summary for the mGlu2–Gi complex.
a, Cryo-EM data processing workflow for the mGlu2–Gi complex. b, FSC curves for the locally refined maps of the Gβγ, 7TM-Gαiβγ, CRD–7TM and VFT–CRD. Dashed lines represent the resolution at 0.143 FSC. c, Angular distribution heat map of particles for the mGlu2–Gi global reconstruction. FSC curves and local refinement spectra were calculated using CryoSPARC. All the processing steps were performed with Relion 3.1 (red) or CryoSPARC 3.1 (blue).
Extended Data Fig. 4 ∣
Extended Data Fig. 4 ∣. Agreement between cryo-EM map and model.
a, EM density and model for the 7TM of the mGlu2 inactive state. The 7TM model of mGlu2 from the mGlu2–Gi complex is rigid-body-docked to the mGlu2 inactive-state map (7TMA; green, 7TMB; coral, additional density inside the allosteric pocket of the 7TM; purple). b, Magnified view of a density inside the allosteric pocket of 7TMB that may correspond to negative allosteric modulator VU6001966. c, EM density, and model for the mGlu2–Gi complex; transmembrane helices of mGlu2 G-protein-coupled protomer (GC), transmembrane helices of non-G-protein-coupled protomer (NGC), ECL2, glutamate, ago-PAM ADX55164, 1,2-dipalmitoyl-sn-glycero-3-phosphoethanolamine as a representative phospholipid and α5 helix of Gαi. Densities were visualized with UCSF ChimeraX and zoned at 4 Å with a uniform threshold.
Extended Data Fig. 5 ∣
Extended Data Fig. 5 ∣. Comparison of structures across family C GCPRs.
The overall architecture of mGlu2 is similar to that of other family C GCPRs. The differences in the angle between VFT and CRD, and the angle between CRD and 7TMs leads to variations in the 7TM configuration. a-d, Models of single protomers of family C GPCRs are overlaid based on VFT superposition. Comparison of the inactive-state model of mGlu2 from this study with the mGlu5 apo state model (PDB: 6N52) (a), the mGlu5 active state model (PDB: 6N51) (b), the CaSR inactive state model (c) and the CaSR active state model (d, see ref. ). e, Top-down view of mGlu2 7TM bundles shows that TM6 helices are distal to the 7TM interface in the inactive state (left) but form the active-state interface (right). f-h, The inactive state configuration of 7TMs of family C GPCRs are variable. Top-down view of the 7TMs of inactive-state (left) and active-state (right) family C GPCRs: mGlu5 (apo PDB: 6N52, active PDB: 6N51) (f), GABAB (inactive PDB: 6W2X, active PDB: 7C7Q) (g) and CaSR (h, ref. ). The receptors display variable 7TM configuration.
Extended Data Fig. 6 ∣
Extended Data Fig. 6 ∣. Ago-PAM modulation of mGlu2.
a, The mGlu2 ago-PAM ADX55164, used to stabilize the active receptor conformation, potentiates the functional response of mGlu2 to l-glutamate. Receptor activation is measured by co-transfection of the mGlu2 with the neuronal glutamate transporter EAAT3 to remove extracellular glutamate and a chimeric Gq/o5 to enable intracellular calcium release as a readout. b, In a similar assay, mutation of the ECL2 tip (residues 712–714; ERR-AAA) and the Y767A mutation on the TM6–TM6 interface blunt glutamate-induced signalling (left) and compared to wild-type mGlu2, the ago-PAM ADX55164 has higher potency and higher Emax for the ERR-AAA mutant, consistent with a partial uncoupling of the ECD from the 7TM (right). c, Schematic of interactions between mGlu2 residues and ago-PAM ADX55164 bound within the 7TM core. Green, hydrophobic; blue, polar; purple, positively charged; magenta arrow, hydrogen bond; green line, π–π stacking; grey, glycine. d, e, Magnified views of the cryo-EM map of G-protein-coupled active-state mGlu2 GC (coral) (d) and NGC (green) (e) protomers show that ago-PAM (blue) binds only to the GC protomer, whereas the analogous pocket is not accessible by the membrane (pocket opening highlighted with orange box) on the NGC protomer. A phospholipid density between two 7TMs is shown in grey. The head group of the lipid molecule does not seem to interact with mGlu2 or Gi and the density might represent a lipid molecule with different head groups. All family C GPCR dimeric structures display elongated densities between two protomers, most likely corresponding to either cholesterol or phospholipids. Additionally, GABAB structures displayed a phospholipid molecule inside the 7TM, indicating the importance of lipid molecules in family C GPCR dimerization and activity. Data in a and b represent mean ± s.e.m. from four and five independent experiments measured in duplicate, respectively.
Extended Data Fig. 7 ∣
Extended Data Fig. 7 ∣. Ago-PAM binding-pose validation for mGlu2.
Residues within the binding pocket of ago-PAM ADX55164 were mutated to study their role in PAM activity. a, Mutant and wild-type receptor responses to increasing concentrations of glutamate in the absence (brown) or presence (green) of 200 nM ADX55164 were tested in an intracellular calcium release assay following co-transfection with the EAAT3 and Gq/o5. Responses were normalized to the maximum response of the wild-type receptor. The concentrations of glutamate are plotted on the x axis [log (M)]. The amount of receptor DNA transfected was increased up to tenfold to obtain mutant expression levels similar to that of the wild-type; however, for some mutants, such expression levels could not be reached. Data shown represent the mean ± s.e.m. from five independent experiments. b, Mutant and wild-type receptor surface expression levels were monitored by fluorescence microscopy using an N-terminal Flag-tag present on all constructs and an anti-Flag Cy3 antibody. Data in b represent images from three independent experiments. R720A, S731A and L732A mutants did not produce glutamate or ADX55164 responses and did not show surface expression in immunofluorescence studies (not shown). c, The change in pEC50 of mutant and wild-type receptors upon addition of 200 nM ADX55164 plotted from individual experiments along with individual data points for estimation of surface expression of mutants compared to the wild-type (100%) by flow cytometry. Statistics were derived from at least 4 independent experiments by one-way ANOVA and comparison of each mutant to the wild-type. A statistical difference from the wild-type is indicated by an asterisk (*). P values were corrected for multiple comparisons using Dunnett’s test and are provided in Supplementary Table 1.
Extended Data Fig. 8 ∣
Extended Data Fig. 8 ∣. Comparison of water coordination, 7TM activation and the G-protein interface across GPCRs.
a, EM density for the region of the observed water molecule coordinated inside the allosteric pocket of PAM-less 7TM of mGlu2 (labelled residues are conserved in mGlu5, and blue dashed lines represent hydrogen bonds between the water molecule and mGlu2). b, Comparison of the water molecule coordinated inside the allosteric pocket of mGlu5 (PDB: 4OO9, yellow; water, brown) and the PAM-less 7TM of mGlu2 (mGlu2–Gi structure, green; water, red). The homologous Tyr647 residue in mGlu5 (Tyr659) coordinates a water molecule in the NAM-stabilized mGlu5 allosteric pocket,, and has a role in ligand pharmacology by affecting allosteric modulator cooperativity. The mGlu2–Gi map also reveals a density that corresponds to a water molecule within the PAM-less 7TM bundle, coordinated between residues Tyr647, Thr769, Ser801 and Gly802, similar to the water-molecule coordination in the allosteric pocket of NAM-stabilized mGlu5 structures,,. The PAM-bound 7TM bundle shows a weaker density for this water molecule. Using JAWS simulations, a statistical thermodynamics-based approach to determine water-molecule positioning, a water molecule was observed to be bound in the pocket containing the putative water site in both protomers. The conservation of these four residues and resolution of water molecules in mGlu2 and mGlu5 indicates the importance of water for mGlu ligand pharmacology. c, Superposition of M1 muscarinic receptor (M1R) inactive (PDB: 5CXV) and active (PDB: 6OIJ) states reveals TM6 movement (agonist: iperoxo, orange). d, Tryptophan toggle switch in M1R. e, f, Comparison of the overall Gi protein coupling arrangement on the cannabinoid receptor 1 (CB1), a representative family A GPCR (e) and mGlu2 (f). The non-G-protein-coupled protomer model is not shown for clarity. g, Magnified view of cryo-EM map of G-protein-coupled active-state mGlu2.
Extended Data Fig. 9 ∣
Extended Data Fig. 9 ∣. Functional analysis of mGlu2 mutants for Gi activation.
a, Truncation of the mGlu2 C terminus or mutation of critical residues of mGlu2 involved in the formation of the observed G-protein interface substantially decreases receptor activation by l-Glu as tested in an intracellular calcium release assay following co-transfection with the EAAT3 and Gq/o5. Data in a represent mean ± s.e.m. from five independent experiments. b, An Epac1-based FRET cAMP biosensor capable of reporting intracellular cAMP levels was used to investigate the effect of mutating critical residues of mGlu2 in the Gi-interacting interface. FRET between the fluorescent proteins decreases after cAMP binding to a fusion protein consisting of an Epac1-domain (residues 14–881) flanked by fluorescent proteins mCerulean and mCitrine. c, Representative kinetic traces of LY354740 (mGlu2 agonist)-induced inhibition of forskolin-stimulated cAMP formation through Gi activation by wild-type mGlu2 and mutants. The effect of the NAM MNI-137 and non-transfected cell traces are shown for comparison. Indicated are time points for mGlu2 ligand addition and for taking cAMP values for generation of the concentration-response curves (CRC) shown in Fig. 3b. Data in c represent mean ± s.d. from one representative experiment performed in triplicate.
Extended Data Fig. 10 ∣
Extended Data Fig. 10 ∣. Intermediate states of mGlu2–Gi activation.
a, Cryo-EM maps of mGlu2 in two distinct intermediate states with open-closed VFTs and inactive 7TM conformation. The protomer contributing TM3 to the interface (7TMA) displays an open VFT and the protomer contributing TM4 to the interface (7TMB) displays a closed VFT in one intermediate state (left), and the opposite in the other intermediate state (right). b, Reference-free cryo-EM 2D class average of the mGlu2–Gi protein complex shows heterotrimeric G-protein pre-coupling to mGlu2 in the inactive state (top), compared to an average of the nucleotide-free Gi coupled to mGlu2 (bottom). The α-helical domain of Gα is ordered in the pre-coupled state, indicating a GDP-bound G protein. This observation suggests that VFT activation and the approximately 180° rearrangement of the 7TMs to establish the TM6–TM6 interface would be necessary for G-protein activation. c, Cryo-EM model of G-protein-coupled active state model of mGlu2 and G protein overlaid to either of the 7TMs of mGlu2 in the inactive-state model. The αN helix of the Gα protein in both conformations would clash with the membrane, while Gβ would also clash with the adjacent protomer if the Gi is bound to TMB of the inactive state (clash represented by red stars).
Fig. 1 ∣
Fig. 1 ∣. Structures of mGlu2 alone and in complex with Gi.
a-c, Composite cryo-EM maps (top) and models (bottom) of mGlu2 in an inactive state in the presence of an orthosteric antagonist and NAM (a), in the Glu/ago-PAM-bound state (b) in the active-state coupled to nucleotide-free heterotrimeric Gi in the presence of Glu and ago-PAM (c). mGlu2, coral and green; NAM, not represented; antagonist, cyan; micelle, transparent; ago-PAM, light blue; glutamate, yellow; phospholipid, grey; Gαi, gold; Gβ, blue; Gγ, purple.
Fig. 2 ∣
Fig. 2 ∣. Active-state mGlu2 forms an asymmetric dimer.
a, The VFT of the NGC protomer of the mGlu2–Gi complex is aligned to the VFT of the GC protomer (glutamate, yellow). b, mGlu2 protomers in the same orientation. Ago-PAM (ADX55164; blue) binds only the GC protomer (left), and ECL2, ECL3 and TM6 are distinct between protomers. Differential interaction residues in each protomer are highlighted with key interactions shown (dashed lines). c, The asymmetric TM6–TM6 interface. d, The 7TM bundle of the mGlu2 NGC protomer is superposed to the 7TM bundle of the GC protomer. TM6 of the GC protomer is tilted towards the TM6 of the NGC protomer and shifted approximately half a helical pitch towards the extracellular side to form an asymmetric TM6–TM6 interface. e, Rearrangement of mGlu2 switch residues between GC and NGC subunits.
Fig. 3 ∣
Fig. 3 ∣. G-protein coupling by mGlu2.
a, mGlu2 couples to Gi through an interface involving ICL2, ICL3, TM3 and the receptor C terminus (C term.). b, Truncation of the mGlu2 C terminus or mutation of critical residues of mGlu2 that are involved in the formation of the observed G-protein interface reduces Gi-mediated receptor activation by the agonist LY354740, as measured by inhibition of forskolin-stimulated cAMP formation. Data are mean ± s.e.m. from 9 independent experiments. WT, wild-type. c, Comparison of the cytoplasmic halves of the mGlu2 GC protomer and NGC protomer 7TM bundles shows reorganization of ICL3 along with ordering of ICL2 and the receptor C terminus upon G-protein binding. d, The conserved Phe756 establishes a hydrophobic core to pack residues from TM3, ICL2, the receptor C terminus and the α5 helix of Gαi. e, Cryo-EM map of the G-protein-coupled inactive-state mGlu2. Models of the intermediate state mGlu2 and GDP-bound Gαiβγ (PDB: 1GP2) with a closed α-helical domain are docked in the density map.
Fig. 4 ∣
Fig. 4 ∣. mGlu2 conformational transitions upon activation.
Inactive-state mGlu2 adopts a conformation that has symmetric, open VFTs, distant CRDs and an asymmetric 7TM dimer with a TM3–TM4 interface. Glutamate binding closes one VFT to form a stable intermediate state in which the 7TM bundles remain in an inactive conformation. The binding of glutamate to both VFTs promotes an approximately 180° change in the relative configuration of the 7TM bundles to form an asymmetric TM6–TM6 interface. Ago-PAM (cyan) is observed bound only in one 7TM bundle. Upward movement of one TM6 in the TM6–TM6 interface enables the reorganization of cytoplasmic elements, the ordering of ICL2 and the engagement of the C terminus with the G protein.

References

    1. Koehl A et al. Structural insights into the activation of metabotropic glutamate receptors. Nature 566, 79–84 (2019). - PMC - PubMed
    1. Attwood TK & Findlay JB Fingerprinting G-protein-coupled receptors. Protein Eng. 7, 195–203 (1994). - PubMed
    1. Weis WI & Kobilka BK The molecular basis of G protein-coupled receptor activation. Annu. Rev. Biochem 87, 897–919 (2018). - PMC - PubMed
    1. Niswender CM & Conn PJ Metabotropic glutamate receptors: physiology, pharmacology, and disease. Annu. Rev. Pharmacol. Toxicol 50, 295–322 (2010). - PMC - PubMed
    1. Conn PJ, Lindsley CW & Jones CK Activation of metabotropic glutamate receptors as a novel approach for the treatment of schizophrenia. Trends Pharmacol. Sci 30, 25–31 (2009). - PMC - PubMed

Publication types

MeSH terms

Substances