. 2021 Jul;595(7867):444-449.
doi: 10.1038/s41586-021-03589-x. Epub 2021 Jun 30.

Shape of promoter antisense RNAs regulates ligand-induced transcription activation

Affiliations

Shape of promoter antisense RNAs regulates ligand-induced transcription activation

Fan Yang et al. Nature. 2021 Jul.

Abstract

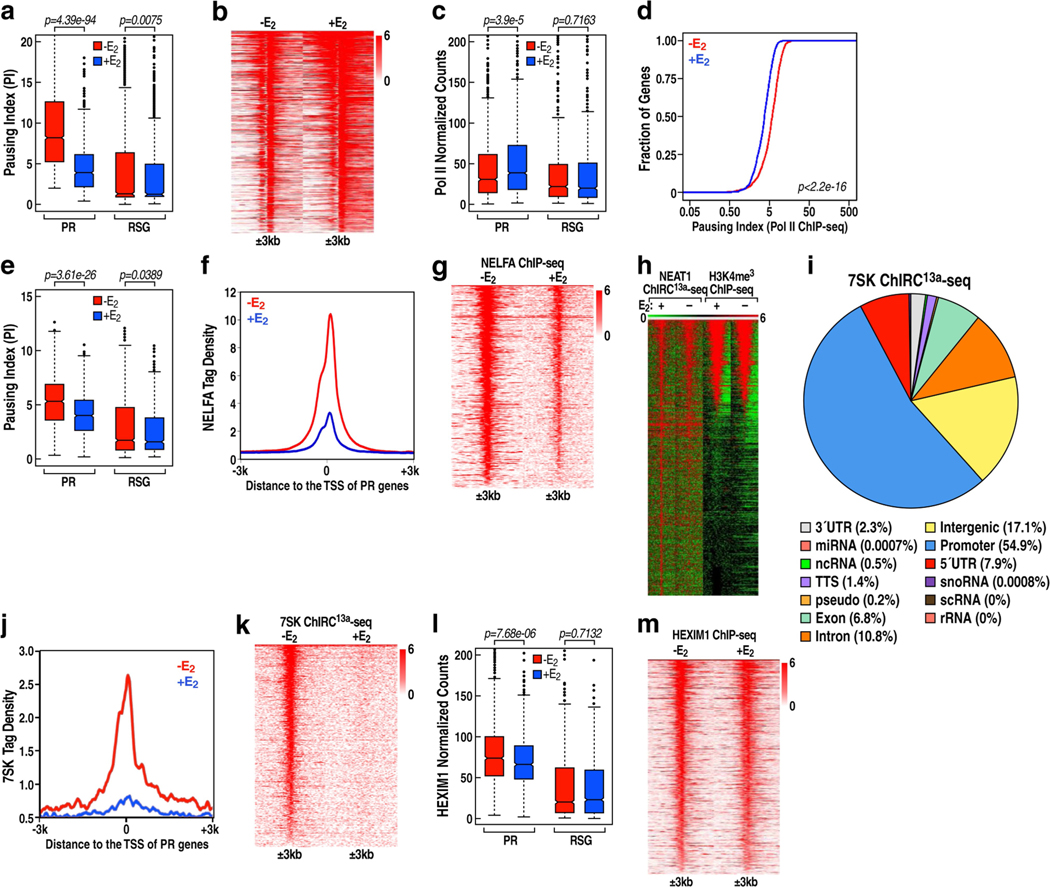
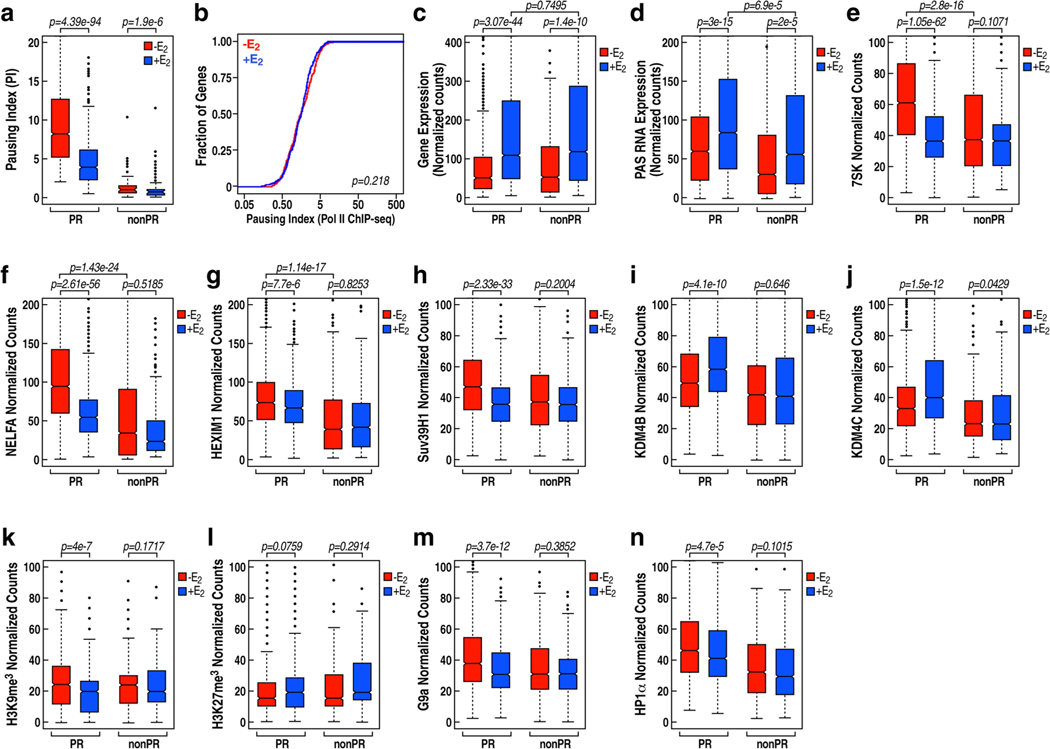
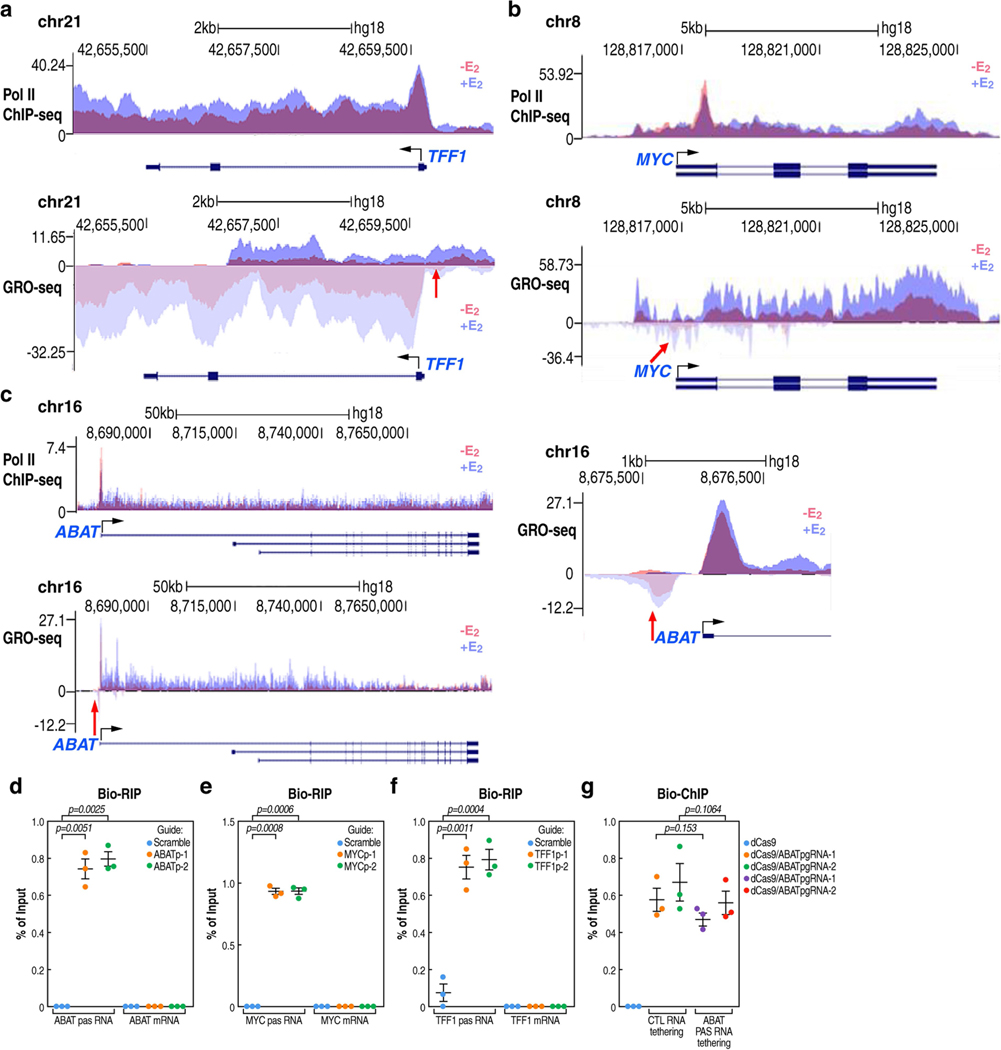
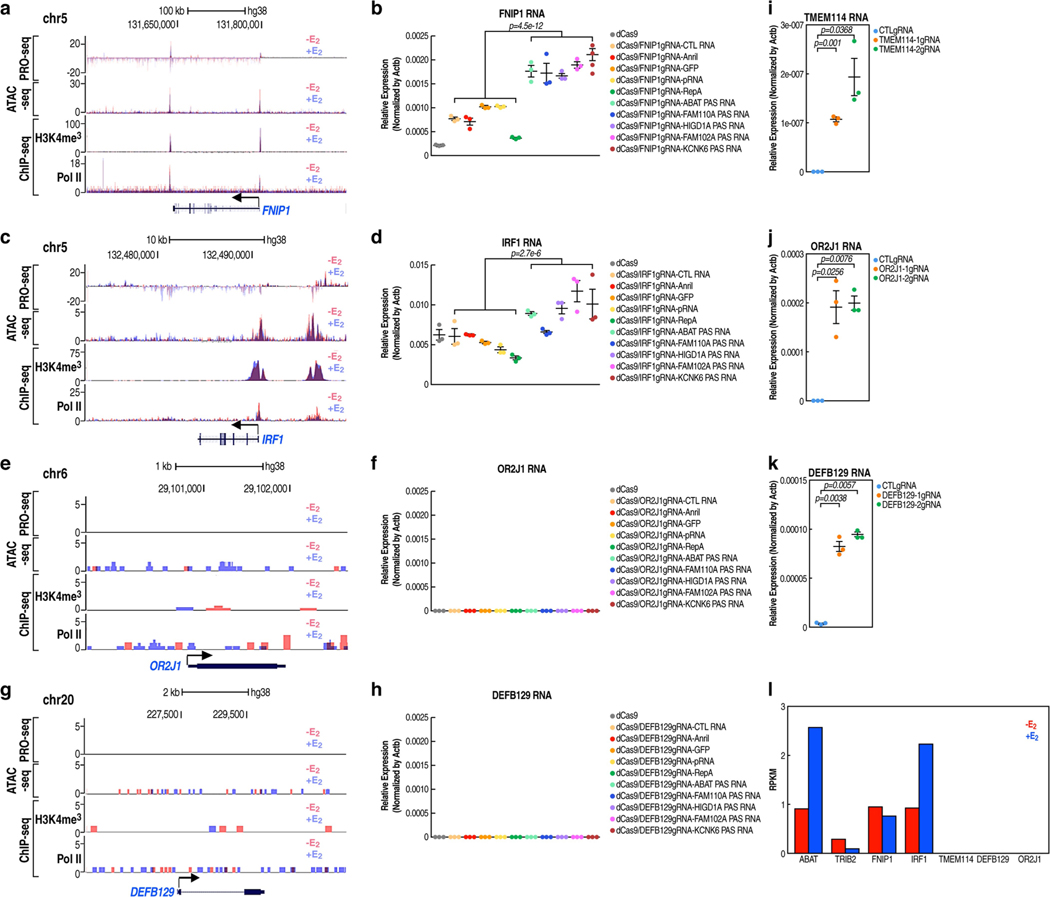
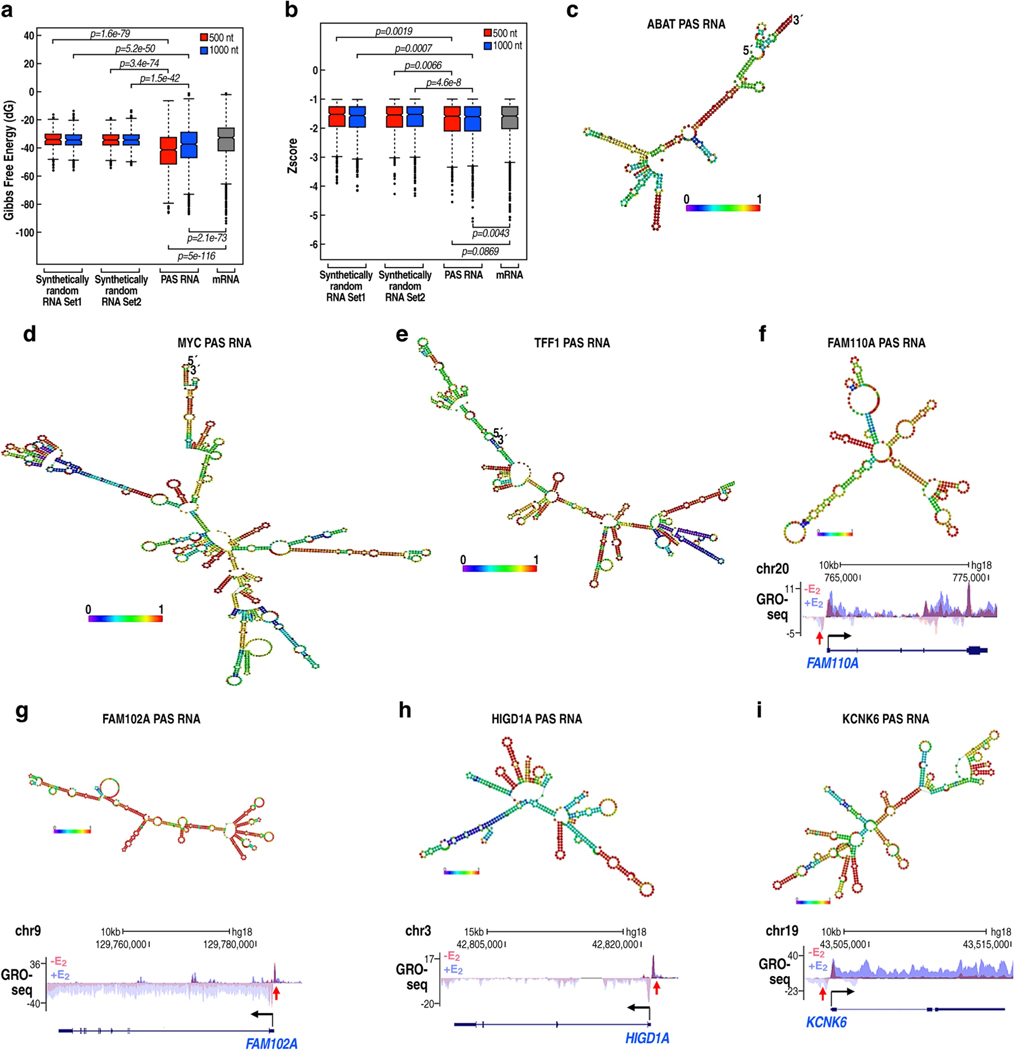
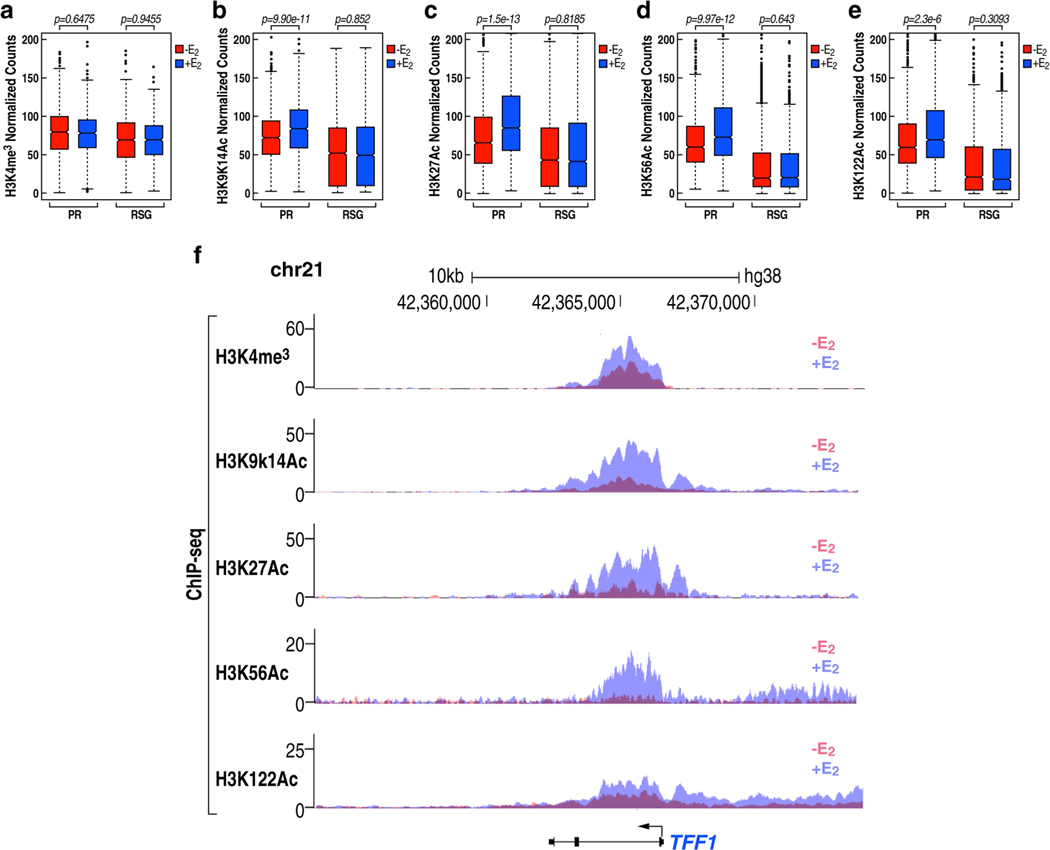
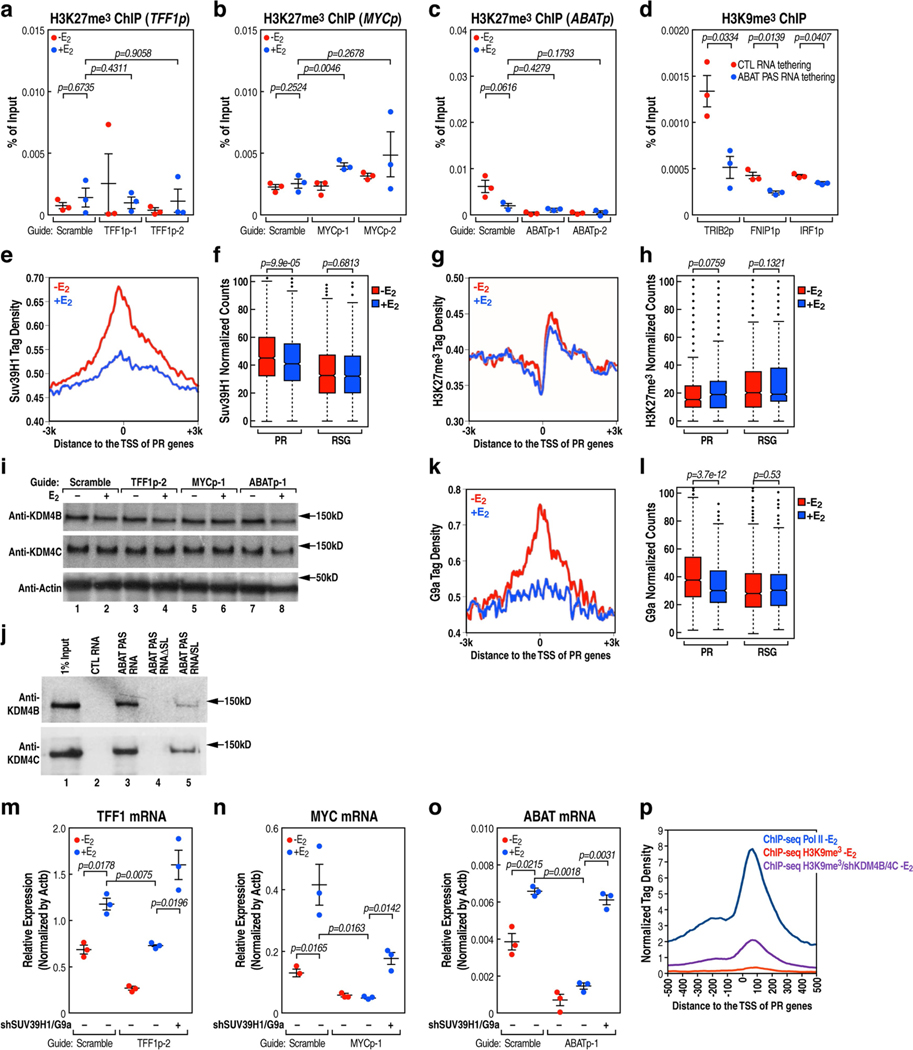
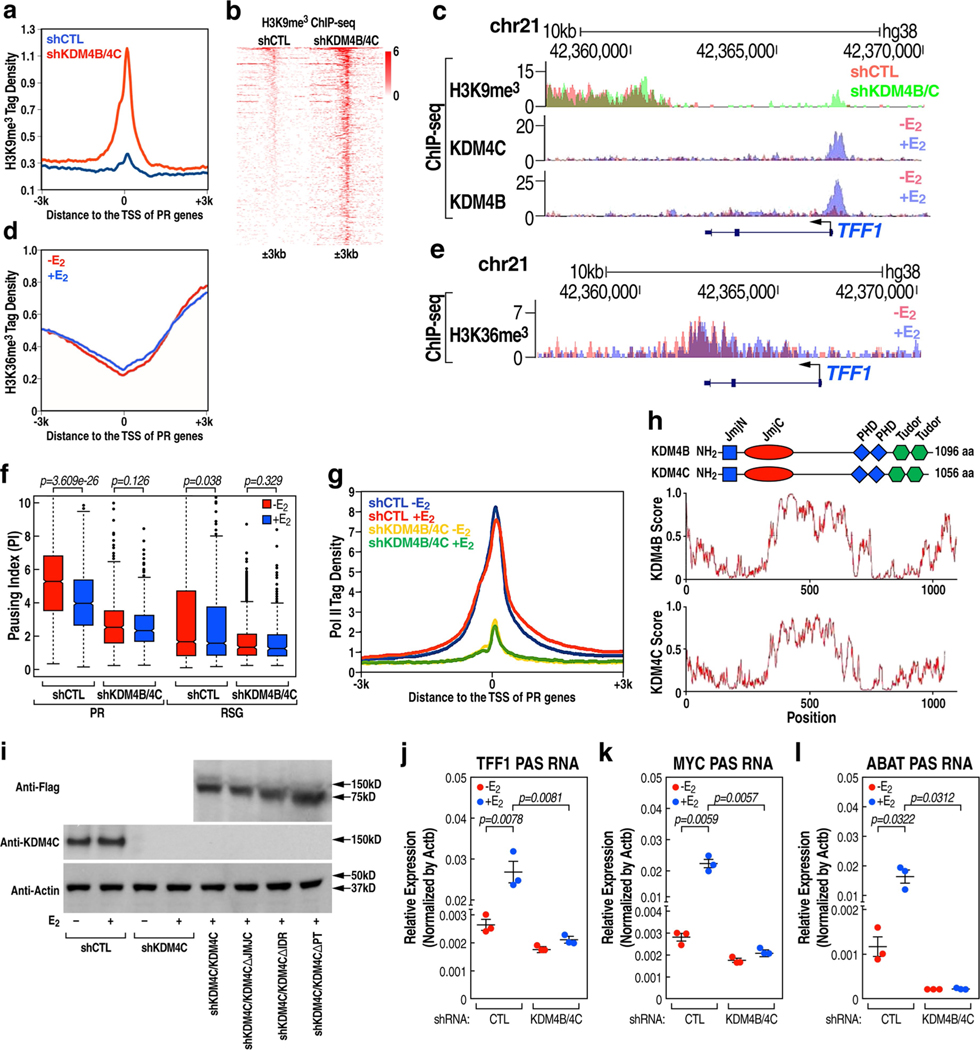
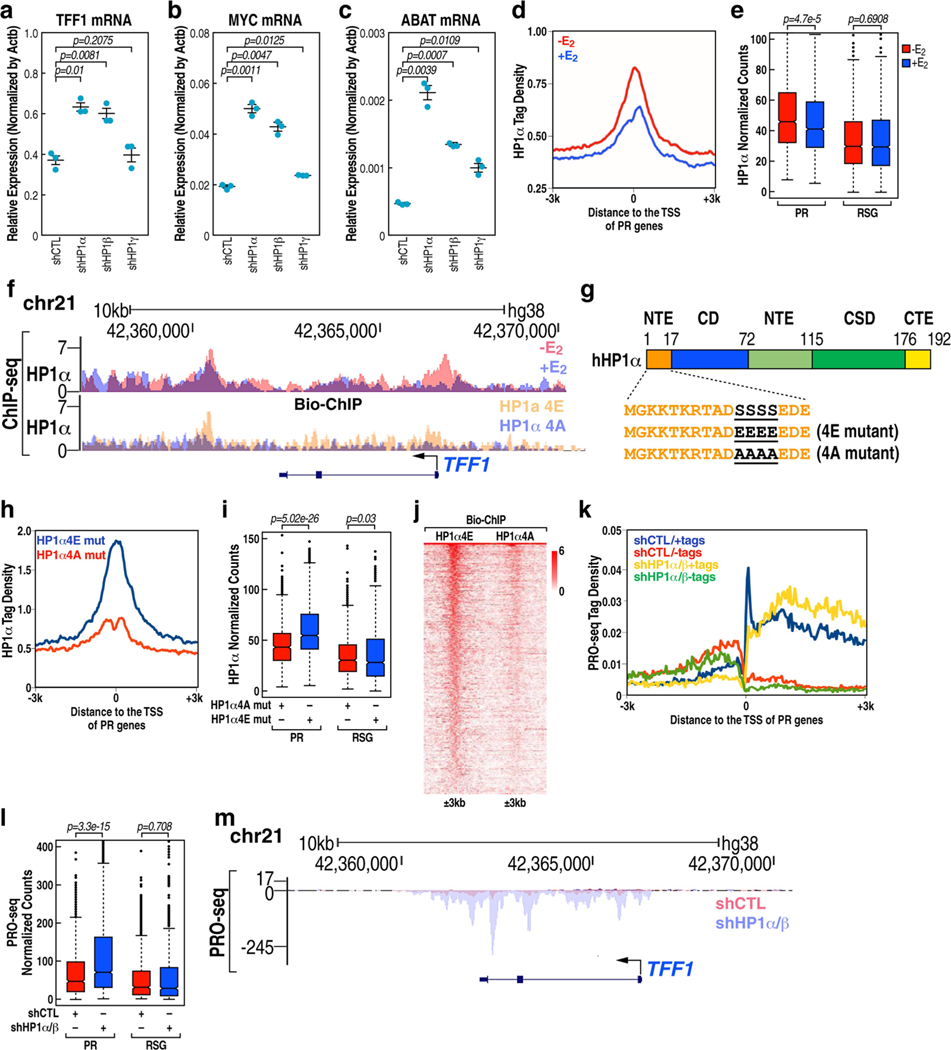
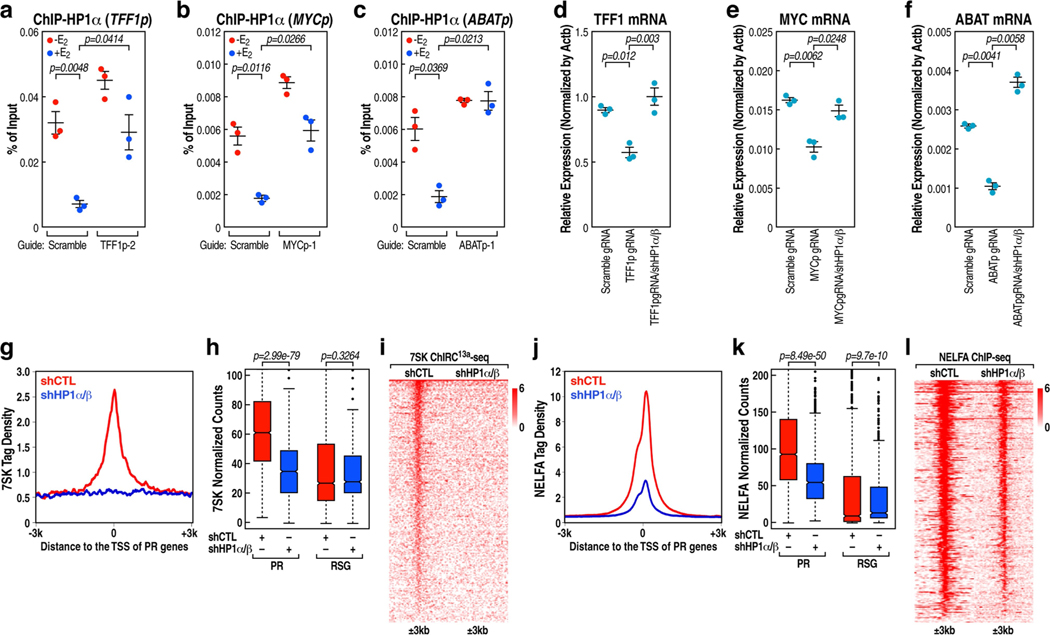
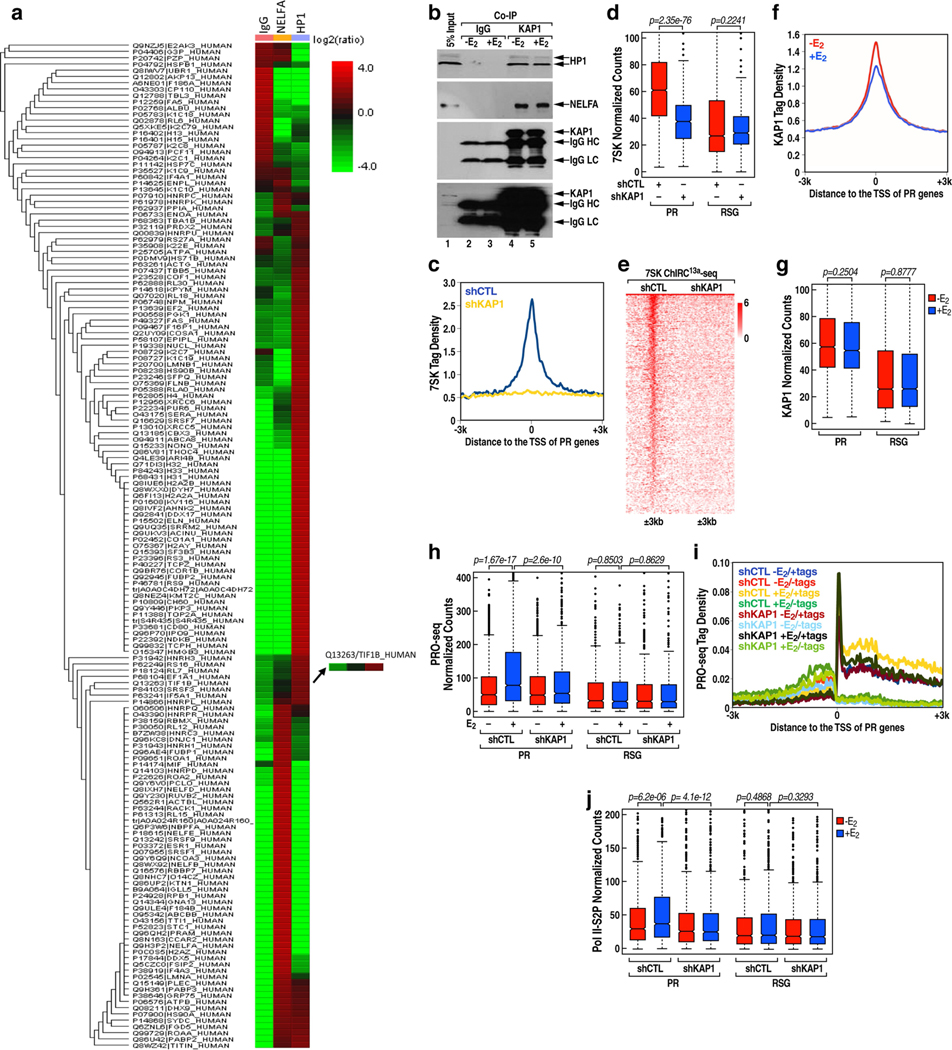
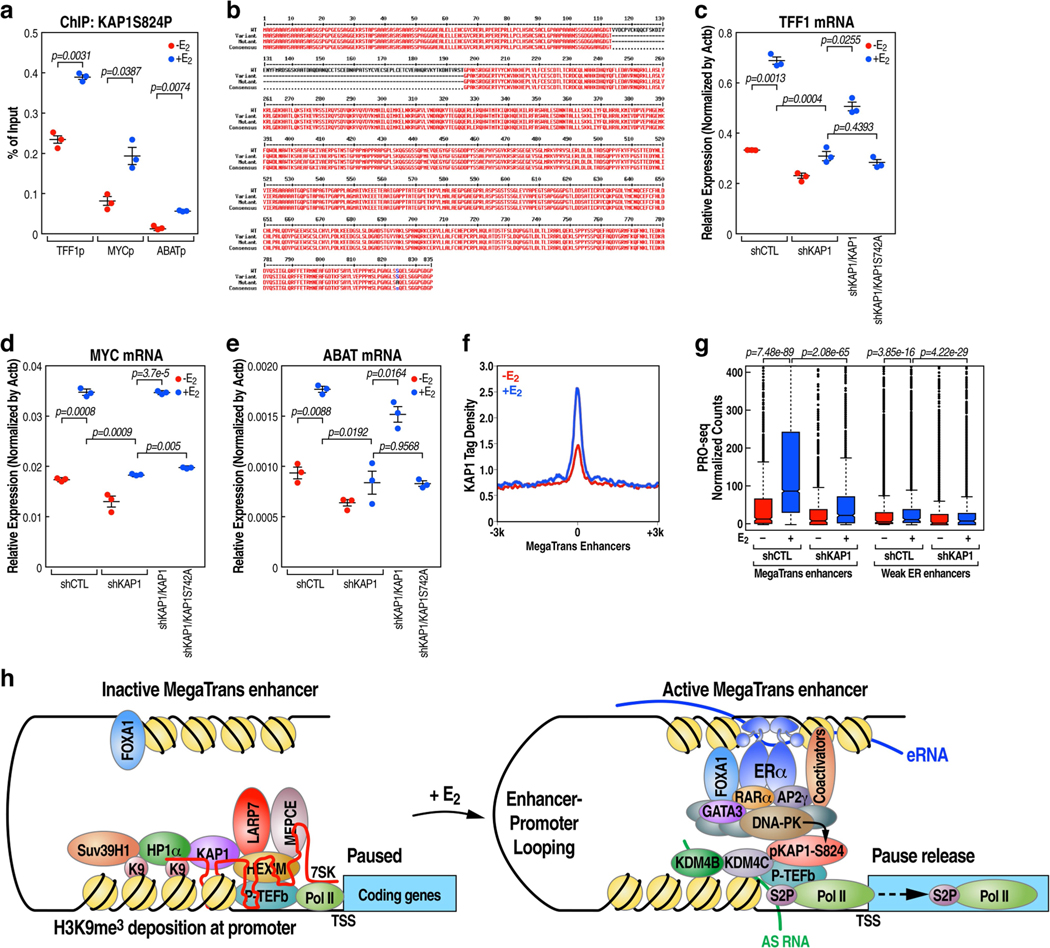
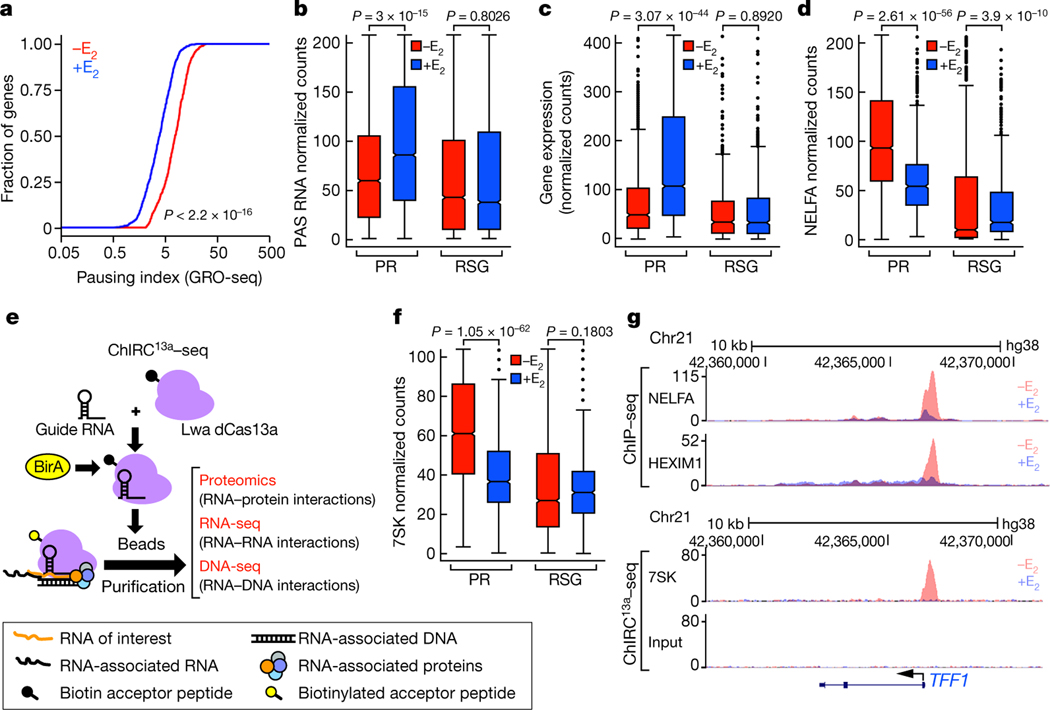
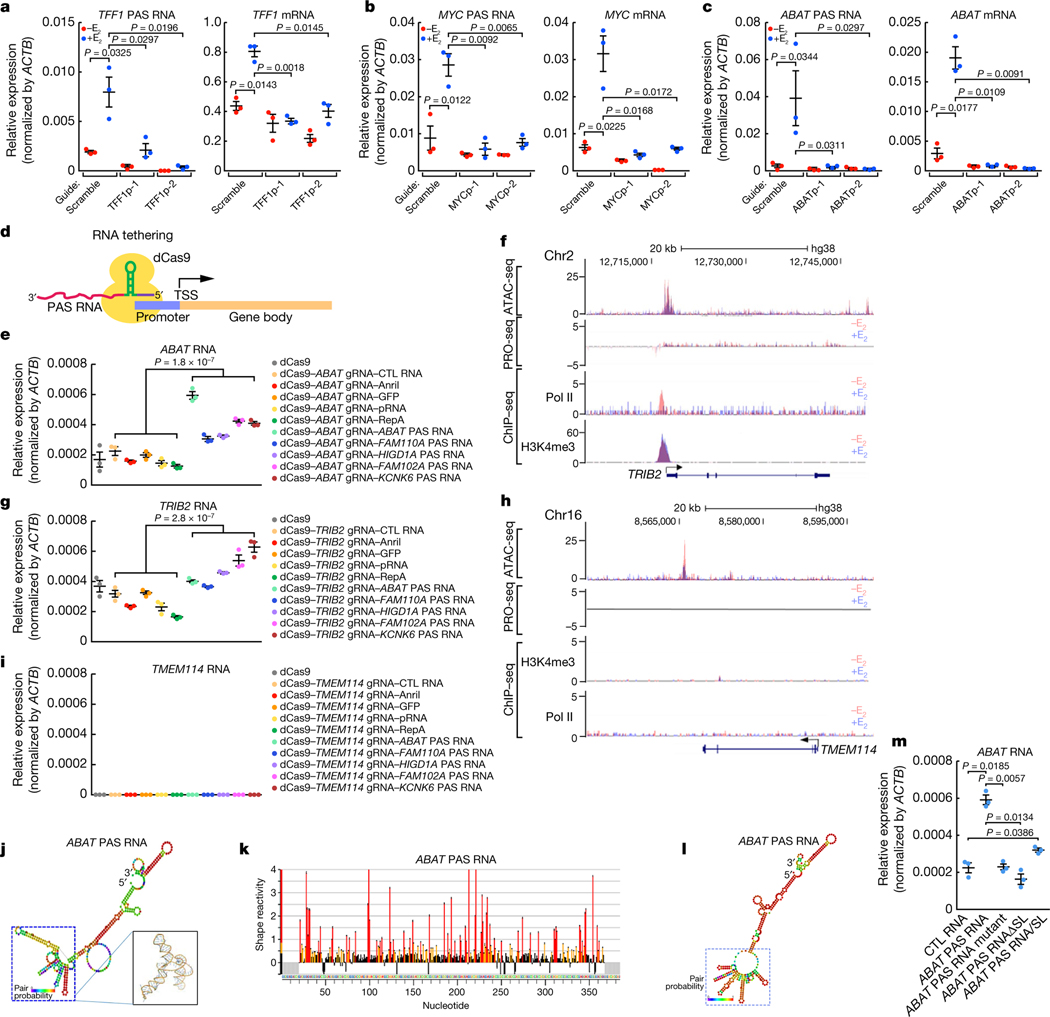
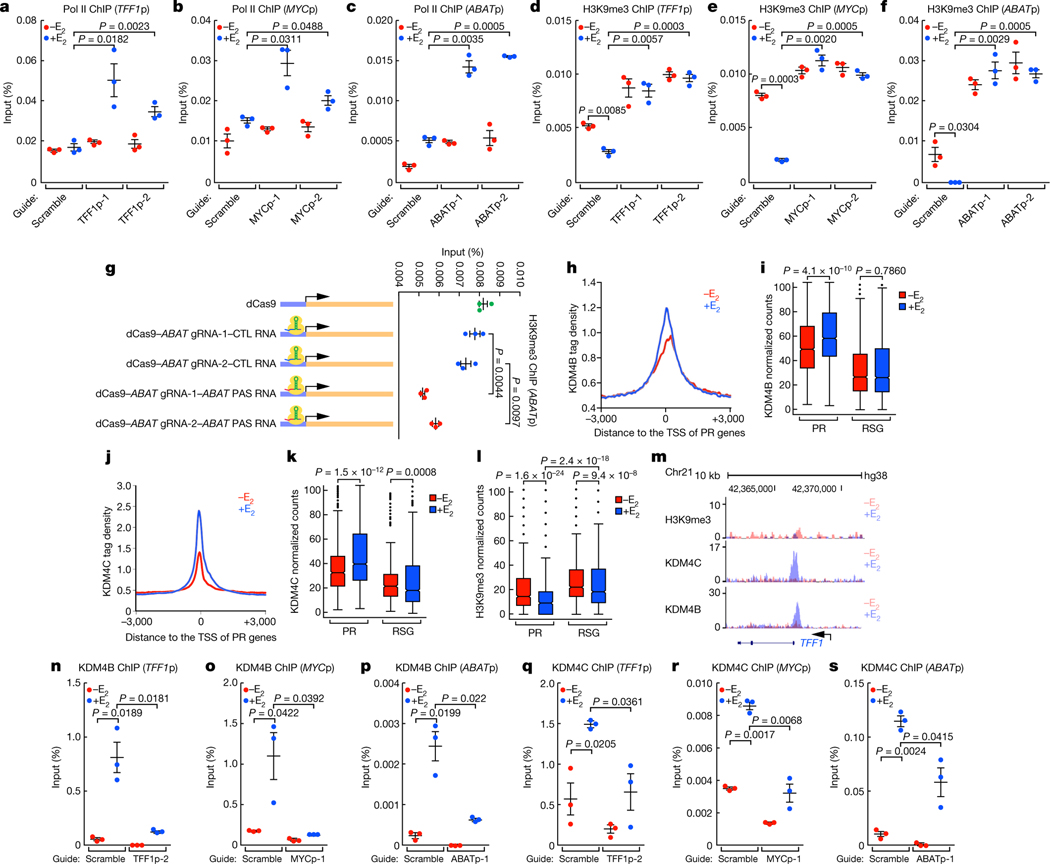
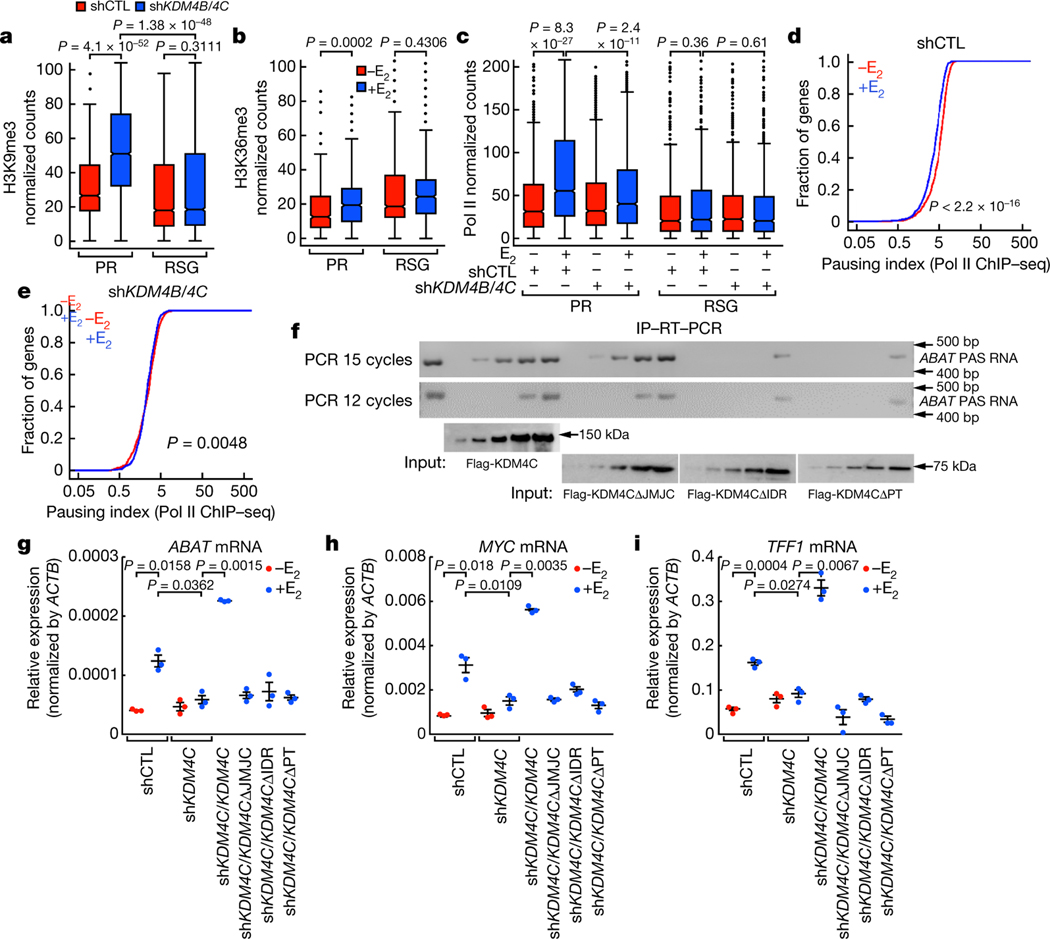
The size of the transcriptional program of long non-coding RNAs in the mammalian genome has engendered discussions about their biological roles1, particularly the promoter antisense (PAS) transcripts2,3. Here we report the development of an assay-referred to as chromatin isolation by RNA-Cas13a complex-to quantitatively detect the distribution of RNA in the genome. The assay revealed that PAS RNAs serve as a key gatekeeper of a broad transcriptional pause release program, based on decommissioning the 7SK small nuclear RNA-dependent inhibitory P-TEFb complex. Induction of PAS RNAs by liganded ERα led to a significant loss of H3K9me3 and the release of basally recruited HP1α and KAP1 on activated target gene promoters. This release was due to PAS RNA-dependent recruitment of H3K9me3 demethylases, which required interactions with a compact stem-loop structure in the PAS RNAs, an apparent feature of similarly regulated PAS RNAs. Activation of the ERα-bound MegaTrans enhancer, which is essential for robust pause release, required the recruitment of phosphorylated KAP1, with its transfer to the cognate promoters permitting 17β-oestradiol-induced pause release and activation of the target gene. This study reveals a mechanism, based on RNA structure, that mediates the function of PAS RNAs in gene regulation.


Figures

Extended Data Fig. 1 |
Extended Data Fig. 1 |. PAS RNA and Pol II promoter proximal pause release induced by E2.
a, Box plot analysis of the pausing ratio based on GRO-seq data set in GSE41324 (n = 3 independent experiments) for PR genes and 837 randomly selected genes (RSG), in the absence or presence of E2 treatment. We hereafter use the abbreviations ‘PR’ for ‘the 837 upregulated genes with Pol II pause release’, and ‘RSG’ for ‘the 837 randomly selected genes’. b, Heat map representation of GRO-seq (GSE41324) normalized tag counts centred on the 837 PR promoters (±3 kb) showing robust PAS RNA transcription at PR promoters induced by E2. c, Box plots analysis of Pol II ChIP-seq data representing the effect of E2 on Pol II occupancy over the gene bodies of the PR versus the gene bodies of RSG. d, Cumulative distribution of the Pol II pausing ratio based on Pol II ChIP-seq analysis for the PR genes in the absence or presence of E2 treatment. Data were generated in two independent experiments. The P value was calculated with two-sided Kolmogorov- Smirnov test. e, Box plot analysis of the pausing ratio based on Pol II ChIP-seq data for PR genes and RSG, in the absence or presence of E2 treatment. f, ChIP-seq tag distribution analysis representing the effect of E2 on NELFA binding at the promoters of PR genes. g, Heat map of NELFA ChIP-seq analysis representing the effect of E2 on NELFA binding at the promoters of PR genes. h, Heat map of NEAT1 ChIRC13a-seq showing a subset of NEAT1 binding sites marked with promoter mark H3K4me3, revealing that lncRNA NEAT1 localized to approximately 603 promoters in the absence of E2 treatment. i, Genomic distribution of 7SK snRNA in the basal (-E2) condition. Consistent with 7SK function regulating promoter-proximal pausing of Pol II, a large number of 7SK binding sites were localized on the promoter region of a large set of genes (n = 6,885, about 54.9% of its total binding sites). Unexpectedly, a large number of 7SK binding sites were also found to be located on intronic (n = 1,351, about 10.8% of its total binding sites) and intergenic (n = 2,144, approximately 17.1% of its total binding sites) regions. j, ChIRC13a-seq tag profile representing the effect of E2 treatment on 7SK binding at PR promoters. k, Heat map of 7SK ChIRC13a-seq analysis representing the effect of E2 on 7SK binding at the promoters of PR genes. l, Box plot analysis of HEXIM1 ChIP-seq data representing the effect of E2 on HEXIM1 binding at PR promoters and RSG promoters. m, Heat map of HEXIM1 ChIP-seq data representing the effect of E2 on HEXIM1 binding at the PR promoters. In a, c, e, l, the box plots denote the medians, the interquartile ranges and the whiskers. Data were generated in two independent experiments. The P values were calculated with two-sided Wilcoxon test.
Extended Data Fig. 2 |
Extended Data Fig. 2 |. E2-induced Pol II pause release occurs specifically on PR genes.
a, Box plot analysis of GRO-seq data set in GSE41324 showing the decrease of the pausing ratio at PR genes, in contrast to the 239 E2-upregulated genes that do not show pause release, following E2 treatment. These 239 genes, if without specification, are hereafter defined as non-PR genes. b, Cumulative distribution of the Pol II pausing ratio based on Pol II ChIP-seq analysis for the non-PR genes following E2 treatment. Data were generated in two independent experiments. The P value was calculated with two-sided Kolmogorov-Smirnov test. c, Box plot analysis of GRO-seq data set in GSE41324 showing robust gene expression of PR and non-PR genes following E2 treatment. d, Box plot analysis of GRO-seq data of the datasets in GSE41324 showing PAS RNA expression at the promoters of PR genes and at the promoters of non-PR genes, in the absence or presence of E2 treatment. To compute PAS RNA expression, we counted the number of GRO-seq reads on 1-kb region in front of the TSS, on the opposite strand, as informed by the GRO-seq profiles around TSS regions. e, Box plot analysis of 7SK ChIRC13a-seq data representing the effect of E2 on 7SK binding at PR and non-PR promoters. f-n, Box plot analysis of NELFA (f), HEXIM1 (g), Suv39H1 (h), KDM4B (i), KDM4C (j), H3K9me3 (k), H3K27me3 (l), G9a (m) and HP1α (n) ChIP-seq data representing the effect of E2 on the corresponding factor binding at PR and non-PR promoters. The box plots denote the medians, the interquartile ranges and the whiskers. Data were generated in two independent experiments. The P values were calculated with two-sided Wilcoxon test.
Extended Data Fig. 3 |
Extended Data Fig. 3 |. Specificity of CRISPR-Cas13a-based PAS RNA degradation.
a-c, Genome browser views of Pol II ChIP-seq and GRO-seq on TFF1 (a), MYC (b) and ABAT (c) genomic loci, in the absence or presence of E2 treatment. The red arrowhead indicates upregulation of PAS RNA. d-f, Real-time RT-PCR analysis of Bio-RIP data showing specificity of the CRISPR-Cas13a strategy mediated ABATpasRNA (d), MYCpasRNA (e) and TFF1pasRNA (f) knockdown. Data shown as individual values, mean ± s.d. (n = 3). The P values were calculated with two-sided Student’s t-test. g, Real-time PCR analysis of Bio-ChIP data showing that PAS RNA tethering by the CRISPR-dCas9 strategy did not affect functional assembly of CRISPR-dCas9 complex at the ABAT promoter. Data shown as individual values, mean ± s.d. (n = 3). The P values were calculated with two-sided Student’s t-test.
Extended Data Fig. 4 |
Extended Data Fig. 4 |. Context-dependent gene activation by PAS RNA tethering.
a, c, e, g, Genome browser views of ATAC-seq, PRO-seq, Pol II ChIP-seq and H3K4me3 ChIP-seq on selected FNIP1 (a), IRF1 (c), OR2J1 (e) and DEFB129 (g) genomic regions in the absence or presence of E2 treatment. b, d, f, h, Real-time RT-PCR data showing the effect of tethering a serial of pasRNAs or control RNAs to the FNIP1 (b), IRF1 (d), OR2J1 (f) and DEFB129 (h) promoters on the respective coding gene expression in the -E2 condition by the CRISPR-dCas9 strategy. Data shown as individual values, mean ± s.d. (n = 3). The Shapiro-Wilk test was computed first to verify the normal distribution of the real-time RT-PCR data before P values were calculated with two-sided Welch’s t-test. i-k, Real-time RT-PCR data showing the effect of using the CRISPR-dCas9/VP64 (CRISPRa) strategy targeting the TMEM114 (i), OR2J1 (j) and DEFB129 (k) promoters on the respective coding gene expression in the -E2 condition. Data shown as individual values, mean ± s.d. (n = 3). The P values were calculated with two-sided Student’s t-test. l, Bar plot data showing the RPKM expression values of the genes to which dCas9-PAS RNAs were delivered. RPKM values were computed based on GRO-seq datasets in GSE41324 (combined replicates).
Extended Data Fig. 5 |
Extended Data Fig. 5 |. Higher-order structure of PAS RNA.
a, Box plot analysis of Gibbs free energy (dG) showing that PAS RNAs, in their native state, have a significantly lower minimum free energy (MFE) than synthetically random RNAs of the same length and their cognate mRNAs, suggesting that PAS RNAs may tend to form more secondary structures to maintain their stability. The synthetically random RNAs were generated with the packages kebabs and Rbioinf in R/Bioconductor version 3.12. PAS RNAs were compared with two independent synthetic random RNAs (500 nt, 1,000 nt) and their cognate mRNAs to calculate the difference of dG. The box plots denote the medians, the interquartile ranges and the whiskers. The P values were calculated with two-sided Wilcoxon test. b, Box plot analysis of z-scores showing that PAS RNAs have a higher percentage of negatively shifted z-score windows less than −1 than synthetically random RNAs of the same length and their cognate mRNAs, suggesting more local regions of potential structure in PAS RNAs. In the calculation of z-scores, we used the methodology described in ScanFold (https://github.com/moss-lab/ScanFold) that uses scanning windows of 120-nt length, and a step size of 40 nt, and generates 30 shuffled versions of the corresponding RNA sequence, using the same dinucleotide frequency. The box plots denote the medians, the interquartile ranges and the whiskers. PAS RNAs were compared with two independent sets of synthetic random RNAs (500 nt, 1,000 nt) and their cognate mRNAs to calculate the difference of z-scores. The P values were calculated with two-sided Wilcoxon test. c-e, Predicted MFE-based secondary structure of ABATpasRNA (c), MYCpasRNA (d) and TFF1pasRNA (e) by RNAfold webserver. Owing to the long length, only a partial sequence of MYCpasRNA and TFF1pasRNA was used for computational analysis. f-i, Predicted MFE-based secondary structure by RNAfold webserver and genome browser views of FAM110ApasRNA (f), FAM102ApasRNA (g) HIGD1ApasRNA (h) and KCNK6pasRNA (i). The red arrowhead indicates the upregulation of PAS RNA.
Extended Data Fig. 6 |
Extended Data Fig. 6 |. E2-dependent PR promoter activation.
a-e, Box plot analysis of ChIP-seq data for H3K4me3 (a), H3K9K14ac (b), H3K27ac (c), H3K56ac (d) and H3K122ac (e) at the PR and RSG promoters, in the absence or presence of E2 treatment. The box plots denote the medians, the interquartile ranges and the whiskers. Data were generated in two independent experiments. The P values were calculated with two-sided Wilcoxon test. f, Genome browser views of H3K4me3, H3K9K14ac, H3K27ac, H3K56ac and H3K122ac ChIP-seq on a selected TFF1 genomic region in the absence or presence of E2 treatment.
Extended Data Fig. 7 |
Extended Data Fig. 7 |. PAS RNAs license cognate coding gene transcription activation.
a-c, H3K27me3 ChIP-qPCR data showing the effect of TFF1pasRNA (a), MYCpasRNA (b) and ABATpasRNA (c) knockdown on the accumulation of H3K27me3 on the respective cognate gene promoter following E2 treatment. Data shown as individual values, mean ± s.d. (n = 3). The P values were calculated with two-sided Student’s t-test. d, H3K9me3 ChIP-qPCR data showing the effect of tethering ABATpasRNA using the CRISPR-dCas9 strategy to the TRIB2, FNIP1 and IRF1 promoters on H3K9me3 accumulation on the respective cognate coding gene promoter in the -E2 condition. Data shown as individual values, mean ± s.d. (n = 3). The P values were calculated with one-sided Student’s t-test. e, g, ChIP-seq tag distribution analysis representing the effect of E2 on Suv39H1 binding (e) and H3K27me3 (g) accumulation at PR promoters. f, h, Box plot analysis representing the effect of E2 on Suv39H1 (f) and H3K27me3 (h) occupancy at PR gene promoters and RSG promoters. The box plots denote the medians, the interquartile ranges and the whiskers. Data were generated in two independent experiments. The P values were calculated with two-sided Wilcoxon test. i, Immunoblot analysis showing no effect of TFF1pasRNA, MYCpasRNA and ABATpasRNA knockdown on KDM4B and KDM4C expression following E2 treatment. The experiment was repeated three times with similar results. See Supplementary Fig. 1 for gel source data. j, Cell lysates as described in Fig. 2m were subjected to co-immunoprecipitation with anti-Flag antibody (for flag-dCas9) followed by immunoblot analysis with antibodies as indicated. The experiment was repeated three times with similar results. See Supplementary Fig. 1 for gel source data. k, ChIP-seq tag distribution analysis displaying the effect of E2 treatment on G9a (EHMT2) binding at the PR promoters. l, Box plot analysis representing the effect of E2 on G9a binding at the PR and RSG promoters. The box plots denote the medians, the interquartile ranges and the whiskers. Data were generated in two independent experiments. The P values were calculated with two-sided Wilcoxon test. m-o, Real-time RT-PCR data showing the effect of combined knockdown of Suv39H1 and G9a in TFF1pasRNA (m), MYCpasRNA (n) and ABATpasRNA (o) knockdown MCF-7 cells by the CRISPR-Cas13a strategy on the respective cognate coding gene transcription following E2 treatment. Data shown as individual values, mean ± s.d. (n = 3). The P values were calculated with one-sided Student’s t-test. p, The profile analysis of H3K9me3 ChIP-seq, Pol II ChIP-seq and H3K9me3 ChIP-seq performed in shKDM4B/4C MCF-7 cells in the -E2 condition showing major H3K9me3 accumulation on +1 nucleosome after knockdown of KDM4B/4C.
Extended Data Fig. 8 |
Extended Data Fig. 8 |. The effect of KDM4B/KDM4C on E2-induced Pol II promoter pause release.
a, ChIP-seq tag distribution analysis representing the effect of KDM4B/4C knockdown on H3K9me3 accumulation at the PR promoters. b, Heat map of H3K9me3 ChIP-seq data representing the effect of KDM4B/4C knockdown on H3K9me3 binding at the PR promoters. c, Genome browser views of KDM4B and KDM4C ChIP-seq in the presence or absence of E2, and H3K9me3 ChIP-seq after knockdown of KDM4B and KDM4C on the TFF1 genomic region. d, ChIP-seq tag distribution analysis representing the effect of E2 on H3K36me3 accumulation at the PR promoters. e, Genome browser views of H3K36me3 ChIP-seq in the presence or absence of E2 on the TFF1 genomic region. f, Box plot analysis of the pausing ratio based on Pol II ChIP-seq data representing the effect of KDM4B/4C knockdown on the pausing ratio for PR genes and RSG following E2 treatment. The box plots denote the medians, the interquartile ranges and the whiskers. Data were generated in two independent experiments. The P values were calculated with two-sided Wilcoxon test. g, ChIP-seq tag distribution analysis representing the effect of KDM4B/4C knockdown on Pol II accumulation at PR promoters following E2 treatment. h, Schematic structure of KDM4B and KDM4C proteins. Between the JMJC domain and the double PHD/Tudor domain is the predicted IDR region, analysed by the IUPred2A online tool. i, Immunoblot analysis of full-length KDM4C and the relevant KDM4C-mutant expression in shKDM4C MCF-7 cells following E2 treatment. The experiment was repeated three times with similar results. See Supplementary Fig. 1 for gel source data. j-l, Real-time RT-PCR data showing the effect of KDM4B/4C knockdown on the expression of TFF1pasRNA (j), MYCpasRNA (k) and ABATpasRNA (l) following E2 treatment. Data shown as individual values, mean ± s.d. (n = 3). The P values were calculated with two-sided Student’s t-test.
Extended Data Fig. 9 |
Extended Data Fig. 9 |. Functional importance of HP1 in Pol II pause release.
a-c, Real-time RT-PCR data showing the effect of knockdown of HP1α, HP1β and HP1γ on TFF1 (a), MYC (b) and ABAT (c) coding gene transcription. Data shown as individual values, mean ± s.d. (n = 3). The P values were calculated with two-sided Student’s t-test. d, ChIP-seq tag distribution analysis representing the effect of E2 on HP1α binding at the PR promoters. e, Box plot analysis of HP1α ChIP-seq data (n = 1 experiment) representing the effect of E2 on HP1α binding at the PR and RSG promoters. The box plots denote the medians, the interquartile ranges and the whiskers. The P values were calculated with two-sided Wilcoxon test. f, Genome browser views of HP1α ChIP-seq (in the presence or absence of E2), HP1α (4E) mutant Bio-ChIP and HP1α (4A) mutant Bio-ChIP on the TFF1 genomic region. g, Domain map of human HP1α. Phosphorylatable serine residues, and the corresponding phosphor-mimetic glutamic acid residues and phosphor-compromised alanine residues at the N-terminal extension (NTE) of human HP1α regulating its chromodomain (CD)-H3K9me3 tail interaction are in bold. CSD, chromoshadow domain; CTE, C-terminal extension; H, hinge region. h, Bio-ChIP-seq tag distribution (n = 1 experiment) representing the effect of phosphorylation at the NTE on HP1α binding at the PR promoters. i, Box plot analysis of HP1α Bio-ChIP-seq data (n = 1 experiment) showing the effect of phosphorylation at the NTE on HP1α occupancy at the PR gene promoters and RSG promoters. The box plots denote the medians, the interquartile ranges and the whiskers. The P values were calculated with two-sided Wilcoxon test. j, Heat map of HP1α Bio-ChIP-seq data showing the effect of phosphorylation at the NTE on HP1α occupancy at the PR gene promoters and RSG promoters. k, The profiles of PRO-seq normalized tag counts, starting 3 kb upstream of the transcription start site (TSS) to 3 kb downstream of the TSS in shCTL MCF-7 cells or shHP1α/β MCF-7 cells. l, Box plot analysis of PRO-seq data representing the effect of HP1α/β knockdown on transcription of the PR genes and RSGs. The box plots denote the medians, the interquartile ranges and the whiskers. Data were generated in two independent experiments. The P values were calculated with two-sided Wilcoxon test. m, Genome browser views of PRO-seq in the presence or absence of HP1α/β knockdown on the TFF1 genomic region.
Extended Data Fig. 10 |
Extended Data Fig. 10 |. HP1-mediated stabilization of 7SK and NELFA at the promoter.
a-c, HP1α ChIP-qPCR data showing the effect of TFF1pasRNA (a), MYCpasRNA (b) and ABATpasRNA (c) knockdown on accumulation of HP1α on the respective cognate coding gene promoter following E2 treatment. Data shown as individual values, mean ± s.d. (n = 3). The P values were calculated with two-sided Student’s t-test. d-f, Real-time RT-PCR data showing the effect of knockdown of HP1α and HP1β in TFF1pasRNA (d), MYCpasRNA (e) and ABATpasRNA (f) knockdown MCF-7 cells by the CRISPR-Cas13a strategy on the respective cognate coding gene transcription. Data shown as individual values, mean ± s.d. (n = 3). The P values were calculated with two-sided Student’s t-test. g, j, 7SK ChIRC13a-seq (g) and NELFA ChIP-seq (j) tag distribution analysis representing the effect of HP1α and HP1β knockdown on 7SK (g) and NELFA (j) binding at the PR promoters. h, k, Box plot analysis of 7SK ChIRC13a-seq (n = 1 experiment) (h) and NELFA ChIP-seq (k) (n = 1 experiment) data representing the effect of HP1α and HP1β knockdown on 7SK (h) and NELFA (k) binding at the PR and RSG promoters. The box plots denote the medians, the interquartile ranges and the whiskers. The P values were calculated with two-sided Wilcoxon test. i, l, Heat map of 7SK ChIRC13a-seq (i) and NELFA ChIP-seq (l) data representing the effect of HP1α and HP1β knockdown on 7SK (i) and NELFA (l) binding at the PR promoters.
Extended Data Fig. 11 |
Extended Data Fig. 11 |. Dual role of KAP1 in transcriptional regulation.
a, Heat map showing mass spectrometry analysis of HP1-associated proteins. Identified KAP1 is shown on the right. b, Co-IP result showing interaction between HP1 and KAP1. The experiment was repeated three times with similar results. See Supplementary Fig. 1 for gel source data. c, ChIRC13a-seq tag distribution representing the effect of KAP1 knockdown on 7SK binding at the PR promoters. d, Box plot analysis of 7SK ChIRC13a-seq data representing the effect of KAP1 knockdown (n = 1 experiment) on 7SK binding at the PR and RSG promoters. The box plots denote the medians, the interquartile ranges and the whiskers. The P values were calculated with two-sided Wilcoxon test. e, Heat map of 7SK ChIRC13a-seq data representing the effect of KAP1 knockdown on 7SK binding at the PR promoters. f, ChIP-seq tag distribution analysis representing the effect of E2 on KAP1 binding at the PR promoters. g, Box plot analysis of KAP1 ChIP-seq data representing the effect of E2 on KAP1 binding at the PR and RSG promoters. The box plots denote the medians, the interquartile ranges and the whiskers. Data were generated in two independent experiments. The P values were calculated with two-sided Wilcoxon test. h, j, Box plot analysis of PRO-seq data (h) (n = 1 experiment) and Pol II S2P data (j) (n = 1 experiment) representing the effect of KAP1 knockdown on the transcription of the PR genes and RSGs following E2 treatment. The box plots denote the medians, the interquartile ranges and the whiskers. The P values were calculated with two-sided Wilcoxon test. i, The profiles of PRO-seq tag counts on PR genes from 3 kb upstream of the TSS to 3 kb downstream of TSS in shCTL MCF-7 cells and shKAP1 MCF-7 cells following E2 treatment.
Extended Data Fig. 12 |
Extended Data Fig. 12 |. Phospho-KAP1(S824) as a determinant for KAP1-mediated transcription activation.
a, ChIP-qPCR data showing the effect of E2 on accumulation of phospho-KAP1(S824) on the selective coding gene promoter. Data shown as individual values, mean ± s.d. (n = 3). The P values were calculated with two-sided Student’s t-test. b, Sequence alignment of KAP1 (wild type (WT), 835 amino acids (AA)), truncated KAP1 (WT, 754 AA) and truncated KAP1(S824A) mutant used in the KAP1 rescue experiment shown in c-e. c-e, Real-time RT-PCR data showing the effect of overexpression of full-length KAP1 or the relevant KAP1(S824A) mutants on TFF1 (c), MYC (d) and ABAT (e) coding gene transcription in KAP1 knockdown MCF-7 cells following E2 treatment. Data shown as individual values, mean ± s.d. (n = 3). The P values were calculated with two-sided Student’s t-test. f, ChIP-seq tag distribution analysis representing the effect of E2 on KAP1 binding at the 1,224 E2-responsive MegaTrans enhancers. g, Box plot analysis of PRO-seq data representing the effect of KAP1 knockdown (n = 1 experiment) on the transcription of the 1,224 E2-responsive MegaTrans enhancers and 5,694 ERα bound but less active enhancers (weak ERα enhancers) following E2 treatment. The box plots denote the medians, the interquartile ranges and the whiskers. The P values were calculated with two-sided Wilcoxon test. h, Model: the 7SK/KAP1 snRNP-associated inactive P-TEFb complex was assembled at paused PR promoters by association with H3K9me3 reader protein HP1α via H3K9me3 recognition, which is deposited by Suv39H1 H3K9me3 methyltransferase, thus keeping promoter-proximal RNA Pol II at a poised state. Upon E2 stimulation, ligand-induced transcription factor ERα/co-factors are rapidly recruited at these promoters to help poised RNA polymerase initiate transcription to accumulate PAS RNA transcripts at promoters. These transiently expressed RNA molecules, which share a similar compact stem-loop structure that is responsible for the recruitment/stabilization of KDM4B/4C H3K9me3 demethylases at promoters to erase H3K9me3, lead to decommissioning of the HP1α-KAP1-7SK snRNP complex at paused promoters to activate P-TEFb and unleash RNA Pol II transcription; unexpectedly, in response to E2, KAP1, which is a transcription repressor to stabilize the 7SK snRNP complex at paused PR promoters in basal state, is recruited to MegaTrans enhancers, phosphorylated at S824 by MegaTrans enhancer-recruited DNA-PKcs, and subsequently delivered to promoters through E2-induced enhancer-promoter looping, thus ensuring subsequent Pol II pause release for robust transcriptional activation.
Fig. 1 |
Fig. 1 |. E2 induction of Pol II pause release and PAS RNA transcription.
a, Cumulative distribution of the Pol II pausing ratio based on GRO-seq analysis (n = 3 independent experiments) for PR genes. The P value was determined by two-sided Kolmogorov-Smirnov test. b, c, Box plot analysis of GRO-seq data showing PAS RNA expression (b) and gene expression (c) at the indicated genes in response to E2. Throughout the study, we used 837 randomly selected genes (RSG) as control for box plot analysis. d, f, Box plot analysis of NELFA ChIP-seq data (d) and 7SK ChIRC13a-seq data (f) representing the effect of E2 on NELFA and 7SK binding at the indicated promoters. e, A scheme of the ChIRC13a-seq method. Lwa, Leptotrichia wadei. g, Genome browser views of the TFF1 genomic region. Chr21, chromosome 21. In b-d, f, for the box plots, the middle line denotes the median, the box represents the interquartile range and the whiskers denote 5 times the interquartile range from the upper or lower quartiles (n = 2 independent experiments). The P values were determined by two-sided Wilcoxon test.
Fig. 2 |
Fig. 2 |. The effect of the shape of PAS RNA on transcription activation.
a-c, Reverse transcription with quantitative PCR (RT-qPCR) data showing the effect of PAS RNA knockdown on the respective gene expression (TFF1 (a), MYC (b) and ABAT (c)) following E2 treatment. d, A scheme of the CRISPR- dCas9-mediated RNA tethering method. TSS, transcription start site. e, g, i, RT-qPCR data showing the effect of tethering PAS RNAs or control RNAs to the indicated promoters. Data are shown as individual values, mean ± s.d. (n = 3). The P values were determined by two-sided Welch’s t-test. f, h, Genome browser views of the TRIB2 (f) and TMEM114 (h) genomic regions. ATAC-seq, assay for transposase-accessible chromatin using sequencing; PRO-seq, precision run-on sequencing. j, Predicted secondary structure of ABAT PAS RNA by the RNAfold webserver. The 3D structure dotted by the blue square is predicted by the RNAcomposer program. k, SHAPE-MaP reactivity profiles of ABAT PAS RNA. l, Secondary structure models based on SHAPE-MaP reactivities for ABAT PAS RNA. m, RT-qPCR data showing the effect of tethering ABAT PAS RNA or the relevant ABAT PAS RNA mutants to the ABAT promoter. ABAT PAS RNAΔSL, truncated ABAT PAS RNA lacking the clustered stem-loop structure; ABAT PAS RNA/SL, truncated ABAT PAS RNAs with the clustered stem-loop structure. In a-c, m, data are shown as individual values, mean ± s.d. (n = 3). The P values were determined by one-sided Student’s t-test.
Fig. 3 |
Fig. 3 |. H3K9me3 erasure at the promoter by PAS RNA.
a-f, ChIP-qPCR data showing the effect of PAS RNA knockdown on the accumulation of Pol II (a-c) and H3K9me3 (d-f) at the respective promoter. ‘p’ denotes promoter. g, ChIP- qPCR data showing the effect of tethering ABAT PAS RNA to the ABAT promoter on the accumulation of H3K9me3 at the ABAT promoter. h, j, ChIP-seq tag distribution analysis representing the effect of E2 on the binding of KDM4B (h) and KDM4C (j) at PR promoters. i, k, l, Box plot analysis representing the effect of E2 on the binding of KDM4B (i), KDM4C (k) and H3K9me3 (l) at the indicated promoters. The box plot parameters are the same as in Fig. 1 (n = 2 independent experiments). The P values were determined by two-sided Wilcoxon test. m, Genome browser views of the TFF1 promoter region. n-s, ChIP-qPCR data showing the effect of PAS RNA knockdown on the accumulation of KDM4B (n-p) and KDM4C (q-s) on the respective promoter. In a-g, n-s, data are shown as individual values, mean ± s.d. (n = 3). The P values were determined by one-sided Student’s t-test.
Fig. 4 |
Fig. 4 |. PAS RNA stabilization of KDM4B and KDM4C at the promoter.
a-c, Box plot analysis representing the effect of KDM4B/KDM4C knockdown on the accumulation of H3K9me3 (a), the effect of E2 on H3K36me3 (b) at the indicated promoters, and the effect of KDM4B/KDM4C knockdown on Pol II occupancy over the gene bodies of the indicated genes (c). The box plot parameters are the same as in Fig. 1 (n = 2 independent experiments). The P values were determined by two-sided Wilcoxon test. d, e, Cumulative distribution of the Pol II pausing ratio based on Pol II ChIP-seq analysis (n = 2 independent experiments) of PR genes following E2 treatment in short hairpin control (shCTL) MCF-7 cells (d) or shKDM4B/KDM4C MCF-7 cells (e). The P values were determined by two-sided Kolmogorov-Smirnov test. f, In vitro immunoprecipitation (IP)-RT-PCR data showing the required intrinsically disordered region (IDR) of KDM4C for interaction with ABAT PAS RNA. The experiment was repeated three times with similar results. Gel source data are available in Supplementary Fig. 1. Flag-KDM4CΔPT denotes flag-tagged KDM4C-mutant protein lacking both the PHD and Tudor domain. g-i, RT-qPCR data showing the rescue effect of full-length KDM4C or the KDM4C mutants on the indicated gene expression (ABAT (g), MYC (h) and TFF1 (i)). Data are shown as individual values, mean ± s.d. (n = 3). The P values were determined by two-sided Student’s t-test.

References

    1. Engreitz JM et al.Local regulation of gene expression by lncRNA promoters, transcription and splicing. Nature 539, 452–455 (2016). - PMC - PubMed
    1. Sigova AA et al.Divergent transcription of long noncoding RNA/mRNA gene pairs in embryonic stem cells. Proc. Natl Acad. Sci. USA 110, 2876–2881 (2013). - PMC - PubMed
    1. Flynn RA, Almada AE, Zamudio JR & Sharp PA Antisense RNA polymerase II divergent transcripts are P-TEFb dependent and substrates for the RNA exosome. Proc. Natl Acad. Sci. USA 108, 10460–10465 (2011). - PMC - PubMed
    1. Gupta RA et al.Long non-coding RNA HOTAIR reprograms chromatin state to promote cancer metastasis. Nature 464, 1071–1076 (2010). - PMC - PubMed
    1. Chu HP et al.TERRA RNA antagonizes ATRX and protects telomeres. Cell 170, 86–101 (2017). - PMC - PubMed

Publication types

MeSH terms