

EEG-Based Intersubject Correlations Reflect Selective Attention in a Competing Speaker Scenario
- PMID: 34194296
- PMCID: PMC8236636
- DOI: 10.3389/fnins.2021.685774
EEG-Based Intersubject Correlations Reflect Selective Attention in a Competing Speaker Scenario
Abstract
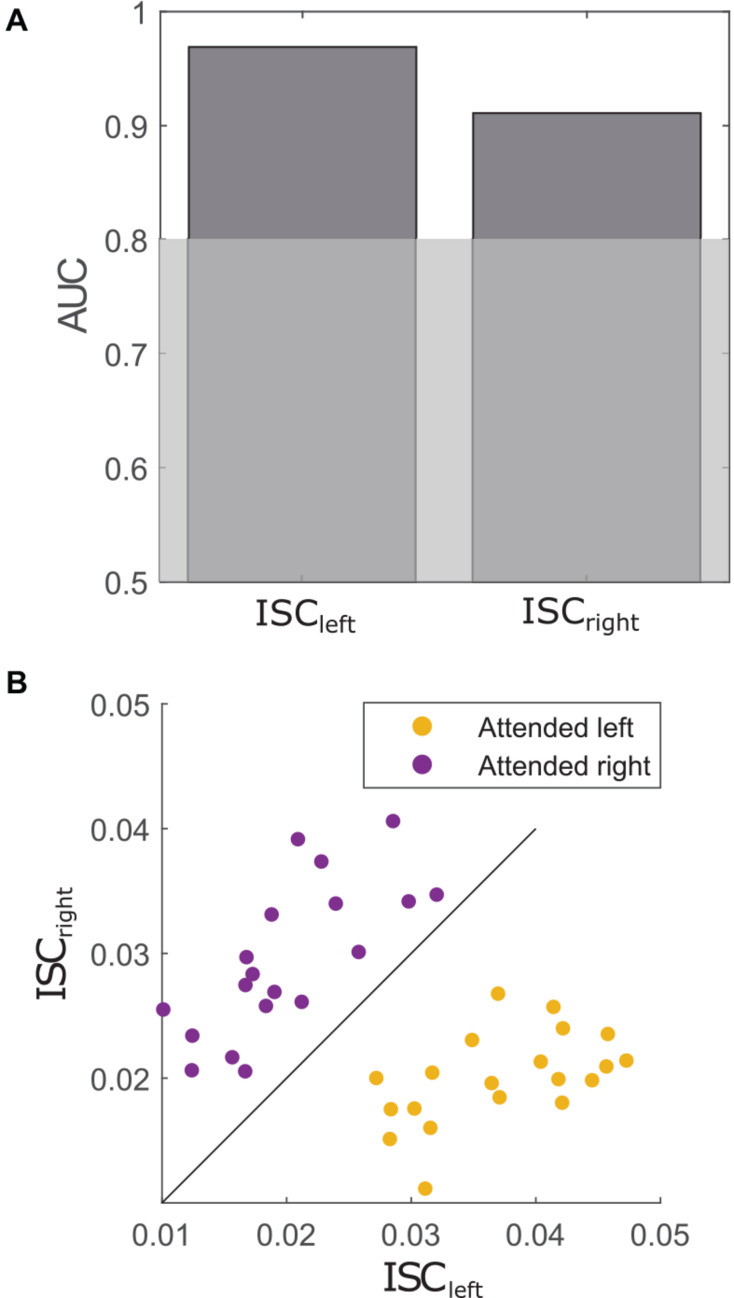
Several solutions have been proposed to study the relationship between ongoing brain activity and natural sensory stimuli, such as running speech. Computing the intersubject correlation (ISC) has been proposed as one possible approach. Previous evidence suggests that ISCs between the participants' electroencephalogram (EEG) may be modulated by attention. The current study addressed this question in a competing-speaker paradigm, where participants (N = 41) had to attend to one of two concurrently presented speech streams. ISCs between participants' EEG were higher for participants attending to the same story compared to participants attending to different stories. Furthermore, we found that ISCs between individual and group data predicted whether an individual attended to the left or right speech stream. Interestingly, the magnitude of the shared neural response with others attending to the same story was related to the individual neural representation of the attended and ignored speech envelope. Overall, our findings indicate that ISC differences reflect the magnitude of selective attentional engagement to speech.
Keywords: EEG; attended speaker paradigm; correlated component analysis; intersubject correlation; naturalistic stimuli; selective auditory attention; speech envelope tracking.
Copyright © 2021 Rosenkranz, Holtze, Jaeger and Debener.
Conflict of interest statement
The authors declare that the research was conducted in the absence of any commercial or financial relationships that could be construed as a potential conflict of interest.
Figures


Similar articles
-
Ear-EEG Measures of Auditory Attention to Continuous Speech.Front Neurosci. 2022 May 3;16:869426. doi: 10.3389/fnins.2022.869426. eCollection 2022. Front Neurosci. 2022. PMID: 35592265 Free PMC article.
-
The Right Temporoparietal Junction Supports Speech Tracking During Selective Listening: Evidence from Concurrent EEG-fMRI.J Neurosci. 2017 Nov 22;37(47):11505-11516. doi: 10.1523/JNEUROSCI.1007-17.2017. Epub 2017 Oct 23. J Neurosci. 2017. PMID: 29061698 Free PMC article.
-
Are They Calling My Name? Attention Capture Is Reflected in the Neural Tracking of Attended and Ignored Speech.Front Neurosci. 2021 Mar 22;15:643705. doi: 10.3389/fnins.2021.643705. eCollection 2021. Front Neurosci. 2021. PMID: 33828451 Free PMC article.
-
Neural Encoding of Attended Continuous Speech under Different Types of Interference.J Cogn Neurosci. 2018 Nov;30(11):1606-1619. doi: 10.1162/jocn_a_01303. Epub 2018 Jul 13. J Cogn Neurosci. 2018. PMID: 30004849 Review.
-
Intersubject correlation as a predictor of attention: a systematic review.BMC Psychol. 2025 May 22;13(1):546. doi: 10.1186/s40359-025-02879-7. BMC Psychol. 2025. PMID: 40405228 Free PMC article.
Cited by
-
Ear-EEG Measures of Auditory Attention to Continuous Speech.Front Neurosci. 2022 May 3;16:869426. doi: 10.3389/fnins.2022.869426. eCollection 2022. Front Neurosci. 2022. PMID: 35592265 Free PMC article.
-
Predicting contrast sensitivity functions with digital twins.Sci Rep. 2024 Oct 15;14(1):24100. doi: 10.1038/s41598-024-73859-x. Sci Rep. 2024. PMID: 39406885 Free PMC article.
-
Neural speech tracking in a virtual acoustic environment: audio-visual benefit for unscripted continuous speech.Front Hum Neurosci. 2025 Apr 9;19:1560558. doi: 10.3389/fnhum.2025.1560558. eCollection 2025. Front Hum Neurosci. 2025. PMID: 40270565 Free PMC article.
-
Attention-Driven Modulation of Auditory Cortex Activity during Selective Listening in a Multispeaker Setting.J Neurosci. 2024 Apr 10;44(15):e1157232023. doi: 10.1523/JNEUROSCI.1157-23.2023. J Neurosci. 2024. PMID: 38388426 Free PMC article.
-
Neural Speech Tracking during Selective Attention: A Spatially Realistic Audiovisual Study.eNeuro. 2025 Jun 24;12(6):ENEURO.0132-24.2025. doi: 10.1523/ENEURO.0132-24.2025. Print 2025 Jun. eNeuro. 2025. PMID: 40456616 Free PMC article.
References
-
- Cherry E. C. (1953). Some experiments on the recognition of speech, with one and with two ears. J. Acoust. Soc. Am. 25 975–979. 10.1121/1.1907229 - DOI
LinkOut - more resources
Full Text Sources