. 2021 Jun 14:12:625732.
doi: 10.3389/fimmu.2021.625732. eCollection 2021.

Expression of ACE2, Soluble ACE2, Angiotensin I, Angiotensin II and Angiotensin-(1-7) Is Modulated in COVID-19 Patients

Affiliations

Expression of ACE2, Soluble ACE2, Angiotensin I, Angiotensin II and Angiotensin-(1-7) Is Modulated in COVID-19 Patients

Ikram Omar Osman et al. Front Immunol. .

Abstract

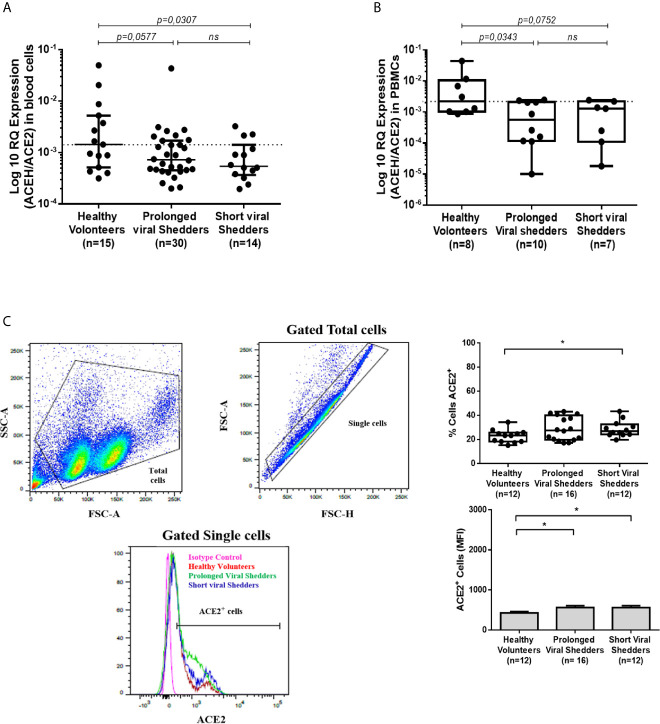
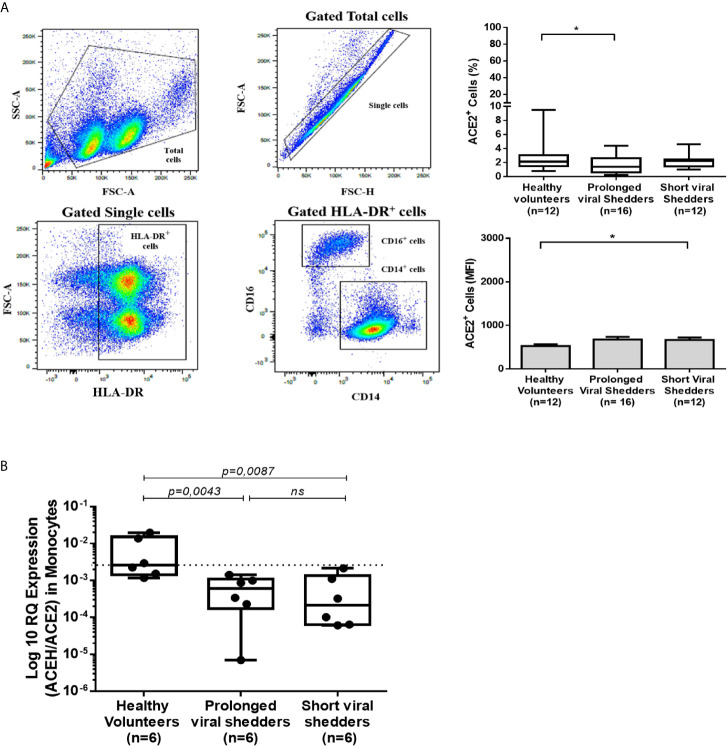
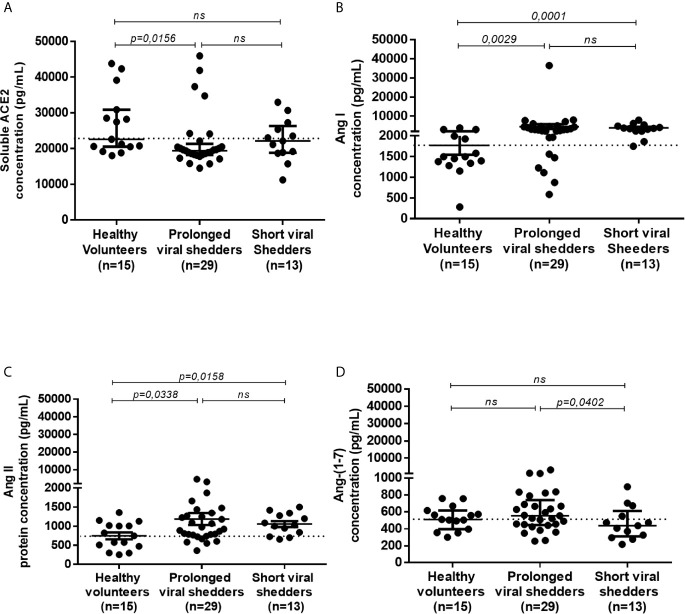
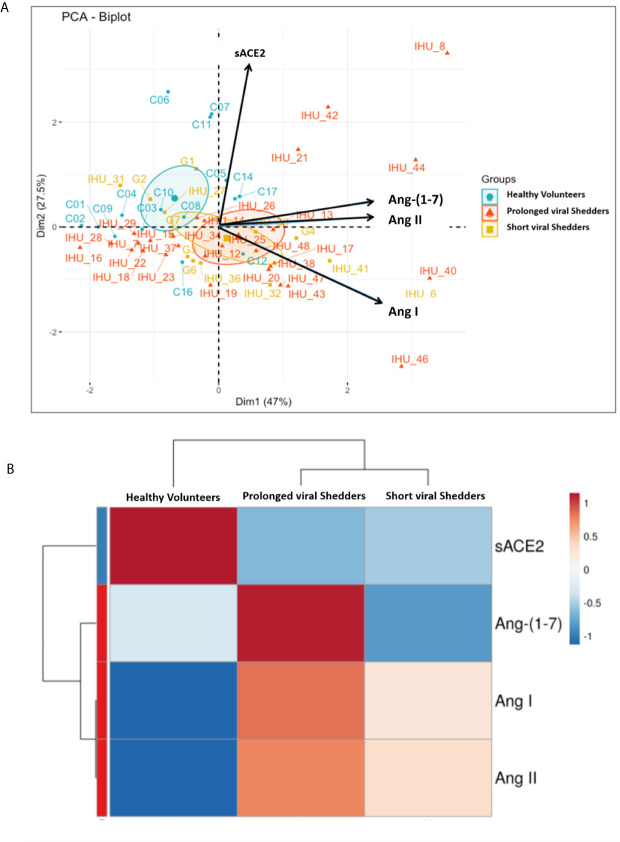
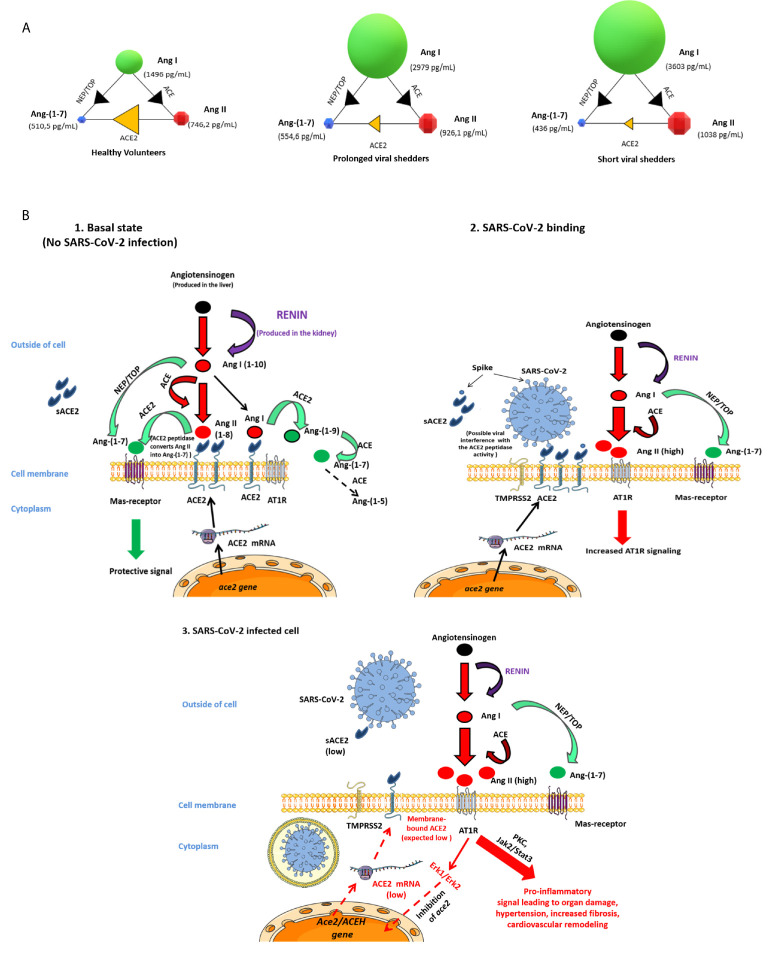
The etiological agent of COVID-19 SARS-CoV-2, is primarily a pulmonary-tropic coronavirus. Infection of alveolar pneumocytes by SARS-CoV-2 requires virus binding to the angiotensin I converting enzyme 2 (ACE2) monocarboxypeptidase. ACE2, present on the surface of many cell types, is known to be a regulator of blood pressure homeostasis through its ability to catalyze the proteolysis of Angiotensin II (Ang II) into Angiotensin-(1-7) [Ang-(1-7)]. We therefore hypothesized that SARS-CoV-2 could trigger variations of ACE2 expression and Ang II plasma concentration in SARS-CoV-2-infected patients. We report here, that circulating blood cells from COVID-19 patients express less ACE2 mRNA than cells from healthy volunteers. At the level of circulating cells, this ACE2 gene dysregulation mainly affects the monocytes, which also show a lower expression of membrane ACE2 protein. Moreover, soluble ACE2 (sACE2) plasma concentrations are lower in prolonged viral shedders than in healthy controls, while the concentration of sACE2 returns to normal levels in short viral shedders. In the plasma of prolonged viral shedders, we also found higher concentrations of Ang II and angiotensin I (Ang I). On the other hand, the plasma levels of Ang-(1-7) remains almost stable in prolonged viral shedders but seems insufficient to prevent the adverse effects of Ang II accumulation. Altogether, these data evidence that the SARS-CoV-2 may affect the expression of blood pressure regulators with possible harmful consequences on COVID-19 outcome.

Keywords: ACE2 (Angiotensin Converting Enzyme-2); COVID-19; Hypertension; Renin – Angiotensin – Aldosterone System; SARS – CoV – 2.


Conflict of interest statement

CD declares owning Sanofi and Merck shares. The remaining authors declare that the research was conducted in the absence of any commercial or financial relationships that could be construed as a potential conflict of interest.

Figures

Figure 1
Figure 1
ACE2 mRNA expression in blood cells and PBMCs, and monocytes from COVID-19 patients and healthy volunteers. (A) Expression of ACE2 mRNA in circulating blood cells (both mononuclear and polynuclear cells) from the prolonged viral shedders (n = 30) and the short viral shedders (n = 14) groups, compared to a healthy volunteers control group (n= 15). The results (presented as median with confidence interval) are expressed as log10 RQ were RQ = 2(−ΔCT). (B) Expression of ACE2 mRNA in peripheral blood mononuclear cells (PBMCs) samples from the three different groups studied: prolonged viral shedders (n = 10), short viral shedders (n = 7), and healthy volunteers (n= 8). The data are expressed as log10 RQ were RQ = 2(−ΔCT). (C) Flow cytometry analysis of ACE2 expression at the surface of total blood cells from prolonged viral shedders (n=16) and short viral shedders (n=12) versus total blood cells from healthy volunteers (n=12). The left panels show the gating parameter chosen (from individual to individual, between 8 and 40% of the total blood cells express ACE2 at their surface); the upper right panel indicates the percent of cells expressing ACE2 while the lower right panel is an histogram representing the mean fluorescence intensity (MFI) The Mann–Whitney test was used for the statistical analysis of all the data. The result was considered significant when the p value < 0.05: *; ns for not significant result.
Figure 2
Figure 2
ACE2 expression in HLA-DR+/CD14+ monocytes from COVID-19 patients and healthy volunteers. (A) Flow cytometry analysis of ACE2 protein expression at the surface of different cell populations during COVID-19. The figure illustrates the results obtained with the HLA-DR+/CD14+ population while data obtained with respect to other cell populations are presented in the Supplementary Figure S1 . The gating (left panels) was performed using different cluster differentiation-specific mAb (CD14, HLA-DR). The right panels show the percent of monocytes expressing ACE2 (upper right panel) and their ACE2 mean fluorescence intensity (lower right panel). (B) Analysis of ACE2 mRNA expression in monocytic cells (simply selected by adherence to tissue culture plates) using qRT-PCR. Monocytic cells from prolonged viral shedders (n = 6), short viral shedders (n = 6), and healthy donors (n = 6), were tested for ACE2 mRNA expression. The data are expressed as log10 RQ were RQ = 2(−ΔCT). Mann–Whitney test was used for the statistical analysis of all data. *p value < 0.05; ns, not significant.
Figure 3
Figure 3
ELISA quantification of the sACE2 protein, and angiotensin metabolites Ang I, Ang II, and Ang-(1-7), in different groups of COVID-19 patients and healthy volunteers. Quantification of sACE2 (A), Ang I (B), Ang II (C), and Ang-(1-7) (D) in the plasma of prolonged viral shedders (n=29) and short viral shedders (n=13) compared to the healthy volunteers control group (n=15), using antigen-specific ELISA. The results are presented as median with confidence interval. The Mann–Whitney test was used for the statistical analysis. ns, not significant.
Figure 4
Figure 4
(A) Representation of the principal component analysis (PCA) biplot (score plot + loading plot). All patient codes and clinical results were deidentified before being made available to the principal investigator (B) Hierarchical clustering heatmap analysis (each colored cell on the map corresponds to a concentration value) of the different angiotensin metabolites in each group.
Figure 5
Figure 5
Schematic representation of the possible dysfunction of the angiotensin metabolites pathway in COVID-19 patients. (A) Modelization of the concentration of angiotensin metabolites in plasma of healthy volunteers, prolonged viral shedders, and short viral shedders. For each group, the individual circles indicate the metabolite median concentrations, shown in pg/mL. The arrows between the circles mark the catalyzing reactions mediated by the indicated enzymes. (B) Schematic diagram of the renin-angiotensin system (RAS) cascade in a normal physiological state and in COVID-19 patients. Renin cleaves Angiotensinogen to Ang I which is further processed to the vasoconstrictor Ang II peptide by ACE. The upper left panel illustrates the Ang II pathway of Ang-(1-7) biosynthesis where ACE2 converts Ang II to Ang-(1-7) and also Ang I to Ang-(1-9) next converted in Ang-(1-7) by ACE peptidase, leading to protective signal through MAS-receptor. This is the physiological state. The upper-right panel illustrates the possible dysfunction of signals when SARS-CoV-2 is attached to its ACE2 receptor. Under this condition Ang-(1-7) synthesis through ACE2 is likely decreased, Ang II accumulates and, increased Ang II binding to AT1R - leads to proinflammatory signals that ultimately will trigger both tissues damage (in particular lungs and heart) and hypertension. The lower - panel illustrates that during COVID-19, the ACE2 mRNA expression is reduced leading to low surface expression of ACE2 (and plasma sACE2), Ang II is in excess in plasma, yet Ang-(1-7) remains synthesized through the NEP/TOP alternative pathway where neprilysin (NEP) and thimet oligopeptidase (TOP) convert Ang I to Ang-(1-7).

References

    1. Zhou P, Yang XL, Wang XG, Hu B, Zhang L, Zhang W, et al. . A Pneumonia Outbreak Associated With a New Coronavirus of Probable Bat Origin. Nature (2020) 579:270–3. 10.1038/s41586-020-2012-7 - DOI - PMC - PubMed
    1. Afelt A, Frutos R, Devaux C. Bats, Coronaviruses, and Deforestation: Toward the Emergence of Novel Infectious Diseases? Front Microbiol (2018) 9:702. 10.3389/fmicb.2018.00702 - DOI - PMC - PubMed
    1. Rota PA, Oberste MS, Monroe SS, Nix WA, Campagnoli R, Icenogle JP, et al. . Characterization of a Novel Coronavirus Associated With Severe Acute Respiratory Syndrome. Science (2003) 300:1394–9. 10.1126/science.1085952 - DOI - PubMed
    1. Marra MA, Jones SJ, Astell CR, Holt RA, Brooks-Wilson A, Butterfield YS, et al. . The Genome Sequence of the SARS-Associated Coronavirus. Science (2003) 300:1399–404. 10.1126/science.1085953 - DOI - PubMed
    1. Ge XY, Li JL, Yang XL, Chmura AA, Zhu G, Epstein JH, et al. . Isolation and Characterization of a Bat SARS-Like Coronavirus That Uses the ACE2 Receptor. Nature (2013) 503:535–8. 10.1038/nature12711 - DOI - PMC - PubMed

Publication types

MeSH terms