. 2021 Jun 22;12(13):1214-1229.
doi: 10.18632/oncotarget.27992.

Human papilloma virus circulating tumor DNA assay predicts treatment response in recurrent/metastatic head and neck squamous cell carcinoma

Affiliations

Human papilloma virus circulating tumor DNA assay predicts treatment response in recurrent/metastatic head and neck squamous cell carcinoma

Catherine T Haring et al. Oncotarget. .

Abstract

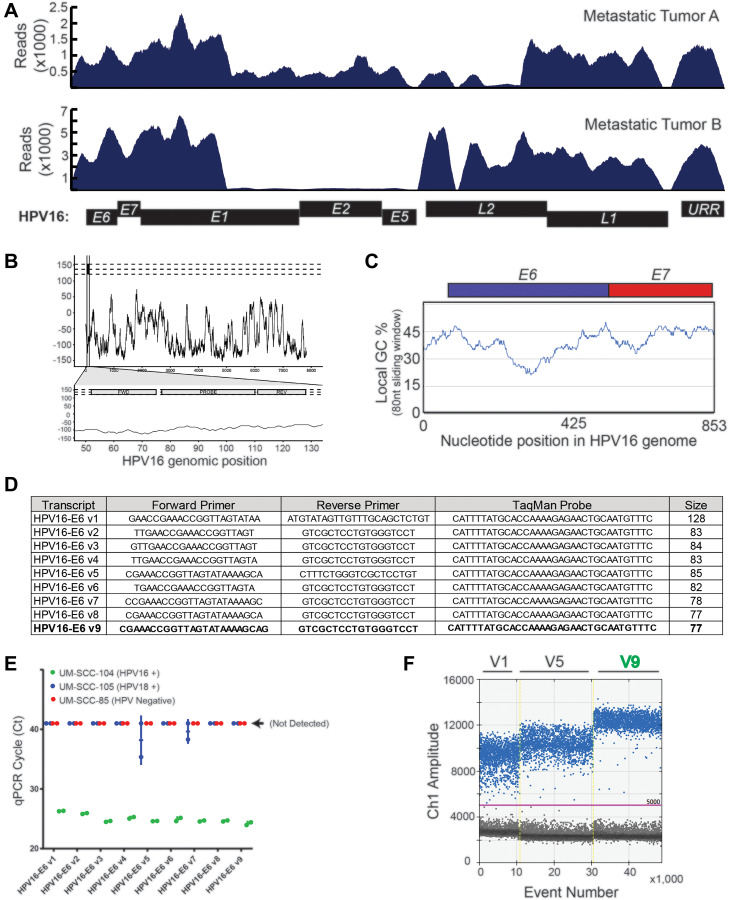
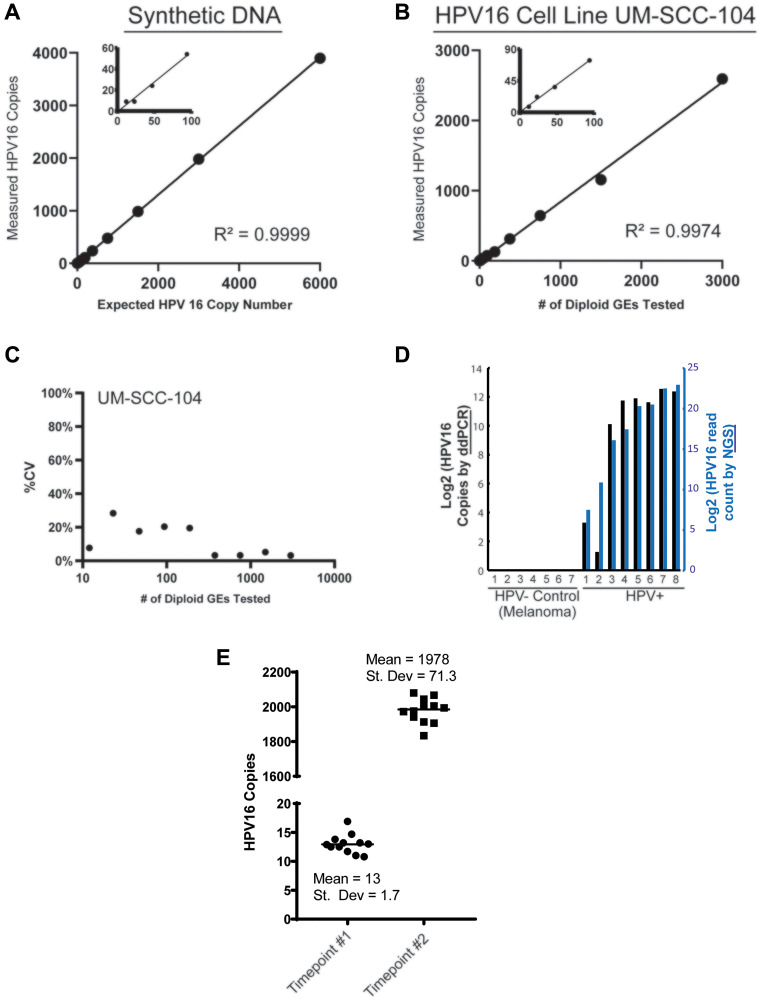
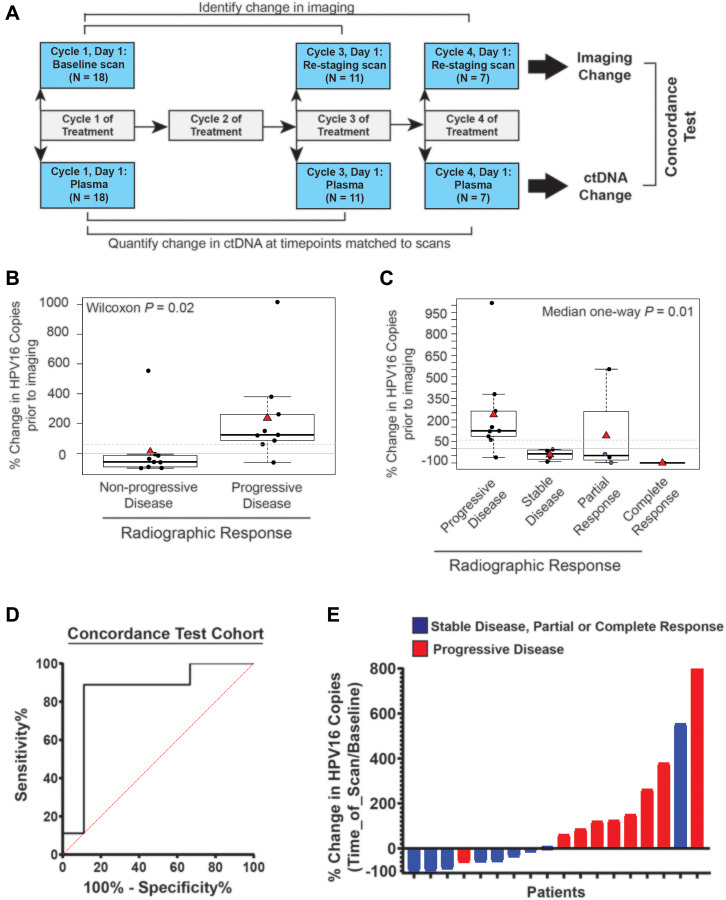
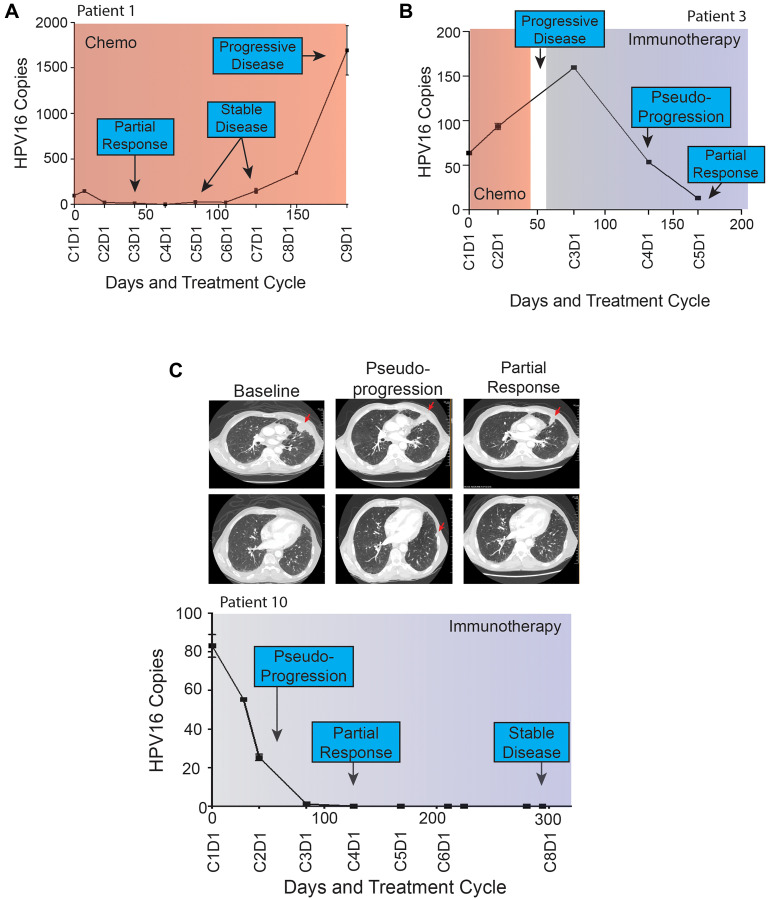
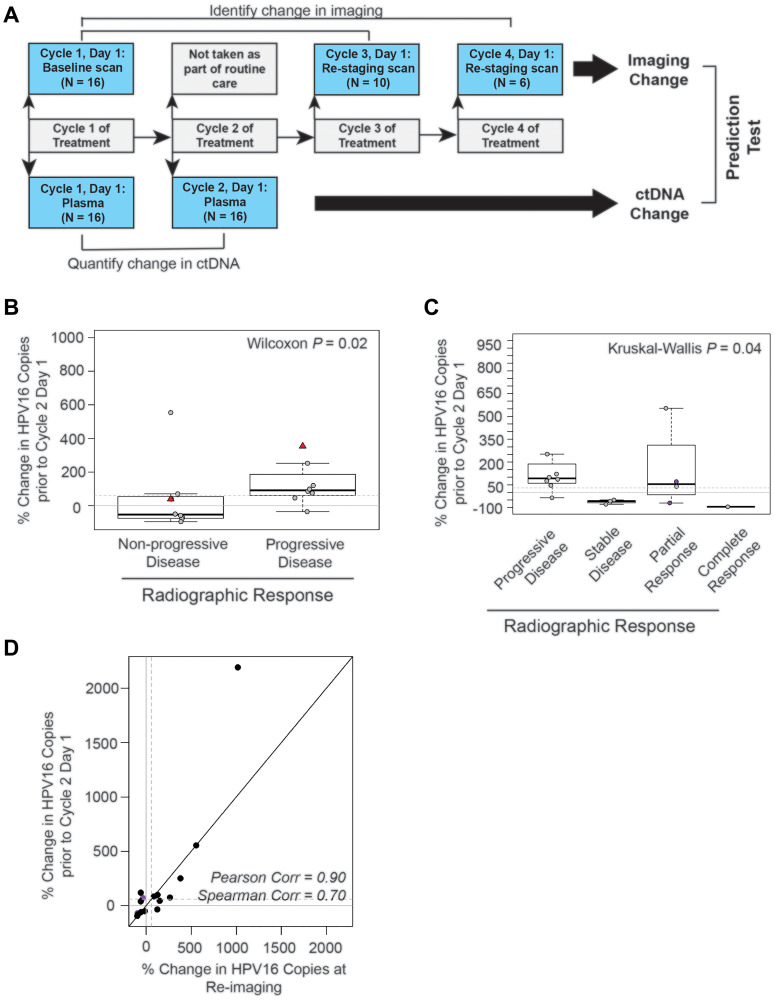
Despite the rising incidence of human papillomavirus related (HPV+) oropharyngeal squamous cell carcinoma (OPSCC), treatment of metastatic disease remains palliative. Even with new treatments such as immunotherapy, response rates are low and can be delayed, while even mild tumor progression in the face of an ineffective therapy can lead to rapid death. Real-time biomarkers of response to therapy could improve outcomes by guiding early change of therapy in the metastatic setting. Herein, we developed and analytically validated a new droplet digital PCR (ddPCR)-based assay for HPV16 circulating tumor DNA (ctDNA) and evaluated plasma HPV16 ctDNA for predicting treatment response in metastatic HPV+ OPSCC. We found that longitudinal changes HPV16 ctDNA correlate with treatment response and that ctDNA responses are observed earlier than conventional imaging (average 70 days, range: 35-166). With additional validation in multi-site studies, this assay may enable early identification of treatment failure, allowing patients to be directed promptly toward clinical trials or alternative therapies.

Keywords: HPV; circulating tumor DNA; ctDNA; head and neck cancer; oropharyngeal cancer.


Conflict of interest statement

CONFLICTS OF INTEREST The study team has filed an invention disclosure on the HPV16 ctDNA assay and the University of Michigan intends to file a patent on the assay technology.

Figures

Figure 1
Figure 1. HPV16 plasma ctDNA assay development.
(A) Targeted capture NGS data for the two HPV16+ R/M HNSCC patients with sufficient biopsy material for sequencing are shown. High density HPV16 probes were used for capture, and the absolute read mapping to the reference HPV genome is shown. (B) A continuous black line is plotted, representing the maximum “global-local” alignment score (y-axis) calculated between the HPV18 genomic sequence and each 1 nt-offset 18-mer sequence extracted from the HPV16 genome. The scores are plotted corresponding to the start position of each window. The three horizontal dashed lines indicate the maximum pairwise alignment score for the 18-mer sequence with 0, 2 or 4 “N” mutations randomly introduced into the 18-mer reverse primer sequence. The lower plot zooms in on the region encompassing the expected PCR amplicon, and the locations of the forward, reverse and probe annealing sites are indicated. (C) Percent of GC-content was calculated within an 80 nt sliding window. The genomic region of focus for assay design was plotted on the x-axis, such that the early region through nucleotide 853 (end of HPV16_E7) is shown. (D) Sequences of the nine different HPV16 primer-probe sets evaluated. (E) Results of amplification using each of the nine primer-probe sets on cell line genomic DNA (as indicated) was determined by quantitative, real-time PCR. UM-SCC-105, which is HPV18 positive was used as a specificity control, and UM-SCC-85, which is HPV negative, was used as a negative control. Ct value on the y-axis represents the cycle threshold value obtained in each case. (F) Three prioritized probes were evaluated on UM-SCC-104 cell line genomic DNA. Droplet generation, PCR, and droplet reading were performed and rain drop plots are shown.
Figure 2
Figure 2. Analytical validation of HPV16 ctDNA droplet digital PCR assay.
(A) Plot shows ddPCR assay results from a 2-fold dilution series (cumulative of 3 replicates) to determine the limit of detection (LOD) and reportable range of HPV16 E6 ctDNA. The expected copies of a 87bp synthetic DNA fragment containing the 77bp amplicon region of the HPV16 E6 V9 assay, spiked into a human genomic DNA matrix (600,000 diploid GEs per data point) are shown on the x-axis, with the number of copies measured by the ddPCR analysis indicated on the y-axis. (B) The expected diploid GEs of HPV16 E6 in UM-SCC-104 cell line DNA (x-axis) is plotted against the number of copies measured by the ddPCR a (y-axis; cumulative of 3 replicates). Based on the data shown, the LOD in both dilution series analyses (i.e., synthetic HPV16 E6 DNA fragment in (A) and UM-SCC-104 cell line DNA in (B)) was calculated to be < 5 copies per 20 uL reaction (see Materials and Methods). No positive droplets were observed when only HindIII digested human genomic DNA (200,000 diploid GEs per 20 ul reaction) was used as a non-HPV template (n = 15). (C) The plot shows % CV observed for HPV16_E6 measured copy number at different dilutions plotted against the number of diploid GEs (converted to log10) of the UM-SCC-104 cell line DNA that was tested. (D) Tumor DNA extracted from FFPE-tumor specimens was analyzed with the HPV16 ddPCR assay. 7 melanomas were used as absolute HPV- samples and compared to 8 p16+ HNSCC tumors using the ddPCR assay (black bars), and compared to the HPV read counts from NGS (blue bars). (E) Multiple aliquots of plasma from one HPV16+ HNSCC patients obtained at two separate time points, with low and high ctDNA levels, were used for analysis of variance in the sample processing and analysis protocol.
Figure 3
Figure 3. Time point matched changes in HPV16 ctDNA copies are highly concordant with changes in radiographic imaging in recurrent and metastatic HNSCC patients.
(A) Schematic timeline representation of the cohort to evaluate the correlation of change in HPV16 ctDNA and change in imaging. The change in radiographic response between each patient’s baseline and re-staging CT scans (top bars) were compared to change in HPV16 ctDNA copies between a sample collected synchronously with imaging and a baseline sample (bottom bar). For this cohort, we were able to obtain plasma on imaging matched time points for 18 total treatment series. (B) Box-plot analysis. A Wilcoxon test was performed to assess the difference between percent change in HPV16 ctDNA in patients with progressive disease (PD) and those deriving benefit (non-PD) on restaging imaging. The dotted line indicates a 60% change as identified in ROC curve analysis. (C) Box-plot analysis. Median one-way analysis tests were performed to evaluate for differences in percent change of HPV ctDNA between patients with progressive disease (PD), stable disease (SD), partial response (PR), and complete response (CR) on restaging imaging. Median one-way analysis demonstrated statistically significant changes across response categories (p = 0.01). The dotted line indicates a 60% change as identified in ROC curve analysis. The two purple circles highlight patients whom were found to have pseudoprogression. (D) ROC curve analysis was performed and identified a ≥ 60% increase in HPV16 ctDNA being associated with the optimal sensitivity and specificity for predication of progression on radiographic imaging. (E) A waterfall plot demonstrates each patient’s percent change in HPV16 ctDNA level relative to baseline at the time of re-imaging. Color coding indicates radiographic response as indicated.
Figure 4
Figure 4
(AC) Patient HPV16 ctDNA Levels and Treatment Histories. Plasma HPV16 ctDNA levels (copies per 1 μL) measured over time in patients with p16+ R/M HPV+ OPSCC (A–C). On the X-axis is days since study enrollment as well as cycle and day (CxDx) of treatment cycle. Colored boxes represent treatment courses (chemo = chemotherapy, immune = immunotherapy). Radiographic response are noted in each graph. Panel (A) highlights HPV16 ctDNA identifying progression more than 100 days prior to radiographic imaging. (B and C) highlight patients with radiographic pseudoprogression while treated with immunotherapy. Select serial CT images are shown for patient 10 at baseline, identification of pseudoprogression, and confirmatory imaging demonstrating partial response. A left pleural based soft tissue metastasis (top row) was initially noted to increase in size abutting the mediastinum, prior to decreasing in size dramatically. Similarly, a small sub-centimeter pleural based nodule (bottom row) initially grew to 1.1 cm prior to resolving completely on confirmatory imaging.
Figure 5
Figure 5. The absolute change in HPV16 ctDNA copies after one cycle of treatment predicts radiographic response in recurrent and metastatic HNSCC patients.
(A) Schematic timeline representation of the design of the cohort to evaluate the predictive value of HPV16 ctDNA after one cycle of treatment. Change in radiographic response between each patient’s baseline and re-staging CT scans (top bars) were compared to change in HPV16 ctDNA copies between the post-cycle 1 of treatment time point and baseline (bottom bar). For this cohort, we were able to obtain plasma after the first cycle of treatment for 16 of the 18 potential treatment series as two patients missed blood collection; therefore, the total N analyzed is 16. (B) Box-plot analysis. Wilcoxon test was performed to assess the difference between percent change in HPV16 ctDNA after one cycle of treatment in patients with progressive disease (PD) and those deriving benefit (non-PD). The dotted line indicates a 60% change as identified in previous ROC curve analysis. (C) Box-plot analysis. The Kruskal-Wallis analysis test were performed to evaluate for differences in percent change of HPV ctDNA after one cycle of treatment between patients with progressive disease (PD), stable disease (SD), partial response (PR), and complete response (CR) on restaging imaging. Kruskal-Wallis test demonstrated statistically significant changes across response categories (p = 0.04). The dotted line indicates a 60% change. The purple circles highlight patients with pseudoprogression. (D) Scatter plot of percent change in HPV16 ctDNA observed in the draw after one cycle of treatment and the percent change in the blood drawn synchronous with restaging imaging. Spearman and Pearson’s rho is reported to assess the magnitude of correlation.

Similar articles

Cited by

References

    1. Siegel RL, Miller KD, Jemal A. Cancer statistics, 2018. CA Cancer J Clin. 2018; 68:7–30. 10.3322/caac.21442. - DOI - PubMed
    1. Ferlay J, Soerjomataram I, Dikshit R, Eser S, Mathers C, Rebelo M, Parkin DM, Forman D, Bray F. Cancer incidence and mortality worldwide: sources, methods and major patterns in GLOBOCAN 2012. Int J Cancer. 2015; 136:E359–86. 10.1002/ijc.29210. - DOI - PubMed
    1. Marur S, Forastiere AA. Head and neck cancer: changing epidemiology, diagnosis, and treatment. Mayo Clin Proc. 2008; 83:489–501. 10.4065/83.4.489. - DOI - PubMed
    1. Vermorken JB, Specenier P. Optimal treatment for recurrent/metastatic head and neck cancer. Ann Oncol. 2010. (Suppl 7); 21:vii252–61. 10.1093/annonc/mdq453. - DOI - PubMed
    1. Forastiere AA, Goepfert H, Maor M, Pajak TF, Weber R, Morrison W, Glisson B, Trotti A, Ridge JA, Chao C, Peters G, Lee DJ, Leaf A, et al.. Concurrent chemotherapy and radiotherapy for organ preservation in advanced laryngeal cancer. N Engl J Med. 2003; 349:2091–98. 10.1056/NEJMoa031317. - DOI - PubMed

LinkOut - more resources