

Binding characteristics of staphylococcal protein A and streptococcal protein G for fragment crystallizable portion of human immunoglobulin G
- PMID: 34194664
- PMCID: PMC8217638
- DOI: 10.1016/j.csbj.2021.05.048
Binding characteristics of staphylococcal protein A and streptococcal protein G for fragment crystallizable portion of human immunoglobulin G
Abstract
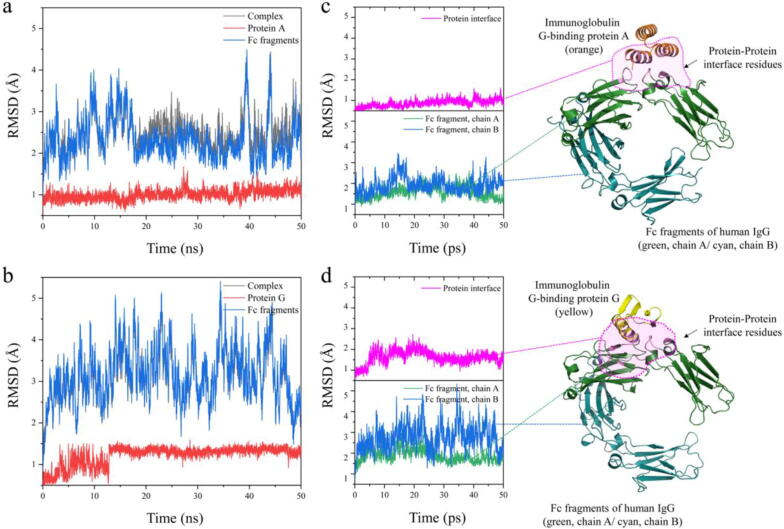
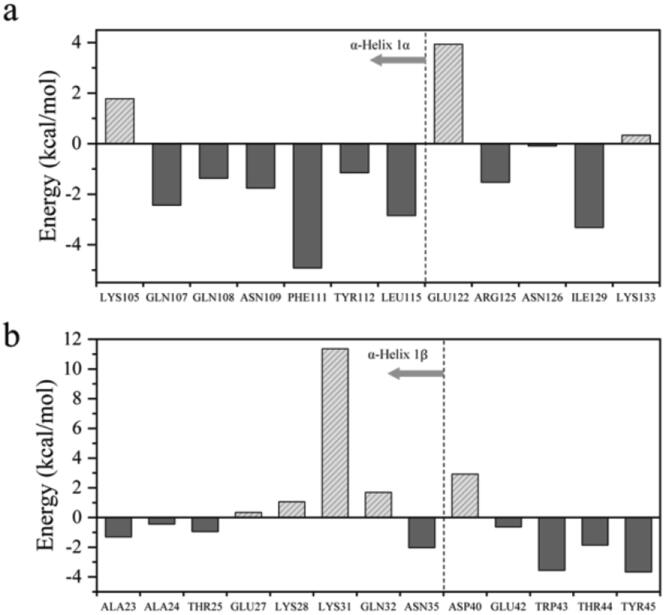
In the wide array of physiological processes, protein-protein interactions and their binding are the most basal activities for achieving adequate biological metabolism. Among the studies on binding proteins, the examination of interactions between immunoglobulin G (IgG) and natural immunoglobulin-binding ligands, such as staphylococcal protein A (spA) and streptococcal protein G (spG), is essential in the development of pharmaceutical science, biotechnology, and affinity chromatography. The widespread utilization of IgG-spA/spG binding characteristics has allowed researchers to investigate these molecular interactions. However, the detailed binding strength of each ligand and the corresponding binding mechanisms have yet to be fully investigated. In this study, the authors analyzed the binding strengths of IgG-spA and IgG-spG complexes and identified the mechanisms enabling these bindings using molecular dynamics simulation, steered molecular dynamics, and advanced Poisson-Boltzmann Solver simulations. Based on the presented data, the binding strength of the spA ligand was found to significantly exceed that of the spG ligand. To find out which non-covalent interactions or amino acid sites have a dominant role in the tight binding of these ligands, further detailed analyses of electrostatic interactions, hydrophobic bonding, and binding free energies have been performed. In investigating their binding affinity, a relatively independent and different unbinding mechanism was found in each ligand. These distinctly different mechanisms were observed to be highly correlated to the protein secondary and tertiary structures of spA and spG ligands, as explicated from the perspective of hydrogen bonding.
Keywords: AFM, Atomic Force Microscopy; APBS, Advanced Poisson–Boltzmann Solver; Affinity chromatography; BIR, Between Protein–Protein Interface Residues; ELISA, Enzyme-linked Immunosorbent Assays; Fc, Fragment Crystallizable; IgG, Immunoglobulin G; Immunoglobulin G; MD, Molecular Dynamics; MM/PBSA, Molecular Mechanics Poisson–Boltzmann Surface Area; Molecular dynamics; Protein A; Protein G; Protein docking; RMSD, Root Mean Square Deviation; SASA, Solvent Accessible Surface Area; SMD, Steered Molecular Dynamics; spA, Staphylococcal Protein A; spG, Streptococcal Protein G.
© 2021 The Authors.
Conflict of interest statement
The authors declare that they have no known competing financial interests or personal relationships that could have appeared to influence the work reported in this paper.
Figures


References
-
- Leavy O. Therapeutic antibodies: past, present and future. Nat Rev Immunol. 2010;10(5):297. - PubMed
-
- Matera M.G. Therapeutic Monoclonal Antibodies for the Treatment of Chronic Obstructive Pulmonary Disease. Drugs. 2016;76(13):1257–1270. - PubMed
-
- Lowe, C.C.R. and P.P.D. Dean, Affinity chromatography. 1974: John Wiley & Sons.
-
- Bailon, P., Affinity chromatography: methods and protocols: Springer Science & Business Media; Vol. 421. 2008
-
- Bonner, P., Protein purification; 2018: Taylor & Francis.
LinkOut - more resources
Full Text Sources
Miscellaneous