. 2021 Jan 12:31:35-47.
doi: 10.1016/j.jare.2021.01.006. eCollection 2021 Jul.

Sleep/wake calcium dynamics, respiratory function, and ROS production in cardiac mitochondria

Affiliations

Sleep/wake calcium dynamics, respiratory function, and ROS production in cardiac mitochondria

Engy A Abdel-Rahman et al. J Adv Res. .

Abstract

Introduction: Incidents of myocardial infarction and sudden cardiac arrest vary with time of the day, but the mechanism for this effect is not clear. We hypothesized that diurnal changes in the ability of cardiac mitochondria to control calcium homeostasis dictate vulnerability to cardiovascular events.

Objectives: Here we investigate mitochondrial calcium dynamics, respiratory function, and reactive oxygen species (ROS) production in mouse heart during different phases of wake versus sleep periods.

Methods: We assessed time-of-the-day dependence of calcium retention capacity of isolated heart mitochondria from young male C57BL6 mice. Rhythmicity of mitochondrial-dependent oxygen consumption, ROS production and transmembrane potential in homogenates were explored using the Oroboros O2k Station equipped with a fluorescence detection module. Changes in expression of essential clock and calcium dynamics genes/proteins were also determined at sleep versus wake time points.

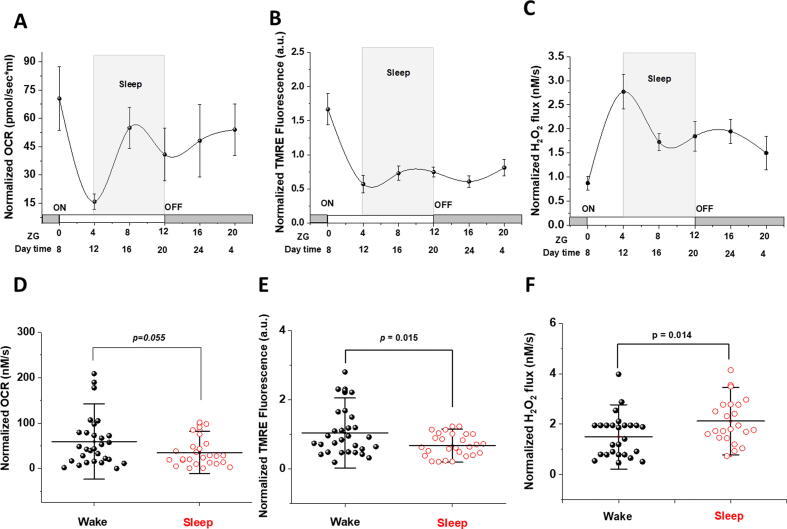
Results: Our results demonstrate that cardiac mitochondria exhibit higher calcium retention capacity and higher rates of calcium uptake during sleep period. This was associated with higher expression of clock gene Bmal1, lower expression of per2, greater expression of MICU1 gene (mitochondrial calcium uptake 1), and lower expression of the mitochondrial transition pore regulator gene cyclophilin D. Protein levels of mitochondrial calcium uniporter (MCU), MICU2, and sodium/calcium exchanger (NCLX) were also higher at sleep onset relative to wake period. While complex I and II-dependent oxygen utilization and transmembrane potential of cardiac mitochondria were lower during sleep, ROS production was increased presumably due to mitochondrial calcium sequestration.

Conclusions: Taken together, our results indicate that retaining mitochondrial calcium in the heart during sleep dissipates membrane potential, slows respiratory activities, and increases ROS levels, which may contribute to increased vulnerability to cardiac stress during sleep-wake transition. This pronounced daily oscillations in mitochondrial functions pertaining to stress vulnerability may at least in part explain diurnal prevalence of cardiac pathologies.

Keywords: Calcium dynamics; Clock genes; Diurnal; Heart; Hydrogen peroxide; Mitochondria function.


Conflict of interest statement

The authors declare the following financial interests/personal relationships which may be considered as potential competing interests: HHP has equity as a founder in CavoGene LifeSciences Holdings, LLC. All other authors have declared no conflict of interest.

Figures

None
Graphical abstract
Fig. 1
Fig. 1
Variation of the calcium retention capacity of cardiac mitochondria over the day. (A) Representative traces for calcium pulsing assay that is used to assess calcium retention capacity (CRC) of freshly isolated cardiac mitochondria from hearts of mice sacrificed at ZG 0 (Wake) and ZG 4 (Sleep) with arrows indicating successive infusions of 20-µM calcium pulses every 60 s in the presence of the low-affinity Calcium Green 5 N dye as detailed in the Methods’ Section. (B) Chronogram displaying time of the day-dependent variations in CRC of cardiac mitochondria (µM Ca2+/µg protein). n = 7, 9, 6, 6, 5, 6 animals time points ZG 0, 4, 8, 12, 16, 20; respectively. CRC was calculated for each time point as the sum of Ca2+ pulses taken-up by mitochondria prior to the induction of mPTP opening and mitochondrial burst marked by abrupt increase in fluorescence. (C) Comparing RCRs quantified for cardiac mitochondria isolated during wake period (mice sacrificed at ZG 0, 16, and 20, total of 21 mice) versus those sacrificed during sleep and early wake period (ZG 4, 8, and 12, total of n = 18 mice). p-values are calculated using ANOVA followed by Tukey test for means comparisons and are given for relevant conditions. Data are shown as mean ± SEM for (B) and mean ± SD for (C).
Fig. 2
Fig. 2
Analysis of calcium dynamics in freshly isolated cardiac mitochondria reveals disparity in their ability to tolerate calcium stress during sleep versus wake periods. (A) Rates of mitochondrial Ca2+ uptake estimated by calculating the time taken for the decaying calcium fluorescence signal to reach half of the initial amplitude is denoted ‘τ1/2′ (B) Ca2+ calibration curve constructed by plotting changes in fluorescence intensity following incremental additions of known Ca2+ concentrations on a buffer containing Calcium Green 5 N dye in the absence of mitochondrial uptake. (C) Mitochondria isolated from mice hearts during their sleep period showed a weak trend of increased sequestration of calcium following the first four 20-µM Ca2+ pulses relative to those isolated during the wake periods (p = 0.10, n = 15 and 20 mice for wake and sleep periods; respectively). Mitochondria-retained calcium was calculated by subtracting expected-minus-observed fluorescence intensities and conversion to concentrations using the calibration curve. (D) Chronogram depicting time-of-the-day dependence of τ1/2 (the time taken for calcium signals to decay to half of their initial amplitude). N = 7, 9, 6, 6, 5, 6 animals per time points ZG 0, 4, 8, 12, 16, 20; respectively. τ1/2 was determined for each of the first 4 pulses whenever observed. ZG 16 was significantly higher when compared with all other time points, p < 0.01 by one way ANOVA followed by Tukey test. (E) Data in panel D assembled in wake versus sleep groups and showed significantly lower τ1/2; i.e., faster calcium uptake by mitochondria isolated from animals sacrificed during sleep period. τ1/2 values were obtained for individual pulses observed and compared for the two groups by ANOVA followed by Tukey test, p = 0.008 (n = 18 and 21 mice for sleep and wake periods; respectively). Data are shown as mean ± SEM for (D) and mean ± SD for (B,C,E).
Fig. 3
Fig. 3
Sleep/wake profiles of expressions of mitochondrial-, calcium-, and clock-related genes and proteins in mice hearts. (A) Schematic representation of mitochondrial calcium uniporter (MCU) Ca2+ channel showing subunits assessed in this work. Genes quantified include Bmal1; Per2; NAD dehydrogenase (ND1); MCU and subunits depicted; along with sodium/calcium exchanger channel (NCLX) and cyclophilin D (CypD). (B) Comparing cardiac gene expressions at ZG 0 versus ZG 4. The numbers of animals studied at each time point are n = 5 for ND1, MCU1, MCUb, MICU2, EMRE, and NCLX; n = 9 for MICU1 and CypD; and n = 10 for Bmal, Per2, and MCU. One way ANOVA followed by Tukey test was employed for comparisons of means, p < 0.05 (*), p < 0.01 (**) (C,D) Western blot detection of various proteins pertaining to clock and mitochondrial calcium dynamics in mouse hearts extracted at ZG0 versus ZG4 (quantified in D, n = 4 for ND1 and MCUb and 5 for other proteins, one way ANOVA followed by Tukey test, p < 0.05 (*) or p < 0.01 (**)). (E) MICU1 to MCU and MICU2 to MCU (F) ratios are calculated from levels of protein expression (n = 5 per group, data shown are Means ± SD).
Fig. 4
Fig. 4
Cardiac mitochondrial function is dependent on sleep/wake cycle. Comparison of sleep/wake cycle-dependent rates of mitochondrial oxygen consumption (A vs. D), transmembrane potential (B vs. E), and H2O2 production (C vs. F) in homogenized, saponin-permeabilized young mice heart. Representative traces illustrate ETC substrate-specific O2 utilization (A&D) and H2O2 production (C&F) during Substrate-Uncoupler-Inhibitor Titration (SUIT) protocol in mice heart homogenate at ZG 0 (Wake) and ZG 4 (Sleep) (B&E). Representative traces of transmembrane potential in homogenized and saponin-permeabilized young mice heart at ZG 0 and ZG 4.
Fig. 5
Fig. 5
Mitochondrial functions exhibit time of the day dependence in young mice hearts. Chronograms displaying time of the day quantified variations in OCR (A), TMRE fluorescence reflecting mTMP (B) and H2O2 flux per volume (C) over 24 h and normalized to citrate synthase activity in homogenized mice hearts (n = 12, 11, 9, 6, 8, 6 animals at ZG 0, 4, 8, 12, 16, 20; respectively). (D) Normalized rates of oxygen consumption in mice heart homogenate pooled to compare wake with sleep periods (p = 0.0549), (E) normalized TMRE fluorescence (p = 0.015), and (F) normalized H2O2 flux (p = 0.014) (from D to F, n = 26 for sleep and n = 29 for wake groups). Data are represented as mean ± SEM (A-C) and mean ± SD (D-F). Means comparisons were carried out using by ANOVA followed by Tukey test.

References

    1. Arı H., Sonmez O., Koc F., Demır K., Alıhanoglu Y., Ozdemır K. Circadian rhythm of infarct size and left ventricular function evaluated with tissue Doppler echocardiography in ST elevation myocardial infarction. Hear Lung Circ. 2016;25:250–256. doi: 10.1016/j.hlc.2015.06.833. - DOI - PubMed
    1. Thosar S.S., Butler M.P., Shea S.A. Role of the circadian system in cardiovascular disease. J Clin Invest. 2018;128:2157–2167. doi: 10.1172/JCI80590. - DOI - PMC - PubMed
    1. Takeda N., Maemura K. Circadian clock and cardiovascular disease. J Cardiol. 2011;57:249–256. doi: 10.1016/j.jjcc.2011.02.006. - DOI - PubMed
    1. Takeda N., Maemura K. Circadian clock and the onset of cardiovascular events. Hypertens Res. 2016;39:383–390. doi: 10.1038/hr.2016.9. - DOI - PubMed
    1. Scheer F.A.J.L., Hu K., Evoniuk H., Kelly E.E., Malhotra A., Hilton M.F. Impact of the human circadian system, exercise, and their interaction on cardiovascular function. Proc Natl Acad Sci. 2010;107:20541–20546. doi: 10.1073/pnas.1006749107. - DOI - PMC - PubMed

Publication types