. 2021 Jun 3:11:692883.
doi: 10.3389/fcimb.2021.692883. eCollection 2021.

A Single Dose of Nitrate Increases Resilience Against Acidification Derived From Sugar Fermentation by the Oral Microbiome

Affiliations

A Single Dose of Nitrate Increases Resilience Against Acidification Derived From Sugar Fermentation by the Oral Microbiome

Bob T Rosier et al. Front Cell Infect Microbiol. .

Abstract

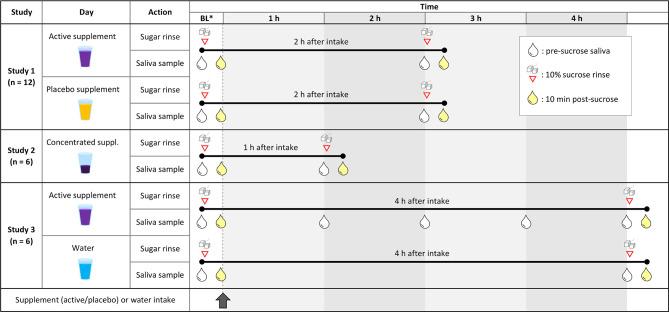
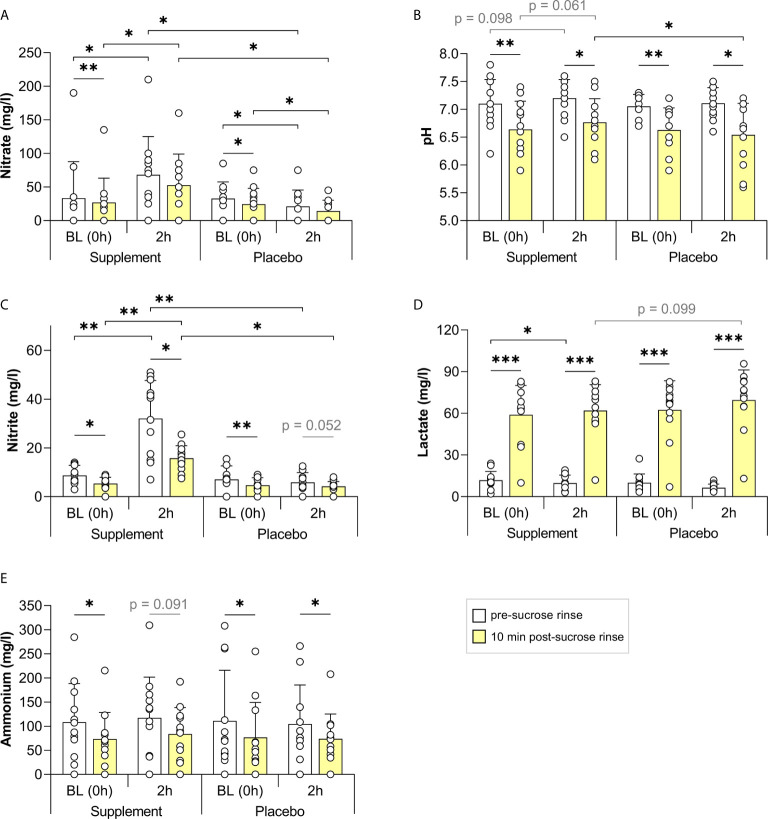
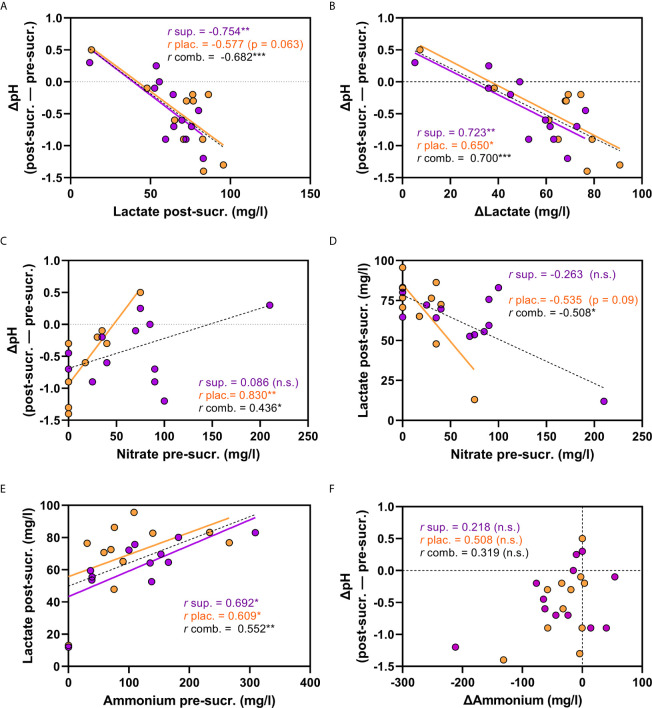
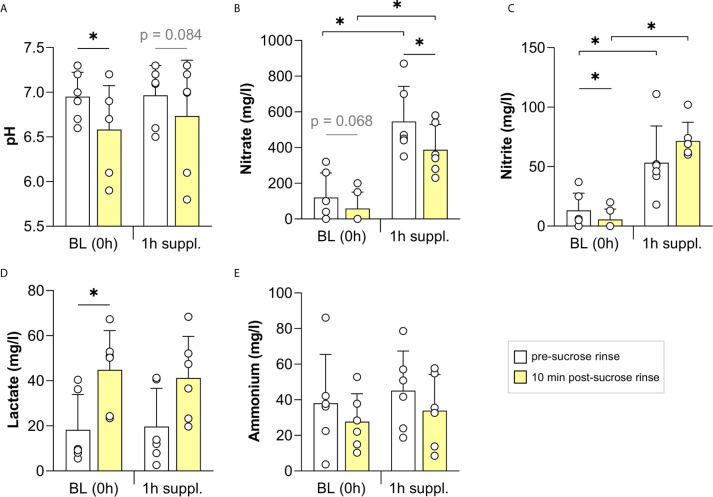
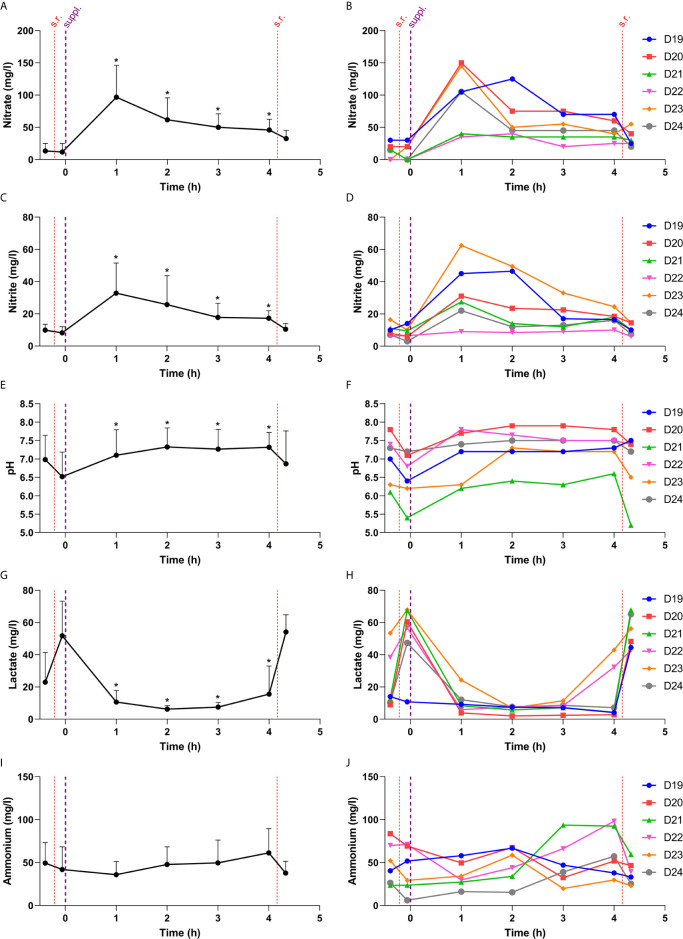
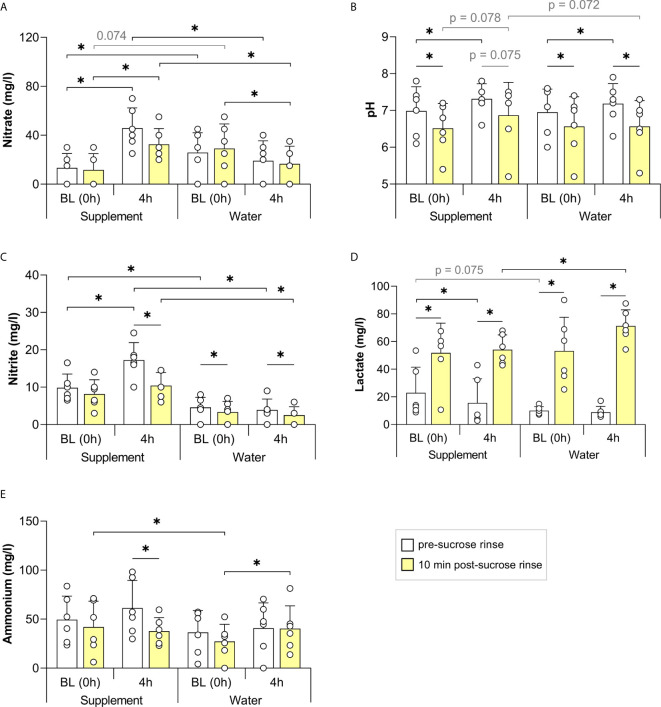
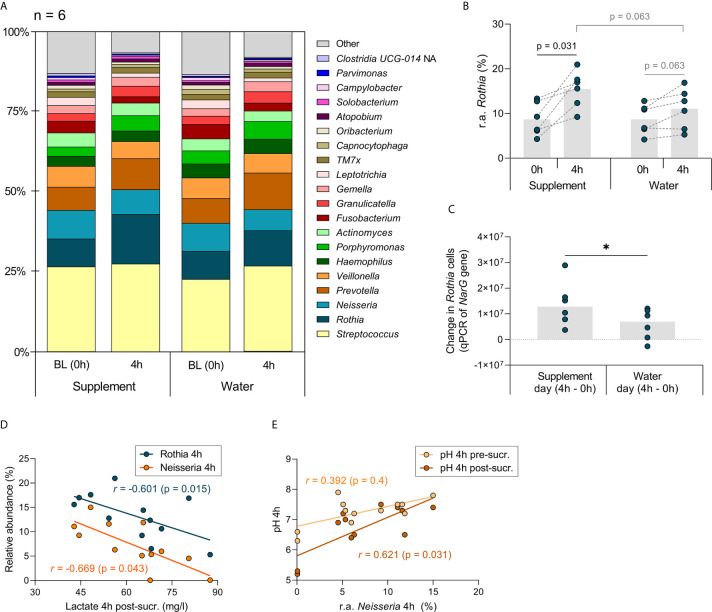
Tooth decay starts with enamel demineralization due to an acidic pH, which arises from sugar fermentation by acidogenic oral bacteria. Previous in vitro work has demonstrated that nitrate limits acidification when incubating complex oral communities with sugar for short periods (e.g., 1-5 h), driven by changes in the microbiota metabolism and/or composition. To test whether a single dose of nitrate can reduce acidification derived from sugar fermentation in vivo, 12 individuals received a nitrate-rich beetroot supplement, which was compared to a placebo in a blinded crossover setting. Sucrose-rinses were performed at baseline and 2 h after supplement or placebo intake, and the salivary pH, nitrate, nitrite, ammonium and lactate were measured. After nitrate supplement intake, the sucrose-induced salivary pH drop was attenuated when compared with the placebo (p < 0.05). Salivary nitrate negatively correlated with lactate production and positively with ΔpH after sucrose exposure (r= -0.508 and 0.436, respectively, both p < 0.05). Two additional pilot studies were performed to test the effect of sucrose rinses 1 h (n = 6) and 4 h (n = 6) after nitrate supplement intake. In the 4 h study, nitrate intake was compared with water intake and bacterial profiles were analysed using 16S rRNA gene Illumina sequencing and qPCR detection of Rothia. Sucrose rinses caused a significant pH drop (p < 0.05), except 1 h and 4 h after nitrate supplement intake. After 4 h of nitrate intake, there was less lactate produced compared to water intake (p < 0.05) and one genus; Rothia, increased in abundance. This small but significant increase was confirmed by qPCR (p < 0.05). The relative abundance of Rothia and Neisseria negatively correlated with lactate production (r = -0.601 and -0.669, respectively) and Neisseria positively correlated with pH following sucrose intake (r = 0.669, all p < 0.05). Together, these results show that nitrate can acutely limit acidification when sugars are fermented, which appears to result from lactate usage by nitrate-reducing bacteria. Future studies should assess the longitudinal impact of daily nitrate-rich vegetable or supplement intake on dental health.

Keywords: Rothia; acidification; caries; nitrate; oral microbiota; pH buffering capacity; resilience; saliva.


Conflict of interest statement

AM and BR are co-inventors in a pending patent application owned by the FISABIO Institute, which protects the use of nitrate as a prebiotic. The remaining authors declare that the research was conducted in the absence of any commercial or financial relationships that could be construed as a potential conflict of interest.

Figures

Figure 1
Figure 1
Design of the different clinical studies included in this article. Study 1: Cross-over study design in which 12 individuals received a nitrate-rich supplement (250 mg nitrate in 200 ml) on one day and a nitrate-poor placebo (<6 mg nitrate in 200 ml) on the same day a week earlier (individuals 1-6) or later (individuals 7-12). The effects of both supplements on sucrose rinses were compared. Study 2: Six individuals received a concentrated beetroot extract (300 mg nitrate in 70 ml) to compare the effect of a sucrose rinse before and 1 h after supplement intake. Study 3: Another six individuals received a nitrate rich-supplement (220 mg nitrate in 200 ml) and saliva was taken every hour to monitor changes in physiological parameters. Additionally, the effect of a sucrose rinse after 4 h of supplement intake was compared to a sucrose rinse 4 h after water intake (200 ml) on the previous day. BL, baseline (before supplement intake). Red triangles with sugar cubes show when 10% sucrose rinses were performed, and the drops represent saliva sampling. White drops are saliva samples taken right before a sucrose rinse or without a subsequent sugar, and yellow drops are 10-minute post-sucrose rinse saliva samples.
Figure 2
Figure 2
The effect of a nitrate-rich supplement on sucrose rinses 2 h after intake compared with a placebo. In 12 individuals, salivary nitrate (A), pH (B), nitrite (C), lactate (D) and ammonium (E) were measured. Sugar rinses were performed at baseline (BL, 0 h) on the two different days (supplement day and placebo day) and 2 h after intake of a nitrate-rich supplement (250 mg nitrate in 250 ml) or nitrate-poor placebo (<6 mg nitrate in 250 ml). Saliva samples were collected immediately prior to the sugar rinse (pre-sucrose, white bars) and 10 min after the sugar rinse (post-sucrose, yellow bars). The bars and small white circles represent the averages and individual donor’s data, respectively. Wilcoxon tests were used to compare the pre-sucrose with the post-sucrose measurements. Additionally, the BL pre- and post-sucrose measurement were compared with 2 h pre- and post-sucrose measurement, respectively. Finally, every measurement on the supplement day was compared with the same measurement on the placebo day. Significant changes (*p < 0.05, **p < 0.01, ***p < 0.005) and trends (grey text, p = 0.05 - 0.1) are shown.
Figure 3
Figure 3
Correlations between physiological parameters 2 h after nitrate-rich supplement and placebo intake. In (A–F), correlations between different physiological parameters are shown. The purple dots are measurements 2 h after nitrate-rich supplement intake (n = 12) and the orange dots 2 h after placebo intake on a different day (n = 12). The black dotted lines are the linear regression curves when combining the measurements after supplement and placebo intake (total n = 24). The ΔpH is the pH difference between the pre-sucrose measurement and the post-sucrose measurement (negative values are a pH drop). (A) ΔpH and lactate detected post-sucrose. (B) ΔpH and Δlactate. (C) ΔpH and salivary nitrate (pre-sucrose) (D) lactate detected post-sucrose and salivary nitrate (pre-sucrose). (E) salivary ammonium (pre-sucrose) and lactate detected post-sucrose. (F) ΔpH and Δammonium. sup., supplement; plac., placebo; comb., combined; pre-sucr., pre-sucrose measurements; post-sucr., 10 min post-sucrose measurement. Spearman-Rho correlations (r) were calculated 2 h after supplement (sup.) or placebo (plac.) intake, or both combined (comb.). P-values and linear regression curves are shown if trends were found (p 0.05-0.1). *p < 0.05, **p <0.01, ***p <0.001, n.s, not significant. Δ = post-measurement – pre-measurement.
Figure 4
Figure 4
The effect of a concentrated nitrate-rich supplement on sucrose rinses 1 h after intake. In six individuals, the salivary pH (A) and concentrations of nitrate (B), nitrite (C), lactate (D) and ammonium (E) were measured. Sugar rinses were performed at baseline (BL, 0 h) and 1 h after intake of a nitrate-rich supplement (300 mg nitrate in 70 ml). Saliva samples were collected immediately prior to the sugar rinse (pre-sucrose, white bars) and 10 min after the sugar rinse (post-sucrose, yellow bars). The bars and small white circles represent the averages and individual donor data, respectively. Wilcoxon tests were used to compare the pre-sucrose with the post-sucrose measurements. Additionally, the BL pre- and post-sucrose measurement were compared with 2 h pre- and post-sucrose measurements, respectively. Significant changes (*p < 0.05) and trends (grey text, p = 0.05 - 0.1) are shown.
Figure 5
Figure 5
Changes in physiological parameters during the 4 h after taking a nitrate-rich supplement. In this figure, the salivary nitrate (A, B), nitrite (C, D), pH (E, F), lactate (G, H) and ammonium (I, J) are shown over time. The red lines are sugar rinses dividing pre- and post-sucrose measurements at baseline (0 h) and after 4 h of supplement intake. The thicker purple line represents when the nitrate-rich supplement was consumed. On the left side, the averages are shown with standard deviations. The time points 1 h, 2 h, 3 h and 4 h (pre-sucrose) were compared to 0 h (pre-sucrose). * = compared to 0 h (pre-sucrose), the p-value was < 0.05. On the right side, the individual donors are shown. S.r., sugar rinse; Suppl., supplement intake. In Figure 6, the pre- and post-sucrose measurements are compared.
Figure 6
Figure 6
The effect of a nitrate-rich supplement on sucrose rinses 4 h after intake compared with water. In 6 individuals, salivary nitrate (A), pH (B), nitrite (C), lactate (D) and ammonium (E) were measured. Sugar rinses were performed at baseline (BL, 0 h) of the two different days (supplement day and water day) and 2 h after intake of a nitrate-rich supplement (220 mg nitrate in 200 ml) or water (200 ml). Saliva samples were collected immediately prior to the sugar rinse (pre-sucrose, white bars) and 10 min after the sugar rinse (post-sucrose, yellow bars). The bars and small white circles represent the averages and individual data, respectively. Wilcoxon tests were used to compare the pre-sucrose with the post-sucrose measurements. Additionally, the BL pre- and post-sucrose measurements were compared with 2 h pre- and post-sucrose measurements, respectively. Finally, every measurement of the supplement day was compared with the same measurement on the water day. Significant changes (*p < 0.05) and trends (grey text, p = 0.05 - 0.1) are shown.
Figure 7
Figure 7
Genus level analysis of study 3 (comparing a nitrate-rich supplement intake with water intake). In (A), the relative abundance of the genera detected in the 6 individuals of study 3 are represented in bar charts. Based on the median, the 20 most abundant genera are shown. The grey boxes with “other” contain genera < 0.34% abundance grouped together. In (B), the relative abundance (r.a.) of the genus Rothia is shown, which showed the strongest trend towards an increase when comparing BL (0 h) with 4 h after nitrate-rich supplement intake (p value = 0.031, adjusted p-value = n.s.). The grey bars represent the averages and the dark cyan dots the data from individual participants. The higher increase of Rothia after taking the supplement compared with water intake was confirmed by qPCR in (C) the increase of Rothia cells from 0 h to 4 h, based on the number of copies of the Rothia nitrate reductase narG gene, was higher after taking the supplement than after taking water (*p < 0.05). (D) the measurements 4 h after water intake and 4 h after supplement intake were combined (n = 12) and a lactate post-sucrose correlated negatively with the abundance of Rothia and Neisseria. In (E), the correlation with Neisseria between pH pre-sucrose and pH post-sucrose is shown. Because of the small sample size, unadjusted p-values are shown.

References

    1. Alcaraz L. D., Belda-Ferre P., Cabrera-Rubio R., Romero H., Simón-Soro A., Pignatelli M., et al. . (2012). Identifying a Healthy Oral Microbiome Through Metagenomics. Clin. Microbiol. Infect. 18 (Suppl 4), 54–57. 10.1111/j.1469-0691.2012.03857.x - DOI - PubMed
    1. Altschul S. F., Gish W., Miller W., Myers E. W., Lipman D. J. (1990). Basic Local Alignment Search Tool. J. Mol. Biol. 215, 403–410. 10.1016/S0022-2836(05)80360-2 - DOI - PubMed
    1. Azqueta A., Collins A. (2016). Polyphenols and DNA Damage: A Mixed Blessing. Nutrients. 8 (12), 785. 10.3390/nu8120785 - DOI - PMC - PubMed
    1. Belda-Ferre P., Alcaraz L. D., Cabrera-Rubio R., Romero H., Simón-Soro A., Pignatelli M., et al. . (2012). The Oral Metagenome in Health and Disease. ISME J. 6 (1), 46–56. 10.1038/ismej.2011.85 - DOI - PMC - PubMed
    1. Bescos R., Ashworth A., Cutler C., Brookes Z. L., Belfield L., Rodiles A., et al. . (2020). Effects of Chlorhexidine Mouthwash on the Oral Microbiome. Sci. Rep. 10 (1), 5254. 10.1038/s41598-020-61912-4 - DOI - PMC - PubMed

Publication types

LinkOut - more resources