. 2021 Jun 14:9:675140.
doi: 10.3389/fcell.2021.675140. eCollection 2021.

Morphologies and Structure of Brain Lipid Membrane Dispersions

Affiliations

Morphologies and Structure of Brain Lipid Membrane Dispersions

Viveka Alfredsson et al. Front Cell Dev Biol. .

Abstract

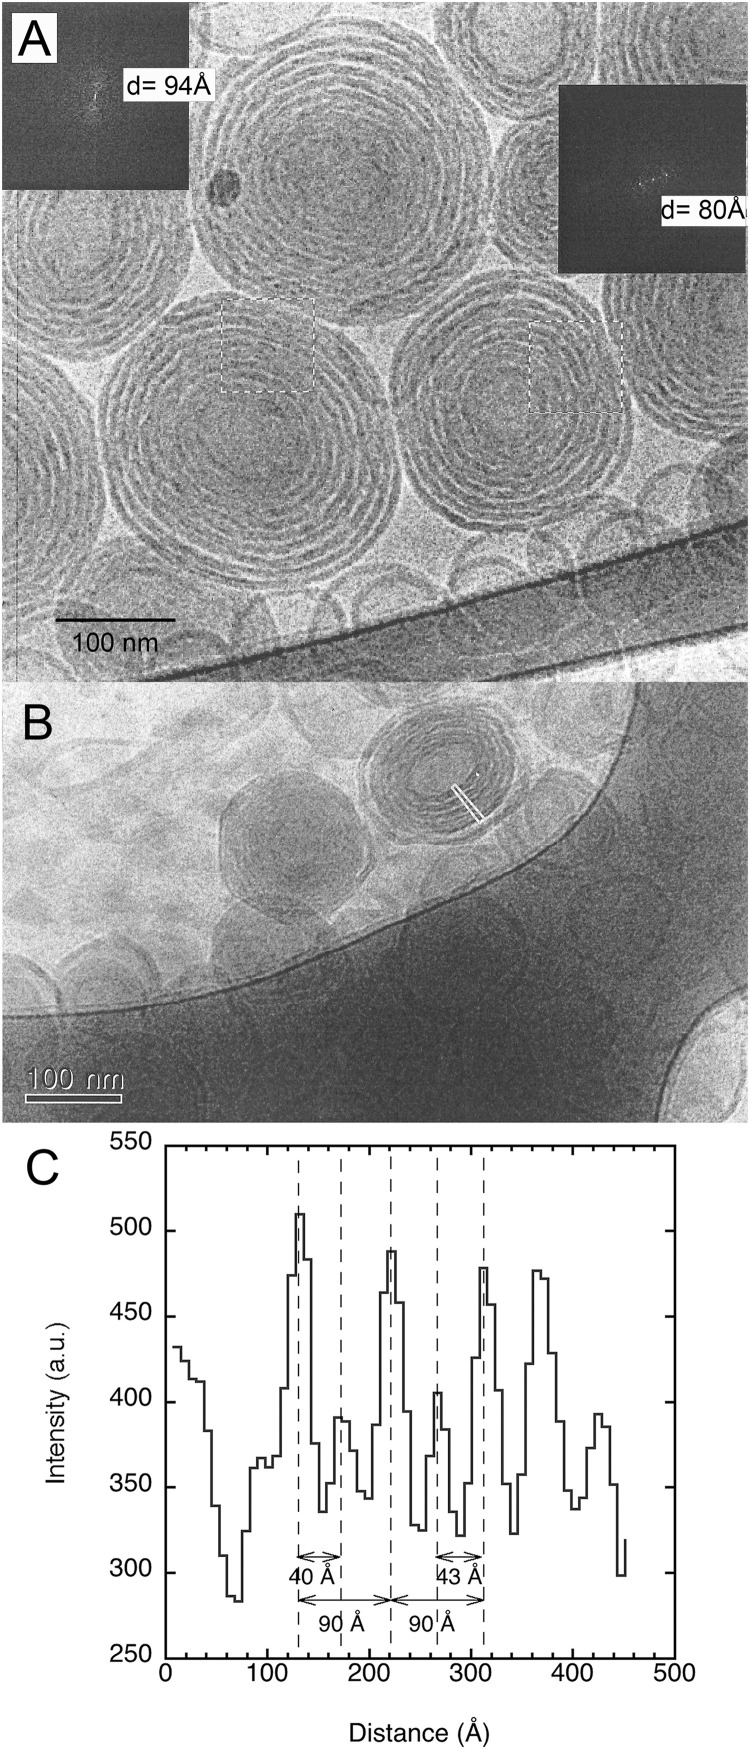
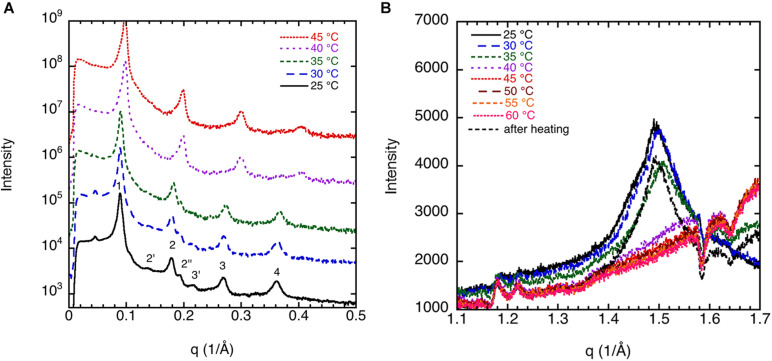
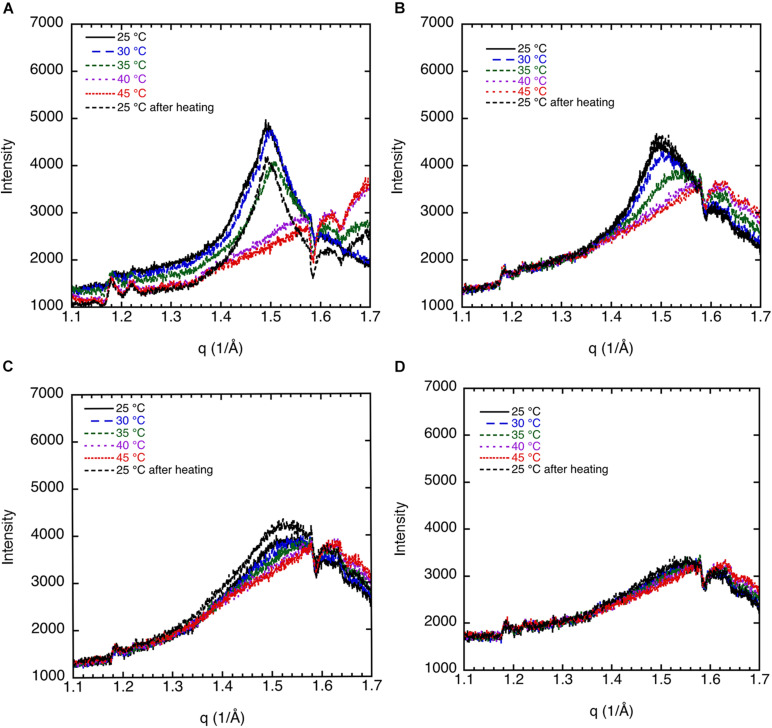
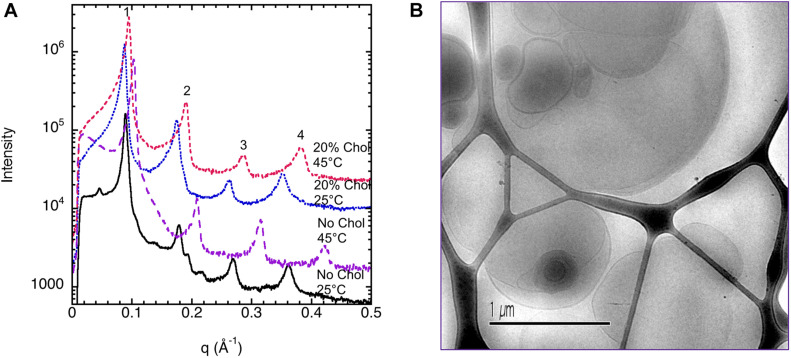
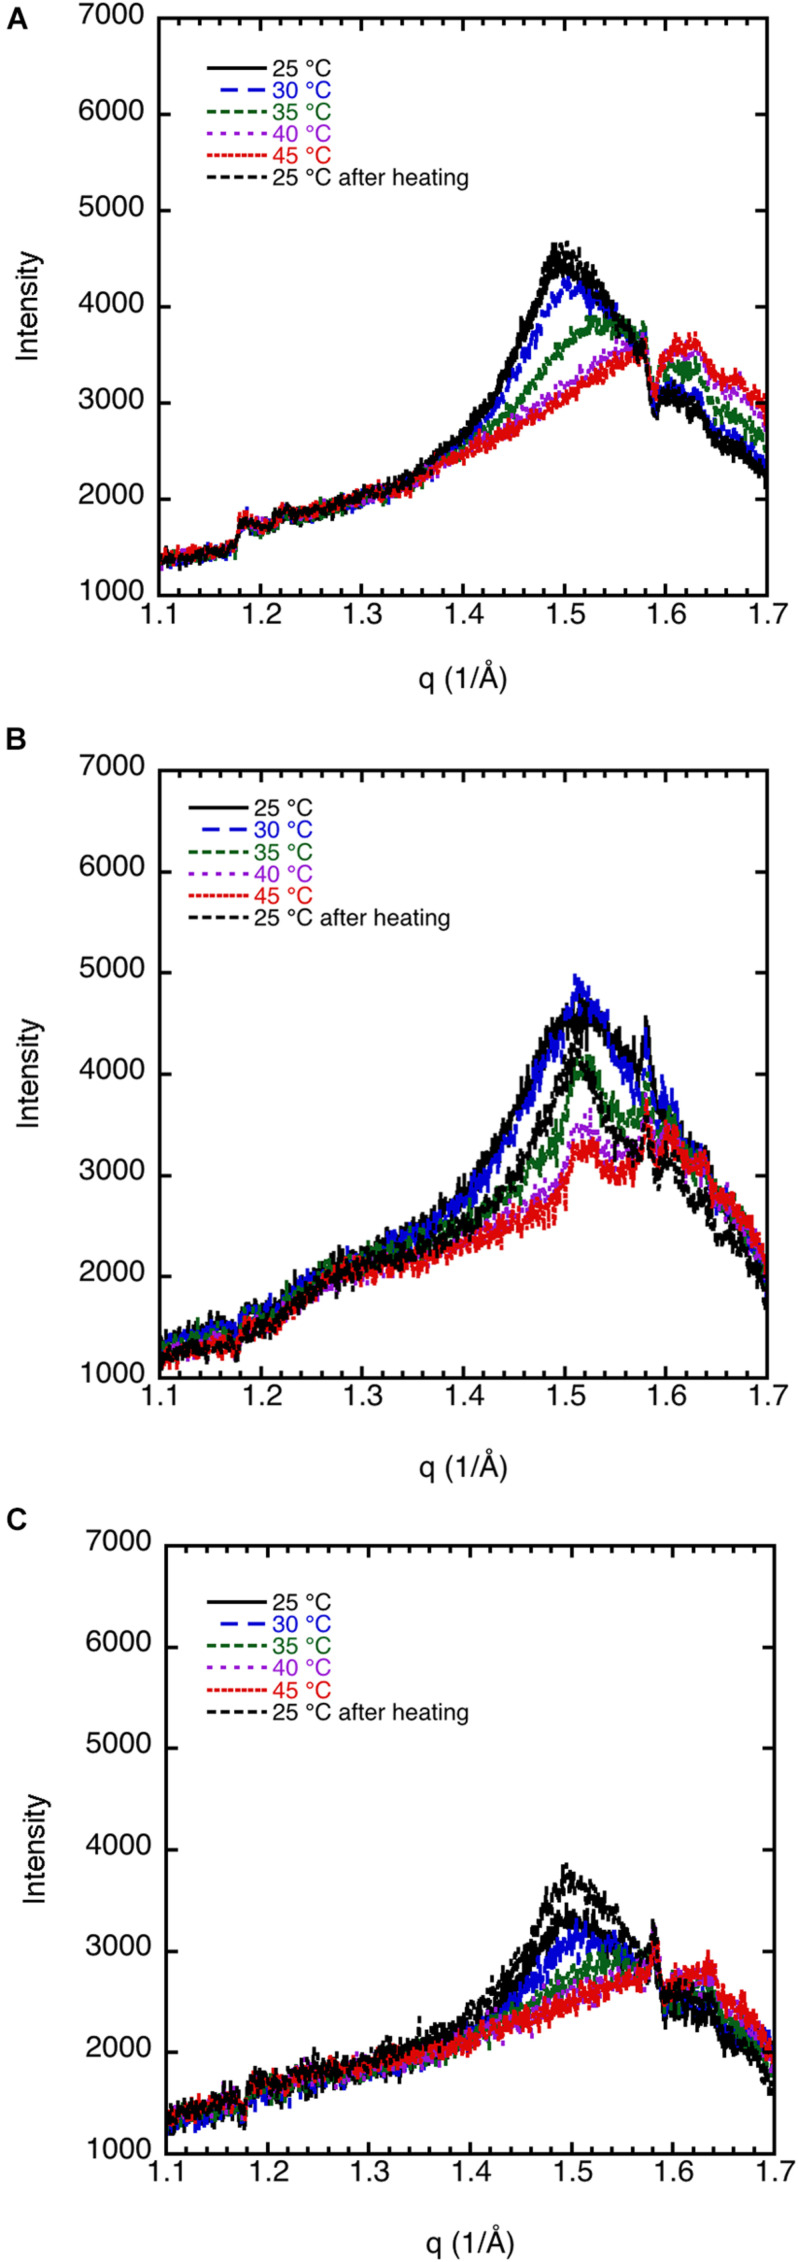
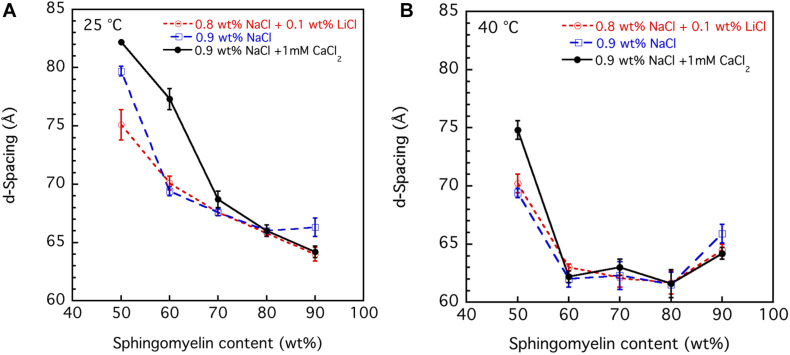
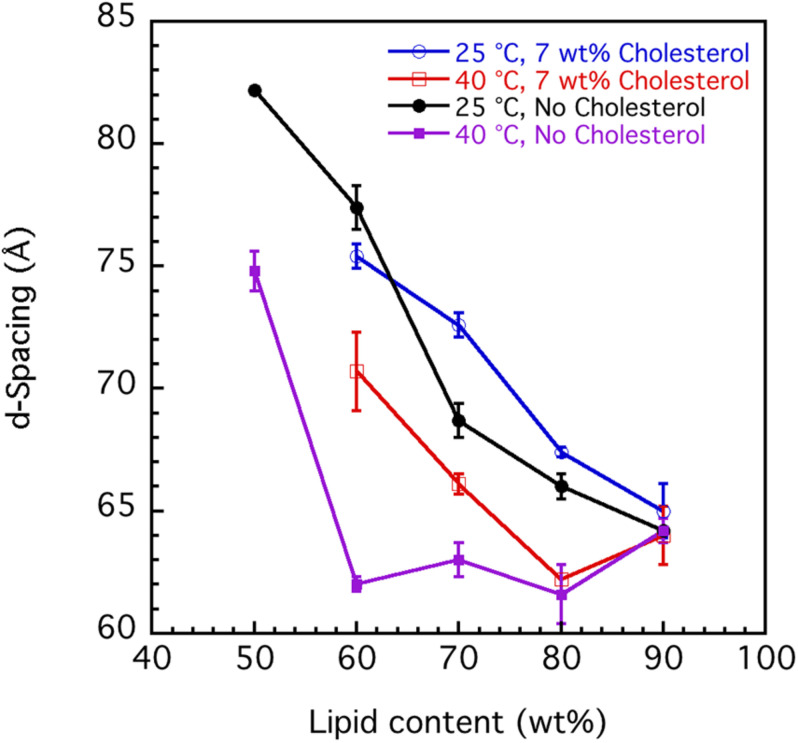
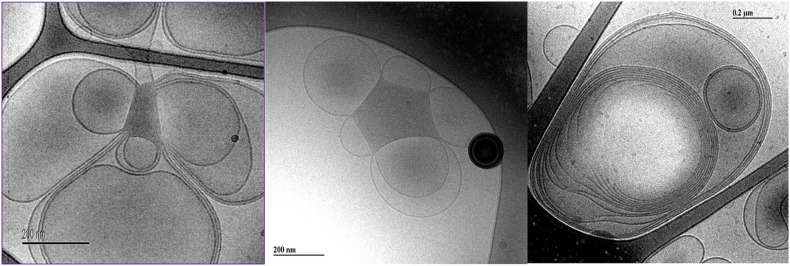
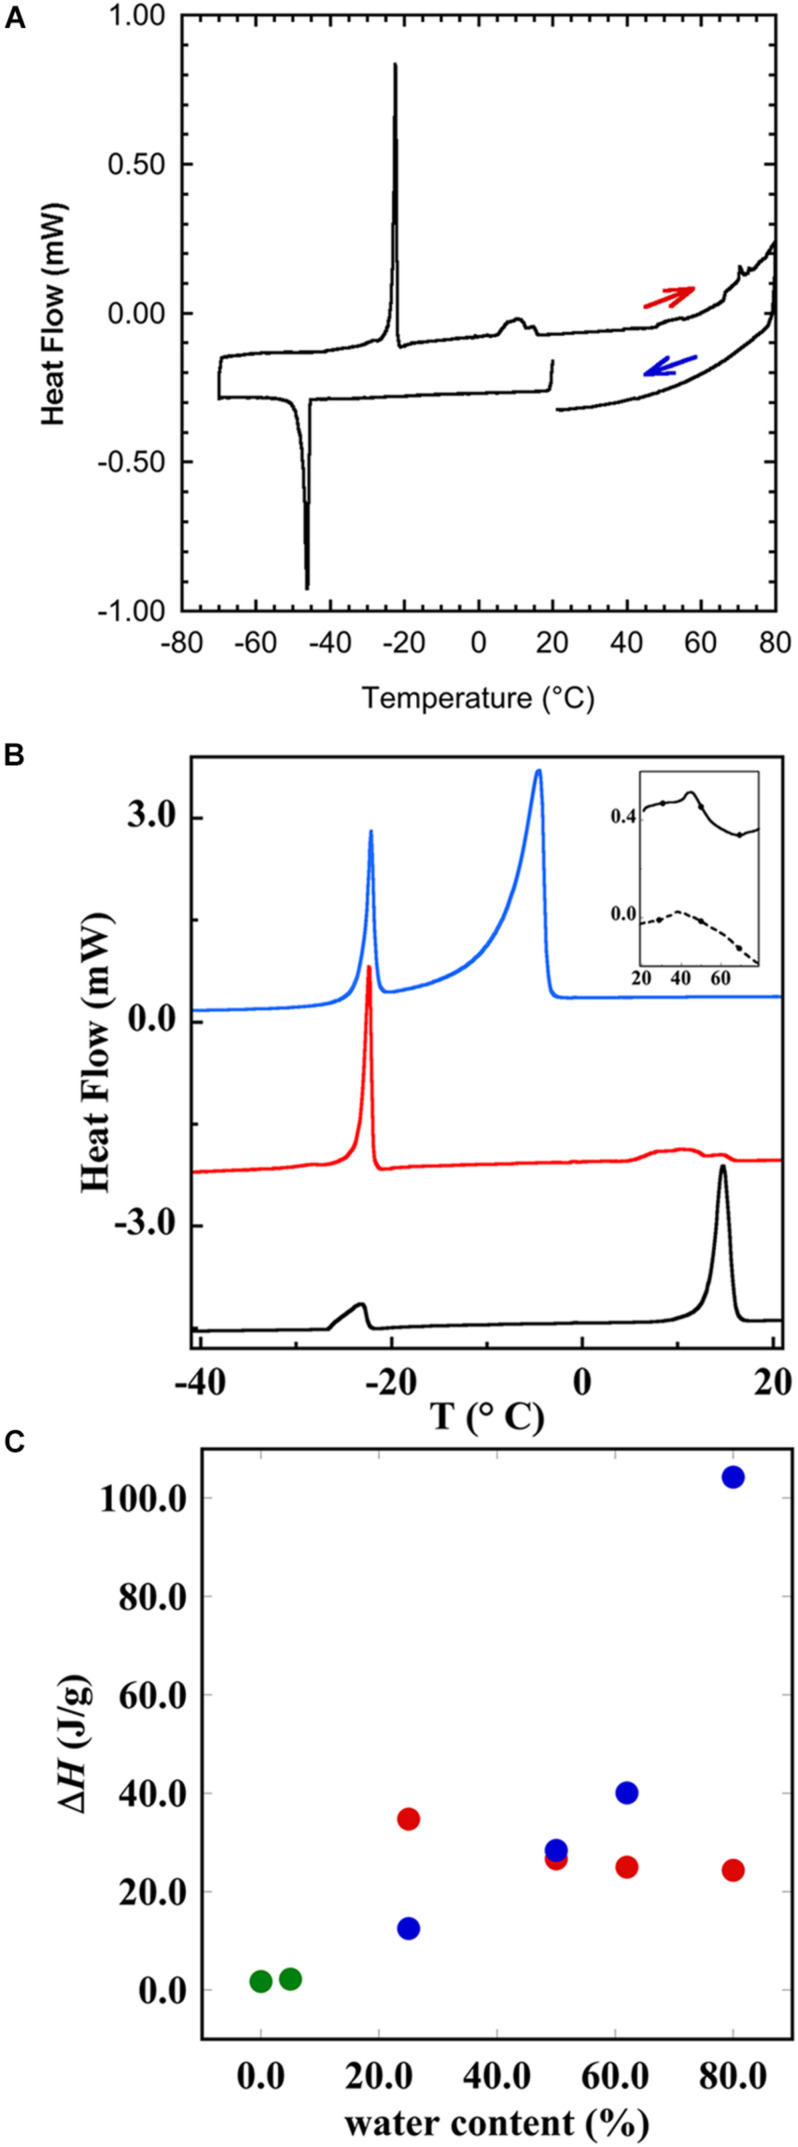
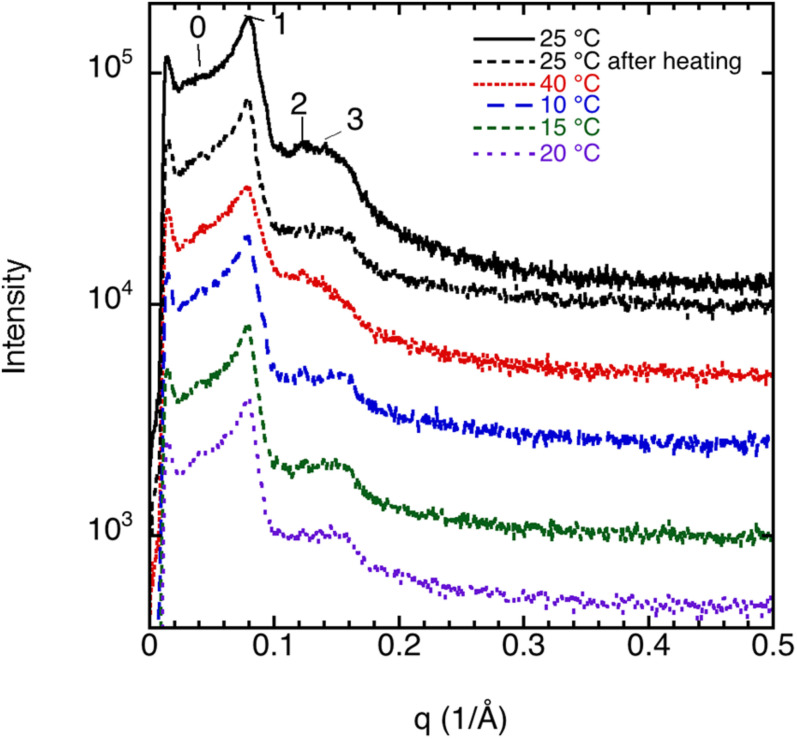
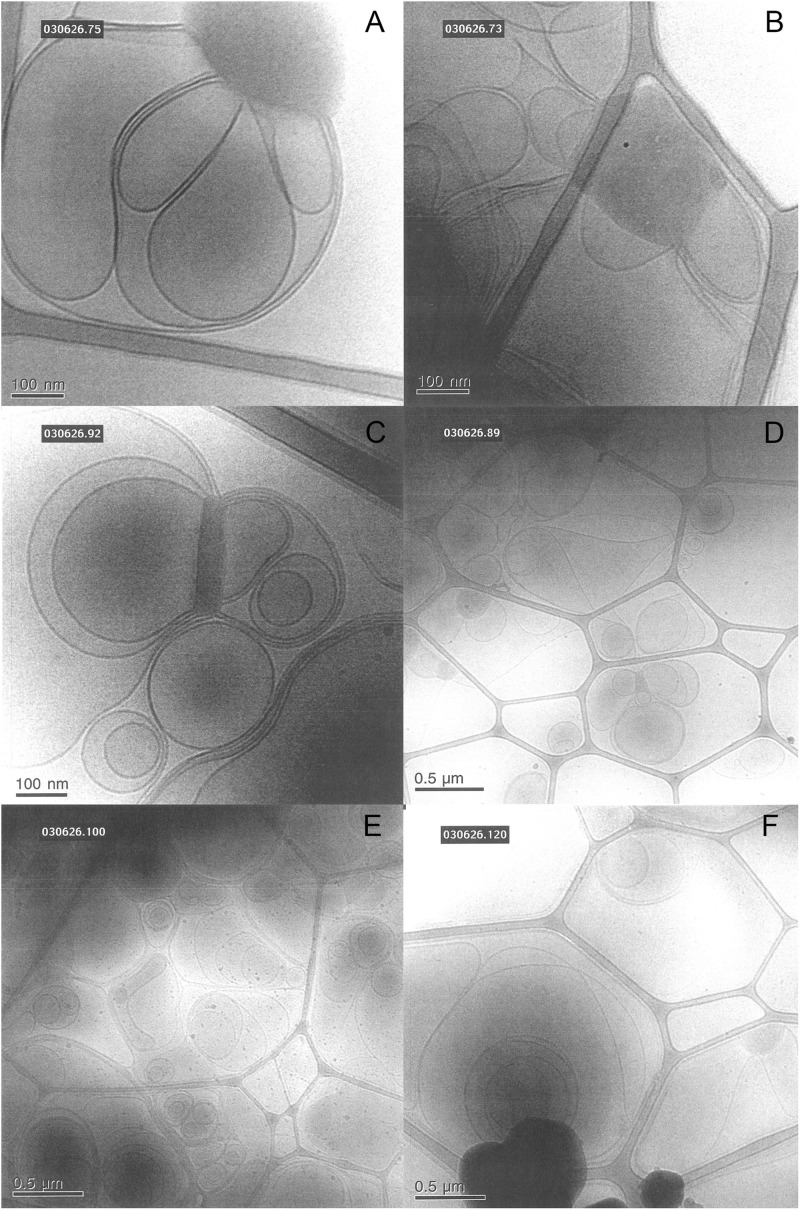
This study aims to explore the variety of previously unknown morphologies that brain lipids form in aqueous solutions. We study how these structures are dependent on cholesterol content, salt solution composition, and temperature. For this purpose, dispersions of porcine sphingomyelin with varying amounts of cholesterol as well as dispersions of porcine brain lipid extracts were investigated. We used cryo-TEM to investigate the dispersions at high-salt solution content together with small-angle (SAXD) and wide-angle X-ray diffraction (WAXD) and differential scanning calorimetry (DSC) for dispersions in the corresponding salt solution at high lipid content. Sphingomyelin forms multilamellar vesicles in large excess of aqueous salt solution. These vesicles appear as double rippled bilayers in the images and as split Bragg peaks in SAXD together with a very distinct lamellar phase pattern. These features disappear with increasing temperature, and addition of cholesterol as the WAXD data shows that the peak corresponding to the chain crystallinity disappears. The dispersions of sphingomyelin at high cholesterol content form large vesicular type of structures with smooth bilayers. The repeat distance of the lamellar phase depends on temperature, salt solution composition, and slightly with cholesterol content. The brain lipid extracts form large multilamellar vesicles often attached to assemblies of higher electron density. We think that this is probably an example of supra self-assembly with a multiple-layered vesicle surrounding an interior cubic microphase. This is challenging to resolve. DSC shows the presence of different kinds of water bound to the lipid aggregates as a function of the lipid content. Comparison with the effect of lithium, sodium, and calcium salts on the structural parameters of the sphingomyelin and the morphologies of brain lipid extract morphologies demonstrate that lithium has remarkable effects also at low content.

Keywords: X-ray diffraction; brain lipid; cholesterol; cryo-TEM; specific ion effects; sphingomyelin; structure and morphology.


Conflict of interest statement

The authors declare that the research was conducted in the absence of any commercial or financial relationships that could be construed as a potential conflict of interest.

Figures

FIGURE 1
FIGURE 1
Shows typical cryogenic transmission electron microscopy (cryo-TEM) images of porcine brain sphingomyelin dispersions. The studied dispersion contains 10 wt% lipids in 0.9 wt% (154 mM) NaCl and 1 mM CaCl2. (A) An image with inserted Fourier transforms of two marked areas that gave repeat distances of 94 and 80 Å, respectively. (B) An image of another sample with the same lipid and salt solution composition. The indicated thin rectangle in the image was analyzed in terms of pixel intensity. (C) The results of the analysis of the image in the indicated rectangle. The results are shown as a histogram of intensity vs. distance, where high intensity indicates light areas of the image. The image analysis was performed using ImageJ (Schneider et al., 2012).
FIGURE 2
FIGURE 2
(A) Small-angle X-ray diffraction (SAXD) data for 70 wt% porcine brain sphingomyelin in water containing 0.9 wt% (154 mM) NaCl and 1 mM CaCl2 recorded at different temperatures. Note that the diffractograms are displaced to facilitate comparison. The indexing of the different peaks (1, 2′, 2, 2″, 3′, 3, and 4) together with their relative intensity are shown in Table 1. (B) Wide-angle X-ray diffraction (WAXD) data for 70 wt% porcine brain sphingomyelin in 0.9 wt% (154 mM) NaCl and 1 mM CaCl2 recorded at different temperatures upon heating as indicated in the figure. The measurement at 25°C is also repeated after the sample had been heated to 60°C. The peak observed at 25°C and 30°C corresponds to a spacing of 4.20Å, while it decreases slightly to 4.17Å at 35°C. The peak disappears at higher temperature. For the sample remeasured at 25°C after the heating cycle, the value is again 4.20Å.
FIGURE 3
FIGURE 3
The effect of cholesterol on the crystalline order of porcine brain sphingomyelin in 0.9 wt% (154 mM) NaCl and 1 mM CaCl2 recorded at different temperatures by WAXD. (A) Sphingomyelin (70%) and no cholesterol (0% of lipid). Peak position corresponds to spacing of 4.20 Å at 25°C and 30°C, 4.17 Å at 35°C, while no peak at higher temperatures. (B) Sphingomyelin (65.1%) and 4.9% cholesterol (7% of lipid). Peak position corresponds to spacing of 4.20 Å at 25°C, 4.17 Å at 30°C, rounded peak at 35°C, while no peak was observed at higher temperatures. (C) Sphingomyelin (59.5%) and 10.5% cholesterol (15% of lipid). A rounded peak appears at 25°C, while no peak was observed at higher temperatures. (D) Sphingomyelin (56%) and 14% cholesterol (20% of lipid). No defined peak appears at any temperature.
FIGURE 4
FIGURE 4
Shows the effect of cholesterol on the ordering of porcine brain sphingomyelin in 0.9 wt% (154 mM) NaCl and 1 mM CaCl2 recorded at 25°C and 45°C. (A) SAXD data for 70% sphingomyelin and no cholesterol (0% of lipid) as well as 56% sphingomyelin and 14% cholesterol (20% of lipid) are shown. The interlayer spacing for the different reflections and the relative intensities of the Bragg peaks are summarized in Table 2. Note that the intensities of the diffractograms are scaled for better clarity. (B) A typical cryo-TEM image of porcine brain sphingomyelin dispersions in the presence of cholesterol. As opposed to in the absence of cholesterol (Figure 1), the image features unilamellar vesicles of different sizes. The studied dispersion contains 10 wt% lipid in 0.9 wt% (154 mM) NaCl and 1 mM CaCl2, where 7 wt% of lipids are cholesterol.
FIGURE 5
FIGURE 5
WAXD data show the effect of salt composition on the ordering of porcine brain sphingomyelin, 65.1% sphingomyelin, and 4.9% cholesterol (7% of lipid) recorded at different temperatures. (A) In 0.9 wt% (154 mM) NaCl and 1 mM CaCl2, the peak position corresponds to spacing of 4.20 Å at 25°C, 4.17 Å at 30°C, rounded peak at 35°C, while no peak at higher temperatures. (B) In 0.9 wt% (154 mM) NaCl, the peak position corresponds to a spacing of 4.15 Å at 25–35°C, and no clear peaks at higher temperature. (C) In 0.8 wt% (137 mM) NaCl and in 0.1 wt% (24 mM) LiCl, the peak position corresponds to a spacing of 4.20 Å at 25°C, a less defined peak at 4.15 Å at 30°C, and no peaks at higher temperatures. Note that the intensity is scaled so to obtain the same background for all diffractograms.
FIGURE 6
FIGURE 6
The effect of salt solution composition, i.e., 0.9 wt% (154 mM) NaCl and 1 mM CaCl2, 0.8 wt% (137 mM) NaCl and 0.1 wt% (24 mM) LiCl, and 0.9 wt% (154 mM) NaCl, on the interlamellar spacing (d-spacing) obtained from SAXD data as a function of porcine brain sphingomyelin content recorded at two different temperatures, (A) 25°C and (B) 40°C. The obtained values are the mean values calculated from all observed first to fourth order of reflections. For the samples with the largest hydration (50 wt% lipid), the third and fourth order peaks are very broad, and therefore, the q value of the peak is uncertain. In those cases, we used only the first and second order reflections. The error bars in the graph are the standard deviation of the calculated mean values.
FIGURE 7
FIGURE 7
Effect of cholesterol on the interlamellar spacing (d-spacing) obtained from SAXD data as function of porcine brain sphingomyelin content recorded at two different temperatures, 25°C and 40°C. The swelling curves for sphingomyelin in 0.9 wt% (154 mM) NaCl and 1 mM CaCl2 without cholesterol and where 7 wt% of lipid fraction was cholesterol are shown. The obtained values are the mean values calculated from all observed first to fourth order of reflections. For the samples with the largest hydration (50 wt% lipid), the third and fourth order peaks are very broad, and the q value of the peak is, therefore, uncertain. In those cases, we used only the first and second order reflections. The error bars in the graph are the standard deviations of the calculated mean values.
FIGURE 8
FIGURE 8
Typical cryo-TEM images of a 10 wt% brain lipid extract dispersion in 0.9 wt% (154 mM) NaCl and 1 mM CaCl2. The images show large multilamellar vesicles often attached to a body of higher electron density.
FIGURE 9
FIGURE 9
Differential scanning calorimetry (DSC) showing the thermal response of brain lipid extract in 0.9 wt% NaCl and 1 mM CaCl2. (A) The thermogram of 50 wt% brain lipid extract in 0.9 wt% NaCl and 1 mM CaCl2, where the heating and cooling cycles are indicated. The vertical line indicates the start of the cooling—heating—cooling cycle. The samples were first cooled from 20°C to -60°C at 10°C/min, and then heated up to 80°C at 5°C/min and eventually cooled at the same rate down to 20°C. (B) The thermograms upon heating, where the different curves correspond to different aqueous content [salt solution with 0.9 wt% (154 mM) NaCl and 1 mM CaCl2] of 25 wt% (black), 50 wt% (red), and 80 wt% (blue)]. The inset shows the thermograms obtained from the pure brain lipid extract (full line) and from its hydrated phase (5 wt% of salt solution). (C) The enthalpy of the different transition peaks from (B) as a function of salt solution content, where green circles refer to the data for pure lipid, and 5 wt% showing only one peak. The other samples show two peaks, one at very low temperature (≈-22°C), and the corresponding enthalpy change is shown as red circles, and the high temperature transition peak is shown as blue circles. The results with onset and peak temperatures and the corresponding enthalpies are summarized in Table 4.
FIGURE 10
FIGURE 10
SAXD data for 70 wt% brain lipid extract in 0.9 wt% NaCl and 1 mM CaCl2 as function of temperature. The interlayer spacing of the different peaks (0, 1, 2, and 3), together with their relative intensity, is shown in Table 3. Here peak 1 is the only well resolved peak with the highest intensity, while the 0 peak appears as a shoulder. Note the different diffractograms are displaced to facilitate comparison.
FIGURE 11
FIGURE 11
Shows typical cryo-TEM images of 5 wt% brain lipid extract dispersion in aqueous solution with different types of ions, but roughly the same ionic strength. (A,B) The images from two different grids of a sample dispersed in 0.9 wt% (154 mM) NaCl and 1 mM CaCl2 salt solution, featuring lamellar structures connected to more dense regions not fully resolved. (C,D) The images from two different grids from a sample dispersed in 0.9 wt% NaCl (154 mM) salt solution, featuring lamellar structures connected to more dense regions not fully resolved. (E,F) The images from two different grids from a sample dispersed in a salt solution containing 0.8 wt% (137 mM) NaCl and 0.1 wt% (24 mM) LiCl, featuring only lamellar structures.

References

    1. Agranoff B. W., Benjamins J. A., Hajra A. K. P. (1999). “Properties of brain lipids,” in Basic Neurochemistry: Molecular, Cellular and Medical Aspects, 6 Edn, eds Siegel G. J., Agranoff B. W., Albers R. W., Fisher S. K., Uhler M. D. (Philadelphia, PA: Lippincott-Raven; ).
    1. Angelova A., Angelov B., Drechsler M., Bizien T., Gorshkova Y. E., Deng Y. (2021). Plasmalogen-based liquid crystalline multiphase structures involving docosapentaenoyl derivatives inspired by biological cubic membranes. Front. Cell. Dev. Biol. 9:617984. 10.3389/fcell.2021.617984 - DOI - PMC - PubMed
    1. Antonny B., Vanni S., Shindou H., Ferreira T. (2015). From zero to six double bonds: phospholipid unsaturation and organelle function. Trends Cell Biol. 25 427–436. 10.1016/j.tcb.2015.03.004 - DOI - PubMed
    1. Borsacchi S., Geppi M., Macchi S., Ninham B. W., Fratini E., Ambrosi M., et al. (2016). Phase transitions in hydrophobe/phospholipid mixtures: hints at connections between pheromones and anaesthetic activity. Phys. Chem. Chem. Phys. 18 15375–15383. 10.1039/c6cp00659k - DOI - PubMed
    1. Braverman N. E., Moser A. B. (2012). Functions of plasmalogen lipids in health and disease. Biochimi. Biophys. Acta 1822 1442–1452. 10.1016/j.bbadis.2012.05.008 - DOI - PubMed

LinkOut - more resources