

Effect of substrate ratios on the simultaneous carbon, nitrogen, sulfur and phosphorous conversions in microbial fuel cells
- PMID: 34195439
- PMCID: PMC8233142
- DOI: 10.1016/j.heliyon.2021.e07338
Effect of substrate ratios on the simultaneous carbon, nitrogen, sulfur and phosphorous conversions in microbial fuel cells
Abstract
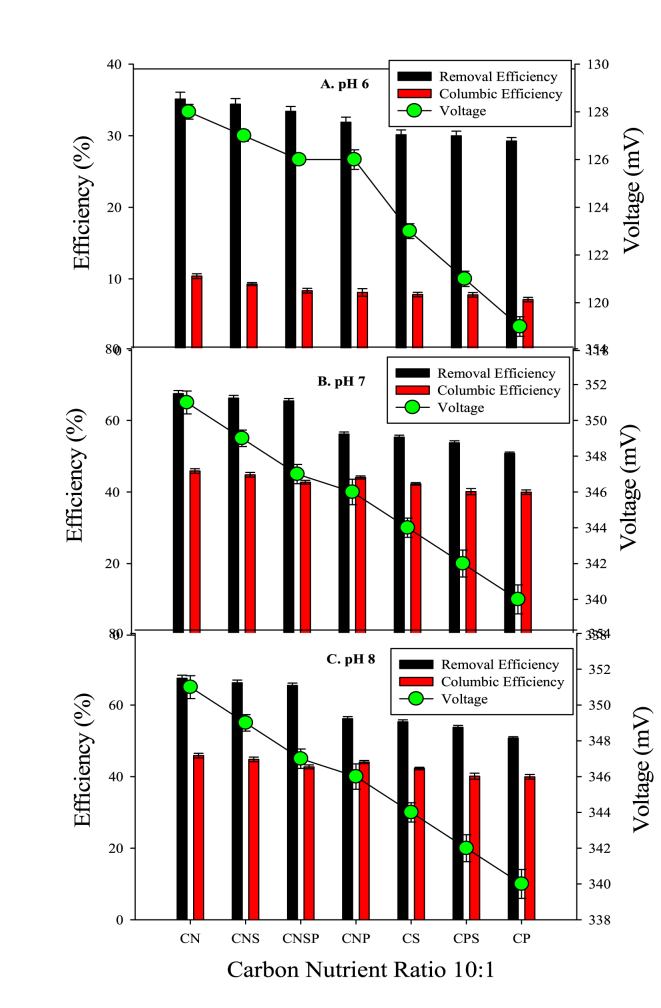
The columbic efficiency, removal efficiency and voltage production of seven different combinations of carbon (acetic acid, albumin and sucrose) with nutrients (C:N, C:P, C:S, C:N:S, C:P:S, C:N:P and C: N:S:P) were investigated at three different ratios (20:1, 15:1 and 10:1). The effects of various pH values were also explored for these combinations of carbon, and sulfur compounds (pH 6-8). The highest columbic efficiency (75.8%), COD removal efficiency (86%) and voltage (667 mV) were recorded when the acetic acid was used in the MFC and the lowest columbic efficiency (12.8%), removal efficiency (37.6%) and voltage (145 mV) were observed in case of albumin. A marked increase in columbic efficiency, removal efficiency and voltage production were seen with the rise in the pH value from 6 to 8. The lowest columbic efficiency, removal efficiency and voltage production were seen at pH 6 and highest at pH 8. At each investigated pH, the highest removal efficiency, columbic efficiency, and voltage were found at substrate ratio of 20:1 while lower at 10:1. At all pH values, the carbon to nutrient ratios seemed to have followed a similar trend i.e., the COD removal efficiency, columbic efficiency and voltage generation was found in the order C:N > C:N:S > C:N:S:P > C:N:P > C:S > C:P:S > C:P. In all cases, nitrogen showed a higher removal as compared to phosphorous and sulfur.
Keywords: Bioenergy; Columbic efficiency; Electronic equivalents; Substrate ratios; Voltage generation.
© 2021 The Authors. Published by Elsevier Ltd.
Conflict of interest statement
The authors declare no conflict of interest.
Figures


References
-
- Abeysiriwardana-Arachchige I.S.A., Munasinghe-Arachchige S.P., Delanka-Pedige H.M.K., Nirmalakhandan N. Removal and recovery of nutrients from municipal sewage: algal vs. conventional approaches. Water Res. 2020;175:115709. - PubMed
-
- APHA . Standard methods for the examination of water and wastewater. 21st Ed. American Public Health Association/American Water Works Association/Water Environment Federation; Washington DC: 2005.
-
- Cai J., Qaisar M., Sun Y. Effect of external resistance on substrate removal and electricity generation in microbial fuel cell treating sulfide and nitrate simultaneously. Environ. Sci. Pollut. Control Ser. 2020;27(1):238–249. - PubMed
-
- Cai J., Zheng P., Mahmood Q. Effect of cathode electron acceptors on simultaneous anaerobic sulfide and nitrate removal in microbial fuel cell. Water Sci. Technol. 2016;73(4):947–954. - PubMed
-
- Cai J., Zheng P., Qaisar M., Xing Y. Effect of operating modes on simultaneous anaerobic sulfide and nitrate removal in microbial fuel cell. J. Ind. Microbiol. Biotechnol. 2014;41(5):795–802. - PubMed
LinkOut - more resources
Full Text Sources
Miscellaneous
