

Matching in cluster randomized trials using the Goldilocks Approach
- PMID: 34195466
- PMCID: PMC8233129
- DOI: 10.1016/j.conctc.2021.100746
Matching in cluster randomized trials using the Goldilocks Approach
Abstract
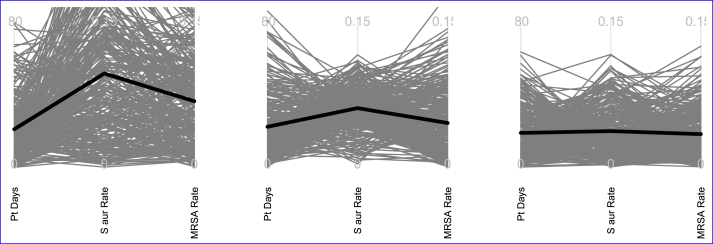
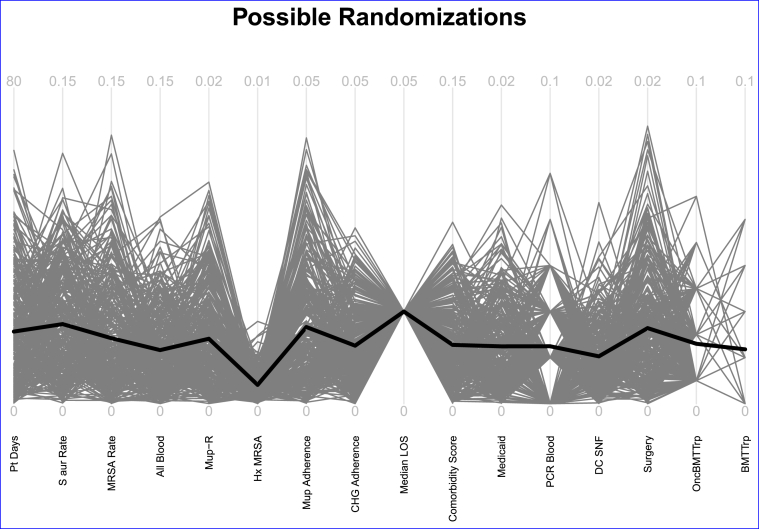
In group or cluster-randomized trials (GRTs), matching is a technique that can be used to improve covariate balance. When baseline data are available, we suggest a strategy that can be used to achieve the desired balance between treatment and control groups across numerous potential confounding variables. This strategy minimizes the overall within-pair Mahalanobis distance; and involves iteratively: 1) making pairs that minimize the distance between pairs of clusters with respect to potentially confounding variables; 2) visually assessing the potential effects of these pairs and resulting possible randomizations; and 3) reweighting variables of selecting weights to make pairs of clusters. In step 2, we plot the between-arm differences with a parallel-coordinates plot. Investigators can compare plots of different weighting schemes to determine the one that best suits their needs prior to the actual, final, randomization. We demonstrate application of the approach with the Mupirocin-Iodophor Swap Out trial. A webapp is provided.
Keywords: Baseline covariates; Matching; Randomization; Randomized trials.
© 2021 Published by Elsevier Inc.
Conflict of interest statement
All authors have no conflicts of interest to declare.
Figures
Similar articles
-
Optimal multivariate matching before randomization.Biostatistics. 2004 Apr;5(2):263-75. doi: 10.1093/biostatistics/5.2.263. Biostatistics. 2004. PMID: 15054030
-
Reweighted Mahalanobis distance matching for cluster-randomized trials with missing data.Pharmacoepidemiol Drug Saf. 2012 May;21 Suppl 2(0 2):148-54. doi: 10.1002/pds.3260. Pharmacoepidemiol Drug Saf. 2012. PMID: 22552990 Free PMC article.
-
Simple compared to covariate-constrained randomization methods in balancing baseline characteristics: a case study of randomly allocating 72 hemodialysis centers in a cluster trial.Trials. 2021 Sep 15;22(1):626. doi: 10.1186/s13063-021-05590-1. Trials. 2021. PMID: 34526092 Free PMC article.
-
Allocation of patients to conditions in headache clinical trials: randomization, stratification, and treatment matching.Headache. 2005 May;45(5):419-28. doi: 10.1111/j.1526-4610.2005.05093.x. Headache. 2005. PMID: 15953258 Review.
-
Randomization in substance abuse clinical trials.Subst Abuse Treat Prev Policy. 2006 Feb 6;1:6. doi: 10.1186/1747-597X-1-6. Subst Abuse Treat Prev Policy. 2006. PMID: 16722591 Free PMC article. Review.
Cited by
-
Effectiveness of intensive adherence counselling in achieving an undetectable viral load among people on antiretroviral therapy with low-level viraemia in Uganda.HIV Med. 2024 Feb;25(2):245-253. doi: 10.1111/hiv.13568. Epub 2023 Oct 18. HIV Med. 2024. PMID: 37853605 Free PMC article. Clinical Trial.
-
Improving Empiric Antibiotic Selection for Patients Hospitalized With Skin and Soft Tissue Infection: The INSPIRE 3 Skin and Soft Tissue Randomized Clinical Trial.JAMA Intern Med. 2025 Jun 1;185(6):680-691. doi: 10.1001/jamainternmed.2025.0887. JAMA Intern Med. 2025. PMID: 40208610 Clinical Trial.
-
Improving Empiric Antibiotic Selection for Patients Hospitalized With Abdominal Infection: The INSPIRE 4 Cluster Randomized Clinical Trial.JAMA Surg. 2025 Jul 1;160(7):733-743. doi: 10.1001/jamasurg.2025.1108. JAMA Surg. 2025. PMID: 40208583 Clinical Trial.
-
Stewardship Prompts to Improve Antibiotic Selection for Pneumonia: The INSPIRE Randomized Clinical Trial.JAMA. 2024 Jun 18;331(23):2007-2017. doi: 10.1001/jama.2024.6248. JAMA. 2024. PMID: 38639729 Free PMC article. Clinical Trial.
-
Rural libraries implementing walking groups or walking groups plus civic engagement for walkability in rural communities: a comparative effectiveness trial study protocol.BMC Public Health. 2023 Oct 2;23(1):1895. doi: 10.1186/s12889-023-16788-0. BMC Public Health. 2023. PMID: 37784086 Free PMC article.
References
-
- Balzer Laura B., Petersen Maya L., van der Laan Mark J. vol. 294. 2012. http://biostats.bepress.com/ucbbiostat/paper294 (Why Match in Individually and Cluster Randomized Trials? U.C. Berkeley Division of Biostatistics Working Paper Series).
-
- Hayes Richard J., Moulton Lawrence H. 2009. Cluster Randomised Trials. Chapman and HallCRC.
-
- Scott Neil W., McPherson Gladys C., Ramsay Craig R., Campbell Marion K. The method of minimization for allocation to clinical trials: a review. Contr. Clin. Trials. 2002;23(6):662–674. doi: 10.1016/S0197-2456(02)00242-8. http://www.sciencedirect.com/science/article/pii/S0197245602002428 ISSN 0197-2456. - DOI - PubMed
