

Detection of ovarian cancer (± neo-adjuvant chemotherapy effects) via ATR-FTIR spectroscopy: comparative analysis of blood and urine biofluids in a large patient cohort
- PMID: 34195877
- PMCID: PMC8405472
- DOI: 10.1007/s00216-021-03472-8
Detection of ovarian cancer (± neo-adjuvant chemotherapy effects) via ATR-FTIR spectroscopy: comparative analysis of blood and urine biofluids in a large patient cohort
Abstract
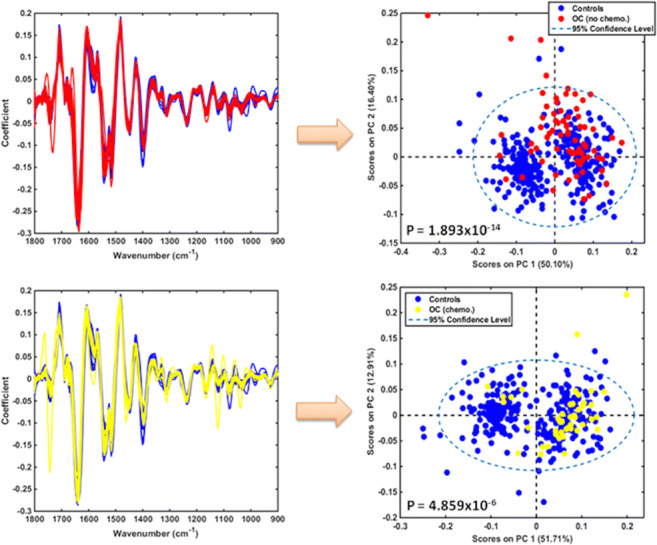
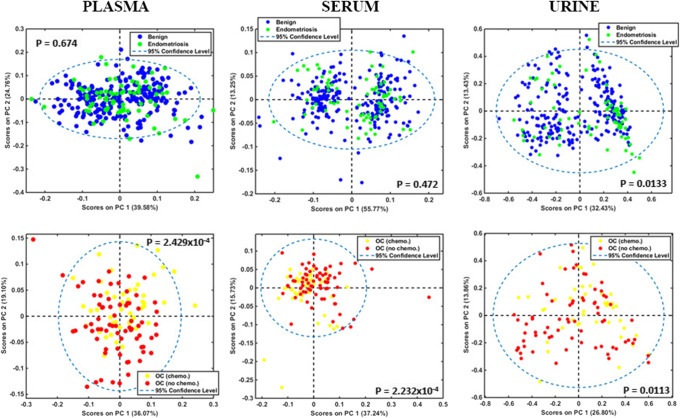
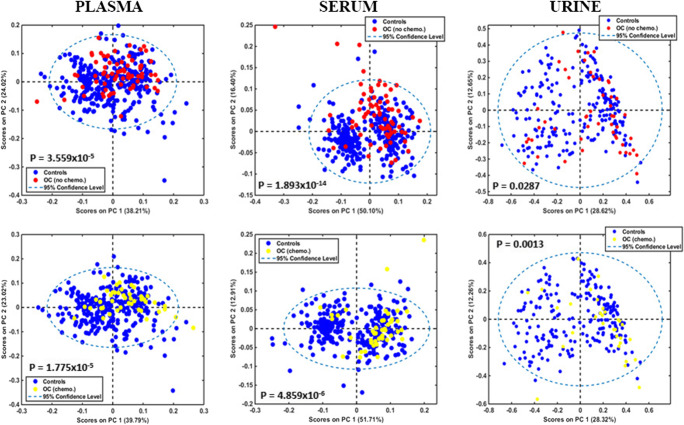
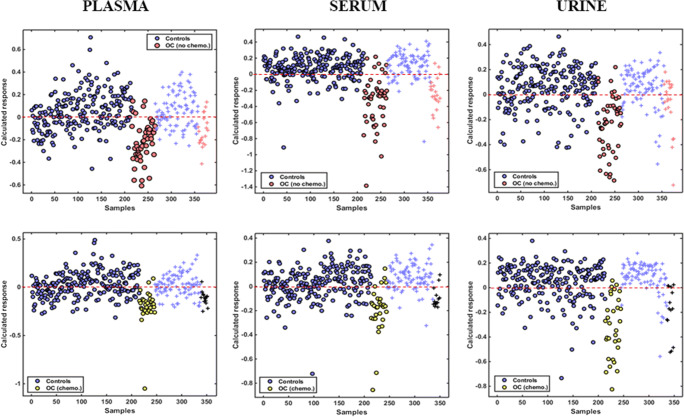
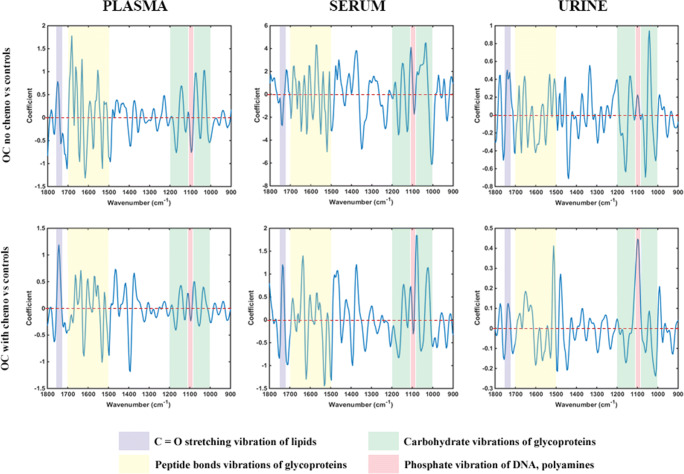
Ovarian cancer remains the most lethal gynaecological malignancy, as its timely detection at early stages remains elusive. Attenuated total reflection Fourier-transform infrared (ATR-FTIR) spectroscopy of biofluids has been previously applied in pilot studies for ovarian cancer diagnosis, with promising results. Herein, these initial findings were further investigated by application of ATR-FTIR spectroscopy in a large patient cohort. Spectra were obtained by measurements of blood plasma and serum, as well as urine, from 116 patients with ovarian cancer and 307 patients with benign gynaecological conditions. A preliminary chemometric analysis revealed significant spectral differences in ovarian cancer patients without previous chemotherapy (n = 71) and those who had received neo-adjuvant chemotherapy-NACT (n = 45), so these groups were compared separately with benign controls. Classification algorithms with blind predictive model validation demonstrated that serum was the best biofluid, achieving 76% sensitivity and 98% specificity for ovarian cancer detection, whereas urine exhibited poor performance. A drop in sensitivities for the NACT ovarian cancer group in plasma and serum indicates the potential of ATR-FTIR spectroscopy to identify chemotherapy-related spectral changes. Comparisons of regression coefficient plots for identification of biomarkers suggest that glycoproteins (such as CA125) are the main classifiers for ovarian cancer detection and responsible for smaller differences in spectra between NACT patients and benign controls. This study confirms the capacity of biofluids' ATR-FTIR spectroscopy (mainly blood serum) to diagnose ovarian cancer with high accuracy and demonstrates its potential in monitoring response to chemotherapy, which is reported for the first time. ATR-FTIR spectroscopy of blood serum achieves good segregation of ovarian cancers from benign controls, with attenuation of differences following neo-adjuvant chemotherapy.
Keywords: ATR-FTIR spectroscopy; Biofluids; Chemotherapy; Liquid biopsies; Ovarian cancer; Spectroscopy.
© 2021. The Author(s).
Conflict of interest statement
FLM holds positions and shareholdings in Biocel UK Ltd. and its subsidiary companies; these companies are developing spectrochemical tests for commercial gain.
All other authors have no conflicts of interest to declare.
Figures
References
-
- Reid F. The world ovarian cancer coalition atlas. Int Agency Res Cancer. 2018.
MeSH terms
Substances
LinkOut - more resources
Full Text Sources
Medical
Research Materials
Miscellaneous
