. 2021 Nov;86(5):2482-2496.
doi: 10.1002/mrm.28886. Epub 2021 Jun 30.

Design and characterization of a 3D-printed axon-mimetic phantom for diffusion MRI

Affiliations

Design and characterization of a 3D-printed axon-mimetic phantom for diffusion MRI

Farah N Mushtaha et al. Magn Reson Med. 2021 Nov.

Abstract

Purpose: To introduce and characterize inexpensive and easily produced 3D-printed axon-mimetic diffusion MRI phantoms in terms of pore geometry and diffusion kurtosis imaging metrics.

Methods: Phantoms were 3D-printed with a composite printing material that, after the dissolution of the polyvinyl alcohol, exhibits microscopic fibrous pores. Confocal microscopy and synchrotron phase-contrast micro-CT imaging were performed to visualize and assess the pore sizes. Diffusion MRI scans of four identical phantoms and phantoms with varying print parameters in water were performed at 9.4 T. Diffusion kurtosis imaging was fit to both data sets and used to assess the reproducibility between phantoms and effects of print parameters on diffusion kurtosis imaging metrics. Identical scans were performed 25 and 76 days later, to test their stability.

Results: Segmentation of pores in three microscopy images yielded a mean, median, and SD of equivalent pore diameters of 7.57 μm, 3.51 μm, and 12.13 μm, respectively. Phantoms had T1 /T2 = 2 seconds/180 ms, and those with identical parameters showed a low coefficient of variation (~10%) in mean diffusivity (1.38 × 10⁻³ mm2 /s) and kurtosis (0.52) metrics and radial diffusivity (1.01 × 10⁻³ mm2 /s) and kurtosis (1.13) metrics. Printing temperature and speed had a small effect on diffusion kurtosis imaging metrics (< 16%), whereas infill density had a larger and more variable effect (> 16%). The stability analysis showed small changes over 2.5 months (< 7%).

Conclusion: Three-dimension-printed axon-mimetic phantoms can mimic the fibrous structure of axon bundles on a microscopic scale, serving as complex, anisotropic diffusion MRI phantoms.

Keywords: diffusion MRI; modeling and analysis; validation.


Figures

FIGURE 1
FIGURE 1
Illustration of 3D‐printed axon mimetic (3AM) phantom microstructure and photos of printed phantoms. The cylinders in (B) represent a single line of printed material showing the printed material and the gaps in between the lines. The disks in (C)‐(E) consist of hundreds of individual printed lines (as illustrated in [A]) that are printed along the horizontal direction in (A,C,D) and perpendicular to the long axis of the test tube in (E). A, The 3AM phantom printing schematic, in which the material is printed along parallel lines. B, In each printed line, polyvinyl alcohol (PVA) dissolves away when placed in water, leaving the microporous structure. C, The 3AM phantom before dissolving. D, The 3AM phantom after dissolving. E, Dissolved 3AM phantoms stacked in a test tube with water that are ready for imaging
FIGURE 2
FIGURE 2
A, Confocal microscopy z‐stack image of a stained cross‐sectional phantom sample, averaged across slices. Elastomeric matrix (red) and pores (black) are visible. Each white outline indicates an individual line of material, as depicted in Figure 1B. B, The 2D projection of a 3D microscopy volume acquired with confocal microscopy. Regions shown in red are the matrix of the 3AM phantom that is composed of elastomer, while the black regions are pores. Outlined in yellow are larger pores caused by the printing pattern of the phantom. In both (A) and (B), the image plane is perpendicular to the long axis of the pores
FIGURE 3
FIGURE 3
A‐C, Confocal microscopy image before (left) and after (right) performing pore segmentation. Segmented pores are shown in black. D, Zoomed‐in picture of segmented pores on (A). E, Normalized histogram of pore equivalent diameters from the three segmentations in (A)‐(C) (total N = 10 762)
FIGURE 4
FIGURE 4
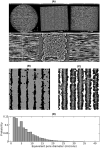
A, Synchrotron micro‐CT scan data at two zoom levels, transformed to align the lines of material with the viewing planes. Upper row: View of the entire‐scan region of interest. Lower row: Detailed view of a short length of five stacked lines of material. The direction of print‐head motion was left–right in the left‐most and right‐most columns, and perpendicular to the image in the center column. The remaining panels show a micro‐CT slice with air‐filled regions masked out (B), segmentation results with pores shown in white (C), and a histogram of pore equivalent diameters from 17 slices (D)
FIGURE 5
FIGURE 5
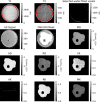
Examples of the produced maps in the nominal phantom. Top row: T1 and T2 maps with region‐of‐interest (ROI) mask outline superimposed (colormap limits drawn from within the ROI), and selected water‐filled voxels between the phantom and test tube. Second row: Example of non–diffusion‐weighted image (DWI), ROI mask superimposed on the non‐DWI, and mean diffusivity (MD). Third and fourth rows: Diffusion kurtosis imaging (DKI) diffusivity metrics. Abbreviations: AD, axial diffusivity axial diffusivity; AK, axial kurtosis; RD, radial diffusivity; RK, radial kurtosis
FIGURE 6
FIGURE 6
Mean fractional anisotropy (FA), diffusivities, and kurtosis with different phantom printing parameters. A‐C, Different metrics with different printing temperatures. D‐F, Different metrics with different printing speeds. G‐I, Different metrics with different layer thicknesses. J‐L, Different metrics with different infill densities. Violin plots correspond to the distribution of a metric over all the voxels in a phantom
FIGURE 7
FIGURE 7
A, Mean FA of a nominal phantom over 76 days. B, The MD of a nominal phantom over 76 days. C, Mean kurtosis of a nominal phantom over 76 days. Violin plots correspond to the distribution of a metric over all the voxels in a phantom
FIGURE 8
FIGURE 8
Mean experimentally observed (Exp) and simulated (Sim) DKI metrics. Error bars show one SD above and below the mean experimentally observed value. The experimentally observed values correspond to the values in Table 2, and the simulated metrics originate from fitting to noise‐free signals, so there is one value and no error bar associated with each metric: AD (A), RD (B), MD (C), FA (D), AK (E), RK (F), and mean kurtosis (MK) (G)

References

    1. Fieremans E, Lee H‐H. Physical and numerical phantoms for the validation of brain microstructural MRI: a cookbook. Neuroimage. 2018;182:39‐61. - PMC - PubMed
    1. Keenan KE, Ainslie M, Barker AJ, et al. Quantitative magnetic resonance imaging phantoms: a review and the need for a system phantom. Magn Reson Med. 2018;79:48‐61. - PubMed
    1. Beltrachini L, Taylor ZA, Frangi AF. A parametric finite element solution of the generalised Bloch‐Torrey equation for arbitrary domains. J Magn Reson. 2015;259:126‐134. - PubMed
    1. Grebenkov DS. Exploring diffusion across permeable barriers at high gradients. II. Localization regime. J Magn Reson. 2014;248:164‐176. - PubMed
    1. Seehaus A, Roebroeck A, Bastiani M, et al. Histological validation of high‐resolution DTI in human post mortem tissue. Front Neuroanat. 2015;9:98. - PMC - PubMed

Publication types

Grants and funding