. 2021 Sep;41(9):2431-2451.
doi: 10.1161/ATVBAHA.121.316219. Epub 2021 Jul 1.

Salt-Inducible Kinase 3 Promotes Vascular Smooth Muscle Cell Proliferation and Arterial Restenosis by Regulating AKT and PKA-CREB Signaling

Affiliations

Salt-Inducible Kinase 3 Promotes Vascular Smooth Muscle Cell Proliferation and Arterial Restenosis by Regulating AKT and PKA-CREB Signaling

Yujun Cai et al. Arterioscler Thromb Vasc Biol. 2021 Sep.

Abstract

Objective: Arterial restenosis is the pathological narrowing of arteries after endovascular procedures, and it is an adverse event that causes patients to experience recurrent occlusive symptoms. Following angioplasty, vascular smooth muscle cells (SMCs) change their phenotype, migrate, and proliferate, resulting in neointima formation, a hallmark of arterial restenosis. SIKs (salt-inducible kinases) are a subfamily of the AMP-activated protein kinase family that play a critical role in metabolic diseases including hepatic lipogenesis and glucose metabolism. Their role in vascular pathological remodeling, however, has not been explored. In this study, we aimed to understand the role and regulation of SIK3 in vascular SMC migration, proliferation, and neointima formation.

Approach and results: We observed that SIK3 expression was low in contractile aortic SMCs but high in proliferating SMCs. It was also highly induced by growth medium in vitro and in neointimal lesions in vivo. Inactivation of SIKs significantly attenuated vascular SMC proliferation and up-regulated p21CIP1 and p27KIP1. SIK inhibition also suppressed SMC migration and modulated actin polymerization. Importantly, we found that inhibition of SIKs reduced neointima formation and vascular inflammation in a femoral artery wire injury model. In mechanistic studies, we demonstrated that inactivation of SIKs mainly suppressed SMC proliferation by down-regulating AKT (protein kinase B) and PKA (protein kinase A)-CREB (cAMP response element-binding protein) signaling. CRTC3 (CREB-regulated transcriptional coactivator 3) signaling likely contributed to SIK inactivation-mediated antiproliferative effects.

Conclusions: These findings suggest that SIK3 may play a critical role in regulating SMC proliferation, migration, and arterial restenosis. This study provides insights into SIK inhibition as a potential therapeutic strategy for treating restenosis in patients with peripheral arterial disease.

Keywords: cell proliferation; inflammation; neointima; phenotype; vascular remodeling.


Figures
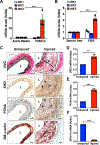
Figure 1.
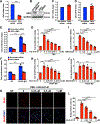
Figure 1.. SIK3 is highly expressed in growing SMCs in vitro as well as neointimal lesions in vivo.
A. qPCR data showing mRNA levels of SIKs in growing and contractile SMCs. Contractile SMCs (normal aortic medial SMCs) were isolated from rat aortic media by peeling off the adventitia and scraping the endothelial layer. Synthetic SMCs (cultured aortic SMCs) were obtained from corresponding aortic media using an explant method. B. Effects of FBS on mRNA levels of SIKs in SMCs. Rat aortic SMCs were starved and then stimulated with 5% FBS for 24 h. C. Representative immunohistochemistry images showing the expression of SIK3 and PCNA (a proliferation marker), and SM-α-actin (a SMC marker) in injured and uninjured arteries in mice. Arterial injury was induced using a femoral artery wire injury procedure. Left femoral artery was injured to induce neointima formation. Right femoral artery was uninjured control. Elastin fiber was stained using VVG method. D–F. qPCR data showing mRNA expression of SIK3, PCNA, and MYH11 (a SMC contractile marker) in injured and uninjured arteries. qPCR results were normalized using GAPDH. Data were analyzed by t-test. Values are mean ± SD (n=3). **P < 0.01, ***P < 0.001. N, neointima; M, media; L, lumen. Arrow, SIK3 positive or PCNA positive staining. Scale bar, 25 μm.
Figure 2.
Figure 2.. Knockdown and inhibition of SIK3 suppress SMC proliferation in vitro.
A-D. Knockdown of SIK3 specific decreased SIK3 without affecting SIK1 and SIK2 in SMCs. mRNA and protein levels of SIK3 were determined by qPCR and western blotting, respectively (A-B), and mRNA expression of SIK1 and SIK2 was examined by qPCR (C-D). E-F. Effects of SIK3 knockdown on SMC proliferation. Rat aortic SMCs were transfected with 100 nM scrambled siRNA or SIK3 siRNA, and then serum-free (SF) starved, followed by stimulation with 5% FBS or 50 ng/ml PDGF-BB for 48 h. G-J. Effects of SIK inhibition on SMC proliferation. Rat aortic SMCs were serum-free starved and then treated with SIK inhibitors HG-9–91–01 or MRT67307 for 0.5 h, followed by stimulated with 5% FBS or 50 ng/ml PDGF-BB for 48 h. Cell proliferation was measured by SRB assay. K. Representative immunofluorescence images showing the effects of HG-9–91–01 on SMC proliferation. L. Quantitative results of immunofluorescence staining. Rat aortic SMCs were serum-free (SF) starved and then treated with HG-9–91–01, followed by stimulation with 5% FBS for 24 h. 40 μM of BrdU was added at 2.5 h before harvesting cells. The proliferative cells were stained with BrdU antibody. Nuclei were stained with DAPI. Data were analyzed by t-test, one-way ANOVA or two-way ANOVA with multiple comparisons. ANOVA analysis was corrected with post hoc test. Values are mean ± SD (n=3–4). *P < 0.05, ***P < 0.001.
Figure 3.
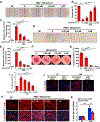
Figure 3.. SIK inhibition suppresses SMC proliferation and up-regulates p21CIP1 and p27KIP1.
A. Representative flow cytometry analysis showing the effects of SIK inhibition on cell cycle. Rat aortic SMCs were serum-free (SF) starved and then treated with SIK inhibitor HG-9–91–01 for 0.5 h, followed by stimulated with 5% FBS for 24 h. Cell cycle was assessed using flow cytometry. B. Quantitative results of flow cytometry analysis. C-H. qPCR data showing the effects of SIK inhibitor on expression of PCNA, cyclin D, E1 and B1, p21CIP1 and p27KIP1 during SMC proliferation. Rat aortic SMCs were serum-free starved and then treated with SIK inhibitor HG-9–91–01 for 0.5 h, followed by stimulated with 5% FBS for 18 h. Levels of mRNA were examined using qPCR. Results were normalized using GAPDH. Data were analyzed by one-way ANOVA or two-way ANOVA with multiple comparisons. ANOVA analysis was corrected with post hoc test. Values are mean ± SD (n=3). *P < 0.05, **P < 0.01, ***P < 0.001.
Figure 4.
Figure 4.. SIK inactivation attenuates SMC migration and modulates actin polymerization.
A. Representative images from the wound-healing assay showing the effects of SIK inhibition on SMC migration. B-C. Quantitative results of wound-healing assay. Confluent rat aortic SMCs in 35 mm dishes were serum-free starved then treated with SIK inhibitor HG-9–91–01 for 0.5 h, followed by stimulated with 5% FBS for 6 h. D. Representative images from the modified Boyden chamber assay showing the effects of SIK inhibition on SMC migration. E. Quantitative data of modified Boyden chamber assay. Rat aortic SMCs seeded in Transwells in a 24-well plate were treated with SIK inhibitor HG-9–91–01 for 0.5 h and then stimulated with 5% FBS for 6 h. F. Representative images showing the effects of HG-9–91–01 on growth factors-induced SMC outgrowth ex vivo. Aortic media explants were embedded in a type I collagen 3D gel and treated with HG-9–91-01, followed by stimulation with 10 ng/ml PDGF-BB and 10 ng/ml FGF2 for 10 days. G. Quantitative results from 3D culture system ex vivo. H. Representative immunofluorescence images showing the effects of SIK inhibition on FBS-induced actin polymerization. Rat aortic SMCs were serum-free starved and then treated with SIK inhibitor HG-9–91–01 for 0.5 h, followed by stimulation with 5% FBS for 24 h. I. Quantitative results of F-actin cytoskeleton immunostaining. J-K. Effects of SIK3 knockdown on FBS-induced actin polymerization. Rat aortic SMCs were transfected with 100 nM scrambled siRNA or SIK3 siRNA, and then serum-free starved, followed by stimulation with 5% FBS for 24 h. F-actin cytoskeleton was immunostained using Phalloidin CruzFluor 594 Conjugate. Nuclei were stained with DAPI. Data were analyzed by one-way ANOVA or two-way ANOVA with multiple comparisons. ANOVA analysis was corrected with post hoc test. Values are mean ± SD. n=3–5. **P < 0.01, ***P < 0.001.
Figure 5.
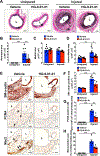
Figure 5.. SIK inhibition reduces neointima formation following arterial injury.
The femoral artery wire injury procedure was used to induce neointima formation in mice. A. Representative VVG staining showing the effects of SIK inhibition on arterial injury-induced neointima formation. After wire injury on left femoral artery, a 50 μl of 20% pluronic F-127 gel containing 10 μM of SIK inhibitor HG-9–91–01 or vehicle was immediately applied around the injured vessel. Right femoral artery is uninjured vessel. Animals were harvested after 4 weeks. Elastic lamina was stained using VVG method. Scale bar, 50 μm. B-D. Morphometric analysis of intimal, medial and lumen areas by ImageJ software. n=8–9. E. Representative immunohistochemistry images showing the effects of SIK inhibition on SM-α-actin (SMC marker), PCNA (proliferation marker), and Mac2 (inflammation markers) after wire injury. Insets are uninjured vessels. Hematoxylin was used for counterstaining. Scale bar, 25 μm. F-H. Quantitative results of the expression of SM-α-actin, PCNA, and Mac2. n=5. Data were analyzed by two-way ANOVA with multiple comparisons. ANOVA analysis was corrected with post hoc test. Values are mean ± SE. *P < 0.05, **P < 0.01, ***P < 0.001. N, neointima; M, media; L, lumen. Arrow, PCNA positive cells or Mac2 positive area.
Figure 6.
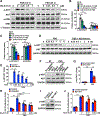
Figure 6.. SIK inactivation suppresses SMC proliferation through inhibiting AKT signaling.
A. Representative western blotting images showing the effects of SIK inhibition on FBS-induced p-AKT and p-ERK1/2. Rat aortic SMCs were serum-free (SF) starved and then treated with the indicated concentrations of SIK inhibitor HG-9–91–01 for 0.5 h, followed by stimulated with 5% FBS for 0.5 h and 24 h. B-C. Quantitative results of p-AKT and p-ERK1/2. Data were normalized with total AKT or ERK1/2. D–E. Western blotting results showed that HG-9–91–01 time-dependently attenuated FBS-induced p-AKT. Rat aortic SMCs were serum-free starved and then treated with 1 μM of HG-9–91–01 for 0.5 h, followed by stimulation with 5% FBS for indicated time points. F-G. Knockdown of SIK3 decreased FBS-induced p-AKT. Rat aortic SMCs were transfected with 100 nM scrambled siRNA or SIK3 siRNA, then serum-free starved, followed by stimulation with 5% FBS for 24 h. H. Effects of a combination of SIK inhibitor and AKT inhibitor on SMC proliferation. Rat aortic SMCs were serum-free starved and then treated with 5 μM AKT inhibitor LY294002 and indicated concentrations of HG-9–91–01, followed by stimulation with 5% FBS for 48 h. I-J. Effects of a constitutively activated AKT on SIK inhibition-suppressed SMC proliferation. Rat aortic SMCs were transfected with Myr-AKT and control plasmids using electroporation, and then serum-free starved and treated with SIK inhibitor HG-9–91–01, followed by stimulation with 5% FBS for 48 h. I. Western blotting showed that transfection with Myr-AKT activated AKT signaling. J. Myr-AKT rescued SIK inhibition-suppressed SMC proliferation. Cell proliferation was assessed using SRB assay. Data were analyzed by two-way ANOVA with multiple comparisons. ANOVA analysis was corrected with post hoc test. Values are mean ± SD. n=3. *P < 0.05, **P < 0.01, ***P < 0.001, n.s., no statistical significance.
Figure 7.
Figure 7.. SIK inactivation suppresses SMC proliferation through down-regulating PKA-CREB signaling.
A. Representative western blotting images showing the effects of SIK inhibition on FBS-induced PKA-CREB signaling. Rat aortic SMCs were serum-free starved and then treated with 1 μM SIK inhibitor HG-9–91–01 for 0.5 h, followed by stimulation with 5% FBS for indicated time-points. PKA activity was assessed by its substrate p-Ser157-VASP. B-C. Quantitative results of p-Ser157-VASP and p-CREB. Data were normalized with GAPDH or total CREB. D–E. Effects of SIK3 knockdown on FBS-induced PKA-CREB signaling. Rat aortic SMCs were transfected with 100 nM scrambled siRNA or SIK3 siRNA, then serum-free (SF) starved, followed by stimulation with 5% FBS for 24 h. F-G. Effects of inactivation of PKA or CREB on SMC proliferation. Rat aortic SMCs were serum-free starved and then treated with various concentrations of PKA inhibitor H89 or CREB inhibitor 666–15 for 0.5 h, followed by stimulation with 5% FBS for 48 h. H. Effects of CREB signaling on SIK inhibition-suppressed SMC proliferation. Rat aortic SMCs were serum-free starved, then treated with 5 μM 666–15 in the presence of 0.25 μM HG-9–91–01, followed by stimulation with 5% FBS for 48 h. I. Western blotting showing knockdown efficiency of CREB siRNA. J. Effects of CREB knockdown on SIK inhibition-suppressed SMC proliferation. Rat aortic SMCs were transfected with 50 nM scrambled siRNA or CREB siRNA, then serum-free starved, followed by treatment with various concentrations of HG-9–91–01 for 48 h. Cell proliferation was assessed using SRB assay. Data were analyzed by one-way ANOVA or two-way ANOVA with multiple comparisons. ANOVA analysis was corrected with post hoc test. Values are mean ± SD. n=3. *P < 0.05, **P < 0.01, ***P < 0.001, n.s., no statistical significance.
Figure 8.
Figure 8.. SIK inactivation suppresses cAMP-triggered CREB signaling.
A-B. Effects of elevated cAMP on SMC proliferation. Rat aortic SMCs were serum-free starved and then treated with various concentrations of Forskolin (an adenylyl cyclase activator) or db-cAMP (an cAMP analog), followed by stimulation with 5% FBS for 2 days. C. Representative western blotting images showing the effects of SIK inhibition on cAMP-mediated PKA/CREB signaling. Rat aortic SMCs were treated with 0.5 μM HG-9–91–01 for 0.5 h, and then treated with 100 μM forskolin or 0.5 mM db-cAMP for 0.5 h. D. Quantitative results of p-Ser157-VASP expression. Data were normalized with GAPDH. E. Quantitative results of p-CREB. Data were normalized with total CREB. F. Effects of SIK inhibition on cAMP signaling-inhibited SMC proliferation. Rat aortic SMCs were treated with 0.5 μM HG-9–91–01 for 0.5 h and then treated with 100 μM forskolin or 0.5 mM db-cAMP for 48 h. Cell proliferation was assessed using SRB assay. Data were analyzed by one-way ANOVA or two-way ANOVA with multiple comparisons. ANOVA analysis was corrected with post hoc test. Values are mean ± SD. n=3. **P < 0.01, ***P < 0.001, n.s., no statistical significance.
Figure 9.
Figure 9.. SIK inactivation-mediated CRTC3 signaling likely contributes to its anti-proliferative effect.
A. qPCR data showing the expression of CRTC1, 2, and 3 in cultured SMCs. B. Representative immunofluorescence images showing the effects of SIK inhibition on CRTC3 nuclear translocation. Rat aortic SMCs were serum-free (SF) starved and then treated with 1 μM HG-9–91–01 or 4 μM MRT67307 for 0.5 h, followed by stimulation with 5% FBS for 6 h. C. Quantitative results of nuclear CRTC3. D. Effects of forskolin-mediated cAMP signaling on CRTC3 nuclear translocation. Rat aortic SMCs were treated with 10 μM cAMP activator forskolin for 0.5 h. CRTC3 intracellular trafficking was determined by immunofluorescence staining using an anti-CRTC3 antibody. E. Effects of CRTC3 knockdown on SIK inactivation-suppressed SMC proliferation. Rat aortic SMCs were transfected with 100 nM scrambled siRNA or CRTC3 siRNA, serum-free starved, and then treated with HG-9–91–01 for 0.5 h, followed by stimulation with 5% FBS for 48 h. F. Effects of CRTC3 knockdown on SIK3 siRNA-suppressed SMC proliferation. Rat aortic SMCs were transfected with 100 nM CRTC3 siRNA or SIK3 siRNA, or scrambled siRNA, 0.5% FBS starved, and then treated with HG-9–91–01 for 0.5 h, followed by stimulation with 5% FBS for 48 h. Cell proliferation was assessed using SRB assay. Data were analyzed by one-way ANOVA or two-way ANOVA with multiple comparisons. ANOVA analysis was corrected with post hoc test. Values are mean ± SD. n=3. ***P < 0.001, n.s., no statistical significance.
Figure 10.
Figure 10.. SIK inactivation-mediated suppression of SMC proliferation is independent of HDAC4.
A-C. Effects of SIK inhibition on mRNA and protein levels of HDAC4. Rat aortic SMCs were serum-free starved and then treated with various concentrations of HG-9–91–01 for 0.5 h, followed by stimulation with 5% FBS for 24 h. D. Representative immunofluorescence images showing the effects of SIK inhibition on HDAC4 intracellular trafficking. Rat aortic SMCs were transfected with pEGFP-HDAC4 or pEGFP-HDAC4–3SA using electroporation and then treated with 1 μM SIK inhibitor HG-9–91–01 for 24 h. Nuclei were stained with DAPI. E. Effects of SIK3 knockdown on HDAC4 nuclear translocation. Rat aortic SMCs were co-transfected with pEGFP-HDAC4 and SIK3 siRNA, or Scrambled siRNA using electroporation for 48 h, and then treated with 1 μM SIK inhibitor HG-9–91–01 for 6 h. F. Effects of HDAC4 inhibitor on SIK inhibition-suppressed SMC proliferation. Rat aortic SMCs were serum-free starved, and then treated with 10 μM HDAC4 inhibitor MC1568, followed by stimulation with HG-9–91–01 for 0.5 h, followed by stimulation with 5% FBS for 48 h. G-I. Effects of HDAC4 knockdown on SIK inhibition-suppressed SMC proliferation. Rat aortic SMCs were transfected with 50 nM scrambled siRNA or HDAC4 siRNA, serum-free starved, and then treated with HG-9–91–01 for 0.5 h, followed by stimulation with 5% FBS for 48 h. qPCR and western blotting showing knockdown of HDAC4 (G-H). Cell proliferation was assessed using SRB assay. Data were analyzed by t test, one-way ANOVA or two-way ANOVA with multiple comparisons. ANOVA analysis was corrected with post hoc test. Values are mean ± SD. n=3. *P < 0.05, **P < 0.01, ***P < 0.001.

Comment in

References

    1. Thukkani AK and Kinlay S. Endovascular intervention for peripheral artery disease. Circ Res. 2015;116:1599–613. - PMC - PubMed
    1. Schillinger M, Sabeti S, Loewe C, Dick P, Amighi J, Mlekusch W, Schlager O, Cejna M, Lammer J and Minar E. Balloon angioplasty versus implantation of nitinol stents in the superficial femoral artery. N Engl J Med. 2006;354:1879–88. - PubMed
    1. Owens GK, Kumar MS and Wamhoff BR. Molecular regulation of vascular smooth muscle cell differentiation in development and disease. Physiol Rev. 2004;84:767–801. - PubMed
    1. Regan CP, Adam PJ, Madsen CS and Owens GK. Molecular mechanisms of decreased smooth muscle differentiation marker expression after vascular injury. J Clin Invest. 2000;106:1139–47. - PMC - PubMed
    1. Jukema JW, Verschuren JJ, Ahmed TA and Quax PH. Restenosis after PCI. Part 1: pathophysiology and risk factors. Nat Rev Cardiol. 2012;9:53–62. - PubMed

Publication types

MeSH terms