. 2021 Jul 1;131(13):e136778.
doi: 10.1172/JCI136778.

Basophils balance healing after myocardial infarction via IL-4/IL-13

Affiliations

Basophils balance healing after myocardial infarction via IL-4/IL-13

Florian Sicklinger et al. J Clin Invest. .

Abstract

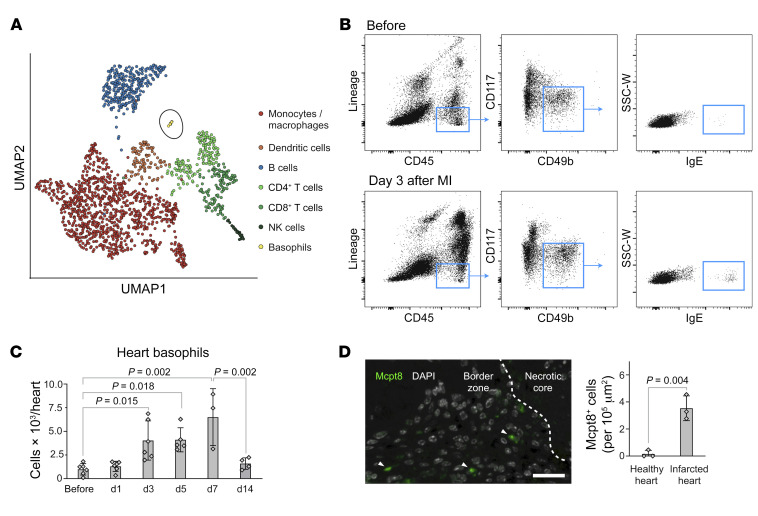
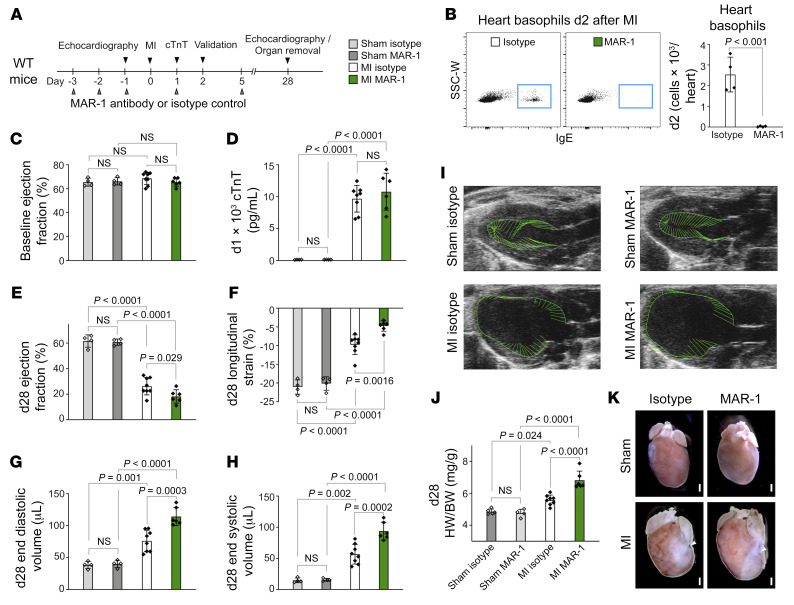
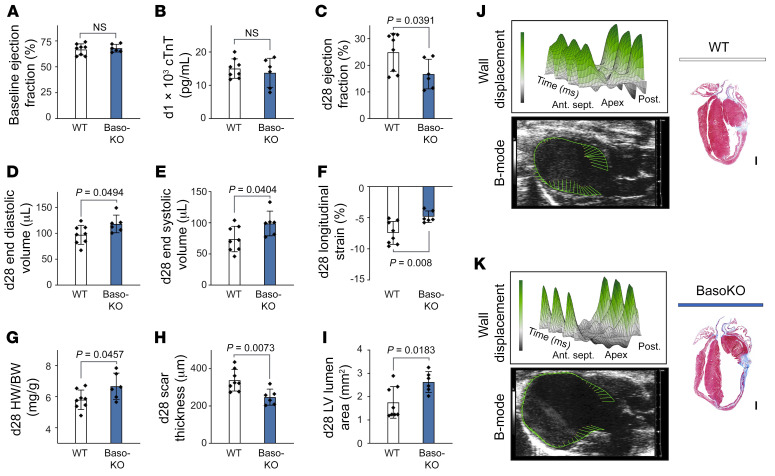
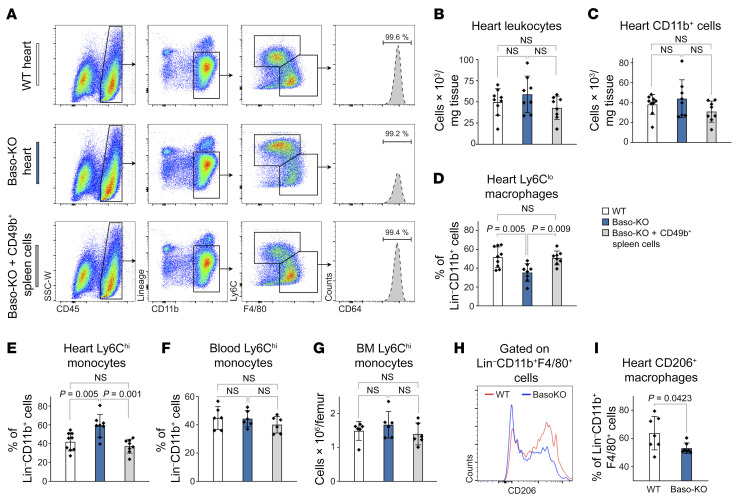
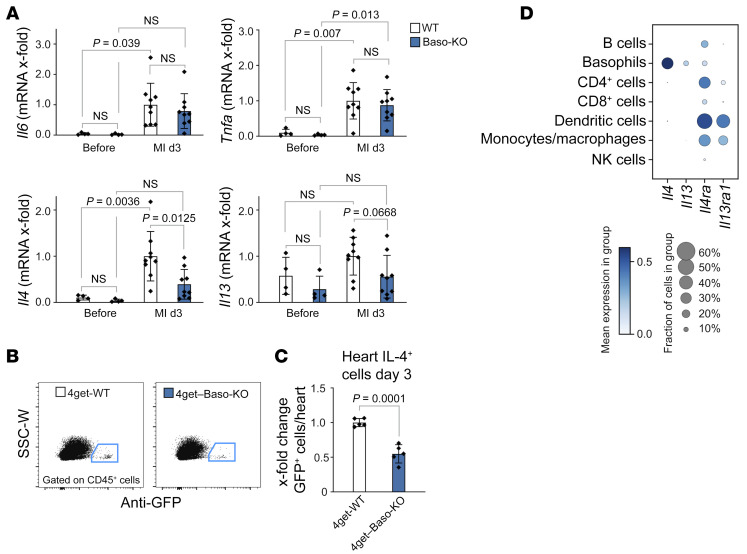
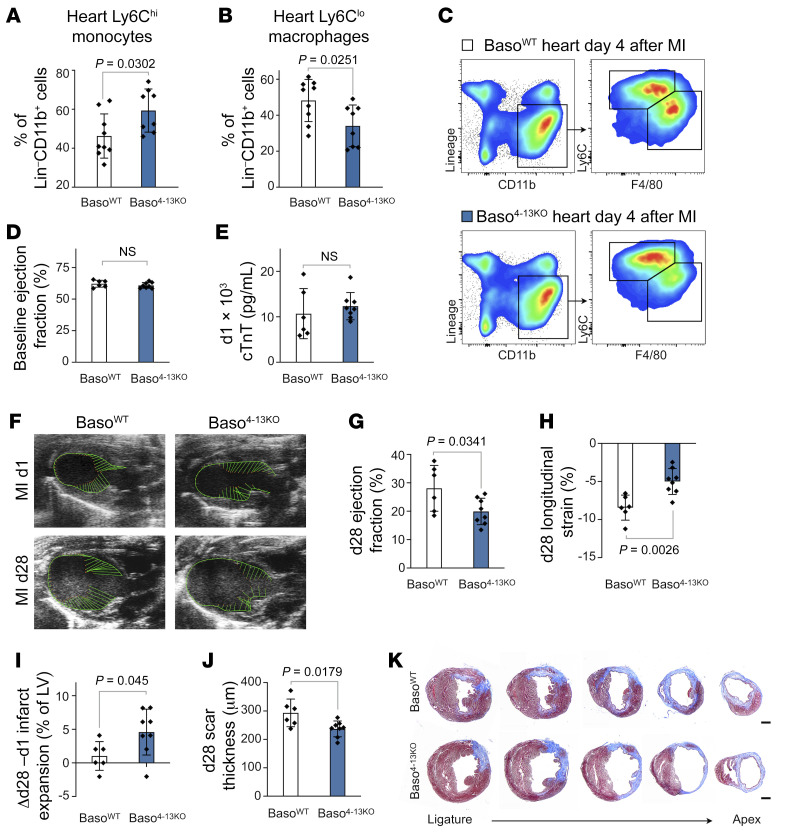
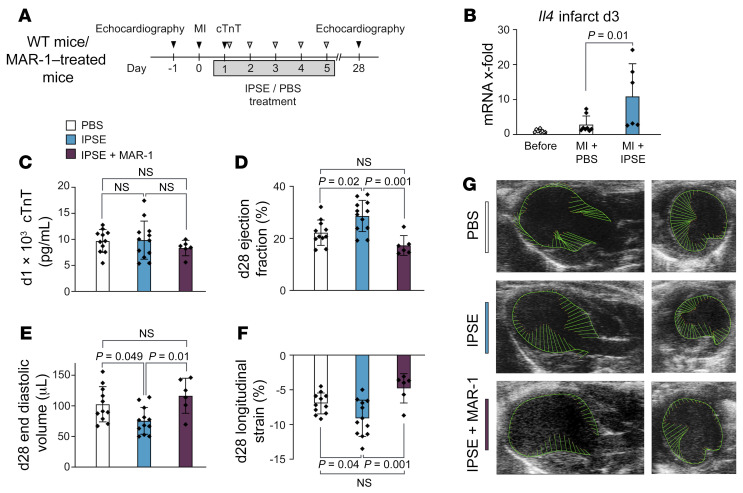
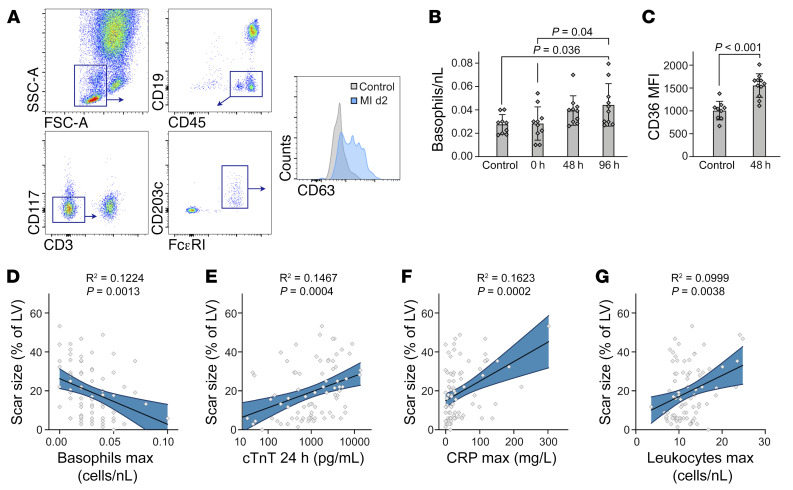
The inflammatory response after myocardial infarction (MI) is a precisely regulated process that greatly affects subsequent remodeling. Here, we show that basophil granulocytes infiltrated infarcted murine hearts, with a peak occurring between days 3 and 7. Antibody-mediated and genetic depletion of basophils deteriorated cardiac function and resulted in enhanced scar thinning after MI. Mechanistically, we found that basophil depletion was associated with a shift from reparative Ly6Clo macrophages toward increased numbers of inflammatory Ly6Chi monocytes in the infarcted myocardium. Restoration of basophils in basophil-deficient mice by adoptive transfer reversed this proinflammatory phenotype. Cellular alterations in the absence of basophils were accompanied by lower cardiac levels of IL-4 and IL-13, two major cytokines secreted by basophils. Mice with basophil-specific IL-4/IL-13 deficiency exhibited a similarly altered myeloid response with an increased fraction of Ly6Chi monocytes and aggravated cardiac function after MI. In contrast, IL-4 induction in basophils via administration of the glycoprotein IPSE/α-1 led to improved post-MI healing. These results in mice were corroborated by the finding that initially low counts of blood basophils in patients with acute MI were associated with a worse cardiac outcome after 1 year, characterized by a larger scar size. In conclusion, we show that basophils promoted tissue repair after MI by increasing cardiac IL-4 and IL-13 levels.

Keywords: Cardiology; Cardiovascular disease; Heart failure; Innate immunity.


Conflict of interest statement

Conflict of interest: The authors have declared that no conflict of interest exists.

Figures

Figure 1
Figure 1. Basophil granulocytes infiltrate the heart after permanent LAD ligation in mice.
(A) UMAP embedment of single-cell RNA-Seq data for cells isolated from the infarct region of a WT mouse heart 7 days after MI. (B) Representative images of flow cytometric analysis of heart tissue before and 3 days after MI. SSC-W, side scatter pulse width. (C) Flow cytometric time course of LinCD45+CD117CD49b+IgE+ cells after MI in WT mice (n = 3–6). Data show the mean ± SD. P values were determined by 1-way ANOVA with Sidak’s multiple-comparison post hoc test. (D) Immunohistochemical staining of Mcpt8+ cells (green, arrowhead) in the infarct region 7 days after MI. Nuclei are depicted in white (DAPI). Scale bar: 20 μm. Data show the mean ± SD. P value was determined by 2-tailed Student’s t test (n = 3).
Figure 2
Figure 2. Basophil depletion by antibody injection worsens cardiac function after acute MI in mice.
(A) Timeline of basophil depletion experiments. (B) Frequencies of basophils from of hearts of IgG-injected control and anti-FcεRI–injected animals were assessed by flow cytometry 2 days (d2) after MI (n = 4). Data show the mean ± SD. P value was determined by 2-tailed Student’s t test. (C) Echocardiographic evaluation of baseline EF in IgG- and MAR-1–treated mice. (D) Plasma levels of cTnT in IgG- and MAR-1–treated mice were measured 24 hours after LAD ligation or sham intervention. P values were determined by 2-way ANOVA followed by Tukey’s multiple-comparison test. (EH) Echocardiographic results for IgG-treated and MAR-1–treated mice 4 weeks after MI or sham surgery. P values were determined by 2-way ANOVA followed by Tukey’s multiple-comparison test. (I) Representative echocardiographic images 4 weeks after MI. Vectors display the direction and magnitude of myocardial contraction at midsystole. (J) Quantification of heart weight to body weight ratio (HW/BW) determined 4 weeks after MI (n = 4–8). Data show the mean ± SD. P values were determined by 2-way ANOVA followed by Tukey’s multiple-comparison test. (K) Representative hearts from IgG- and MAR-1–treated mice 4 weeks after MI or sham intervention. Arrowheads indicate the site of ligation. Scale bars: 500 μm.
Figure 3
Figure 3. Baso-KO mice show deteriorated healing after MI.
(A) Echocardiographic evaluation of baseline EF in WT and Baso-KO mice. (B) Plasma cTnT values in WT and Baso-KO mice measured 24 hours after LAD ligation. (CF) Echocardiographic results for Baso-KO and WT mice 4 weeks after MI. P values were determined by 2-tailed Student’s t test. (G) Quantification of heart weight to body weight ratio 4 weeks after MI. P value was determined by 2-tailed Student’s t test. (H and I) Scar thickness and LV lumen area were quantified by histological evaluation 4 weeks after MI (n = 6–8). Data show the mean ± SD. P values were determined by 2-tailed Student’s t test. (J and K) Representative echocardiographic and histological images of WT and Baso-KO mice 4 weeks after MI. 3D plots show radial displacement over 3 cardiac cycles. Histological sections were stained with Masson’s trichrome to detect fibrosis. Scale bars: 500 μm. Ant. sept., anterior septal; Post., posterior.
Figure 4
Figure 4. Genetic basophil depletion affects cardiac monocytes and macrophages.
(A) Representative flow cytometric plots of infarct tissue 4 days after MI, following transfer of basophil-enriched cells (bottom) gated on monocytes/macrophages. Heart cells were from WT and Baso-KO mice, and splenic cells were from WT mice. (B and C) Quantification of total numbers of CD45+ cells or CD45+CD11b+ cells per milligram of heart tissue. (D and E) Percentage of heart-infiltrating Ly6Chi monocytes and Ly6CloCD64+ macrophages (among the percentage of total LinCD11b+ cells) 4 days after LAD ligation (n = 8–9). Data indicate the mean ± SD. P values were determined by 1-way ANOVA followed by Tukey’s multiple-comparison test. (F and G) Blood and BM monocyte levels for the indicated groups 4 days after MI (n = 6). (H) Representative histogram depicting CD206+ cells among LinCD11b+F4/80+ macrophages 4 days after MI. (I) Proportion of CD206+ cells among LinCD11b+F4/80+ macrophages in the heart 4 days after MI (n = 7). Data show the mean ± SD. P value was determined by 2-tailed Student’s t test.
Figure 5
Figure 5. Basophils contribute to IL-4 and IL-13 production in the injured heart after MI.
(A) mRNA expression of Il6, Tnfa, Il4, and Il13 in the infarct region 3 days after MI in WT and Baso-KO mice (n = 8–9). mRNA levels are expressed as x-fold relative to the WT MI group. Data show the mean ± SD. P values were determined by 2-way ANOVA followed by Sidak’s multiple-comparison test. (B) Representative flow cytometric plots of cells from the infarct region 3 days after MI in WT 4get and Baso-KO 4get mice. (C) Quantification of GFP+ cells in the infarct region 3 days after MI in control WT 4get and Baso-KO 4get mice (n = 5). Data show the mean ± SD. P value was determined by 2-tailed Student’s t test. (D) Gene expression dot plot based on single-cell RNA-Seq analysis of mouse cardiac leukocytes 3–7 days after MI. Mean expression is depicted by color intensity, whereas the dot size represents the fraction of cells expressing the indicated gene.
Figure 6
Figure 6. Basophil-specific IL-4/IL-13 depletion alters healing after MI.
(A and B) Percentage of cardiac Ly6Chi monocytes and Ly6Clo macrophages (among the percentage of total LinCD11b+ cells) 4 days after MI (n = 8–9). Data show the mean ± SD. P values were determined by 2-tailed Student’s t test. (C) Representative flow cytometric plots of cells from infarct tissue 4 days after MI in BasoWT and Baso4-13KO mice gated on monocytes/macrophages. (D and E) Echocardiographic evaluation of baseline EF and plasma cTnT levels 24 hours after LAD ligation in BasoWT and Baso4-13KO mice. (F) Representative echocardiographic images of mice from the indicated groups on day 1 and day 28 after MI. (GI) Echocardiographic results for BasoWT and Baso4-13KO mice 4 weeks after MI (n = 6–8). Data show the mean ± SD. P values were determined by 2-tailed Student’s t test. (J) Quantification of LV scar thickness based on histological evaluation 4 weeks after MI (n = 6–8). Data show the mean ± SD. P value was determined by 2-tailed Student’s t test. (K) Representative images of histological sections stained with Masson’s trichrome 4 weeks after MI. Scale bars: 500 μm.
Figure 7
Figure 7. IPSE/α-1 enhances cardiac IL-4 and improves heart function after MI.
(A) Timeline of experimental setting for the treatment of infarcted mice with IPSE/α-1 or PBS, respectively. (B) mRNA expression of Il4 in the infarcted region of hearts from PBS- or IPSE/α-1–treated mice 3 days after MI. Data were pooled from 2 independent experiments (n = 6–8) and show the mean ± SD. P value was determined by 1-way ANOVA with Sidak’s multiple-comparison test. (C) cTnT levels 1 day after LAD ligation. (DF) Echocardiographic results for mice treated with either PBS, IPSE/α-1, or IPSE/α-1 plus MAR-1 twenty-eight days after MI (n = 6–12). Data show the mean ± SD. P values were determined by 1-way ANOVA with Tukey’s multiple-comparison test. (G) Representative echocardiographic images of parasternal long-axis (left) and short-axis (right) views in mice from the indicated groups 4 weeks after experimental MI.
Figure 8
Figure 8. Low basophil counts predict poor remodeling in patients with STEMI.
(A) Gating strategy for the identification of blood basophils in patients with STEMI. (B) Kinetics of blood basophils identified as CD45+CD19CD3CD117FcεRI+CD203c+ in patients with STEMI (n = 11) and control patients (n = 9). P values were determined by 1-way ANOVA with Sidak’s multiple-comparison test. (C) Quantification of CD63 expression on human basophils based on MFI for control and MI patients. Data show the mean ± SD. P value was determined by 2-tailed Student’s t test. (DG) Linear regression analysis for the association of scar size 12 months after MI and maximum (max) basophil counts during the first week after MI (D), cTnT levels 24 hours after MI (E), peak CRP values (F), and peak leukocyte counts (G) during the first week after MI. Curved blue lines indicate 95% CIs. Each data point (n = 82) represents a biologically independent sample.

Comment in

References

    1. Frangogiannis NG. The inflammatory response in myocardial injury, repair, and remodelling. Nat Rev Cardiol. 2014;11(5):255–265. doi: 10.1038/nrcardio.2014.28. - DOI - PMC - PubMed
    1. Horckmans M, et al. Neutrophils orchestrate post-myocardial infarction healing by polarizing macrophages towards a reparative phenotype. Eur Heart J. 2017;38(3):187–197. - PubMed
    1. Bajpai G, et al. Tissue resident CCR2– and CCR2+ cardiac macrophages differentially orchestrate monocyte recruitment and fate specification following myocardial injury. Circ Res. 2019;124(2):263–278. doi: 10.1161/CIRCRESAHA.118.314028. - DOI - PMC - PubMed
    1. Hilgendorf I, et al. Ly-6Chigh monocytes depend on Nr4a1 to balance both inflammatory and reparative phases in the infarcted myocardium. Circ Res. 2014;114(10):1611–1622. doi: 10.1161/CIRCRESAHA.114.303204. - DOI - PMC - PubMed
    1. Libby P, et al. Leukocytes link local and systemic inflammation in ischemic cardiovascular disease: an expanded “cardiovascular continuum.”. J Am Coll Cardiol. 2016;67(9):1091–1103. doi: 10.1016/j.jacc.2015.12.048. - DOI - PMC - PubMed

Publication types

MeSH terms