. 2021 Oct;93(10):6059-6062.
doi: 10.1002/jmv.27171. Epub 2021 Jul 6.

Lack of correlation between the SARS-CoV-2 cycle threshold (Ct ) value and clinical outcomes in patients with COVID-19

Affiliations

Lack of correlation between the SARS-CoV-2 cycle threshold (Ct ) value and clinical outcomes in patients with COVID-19

Jose F Camargo et al. J Med Virol. 2021 Oct.

Abstract

Problem: The utility of the polymerase chain reaction (PCR) cycle threshold (Ct ) values in the management of patients with coronavirus disease 2019 (COVID-19) remains controversial.

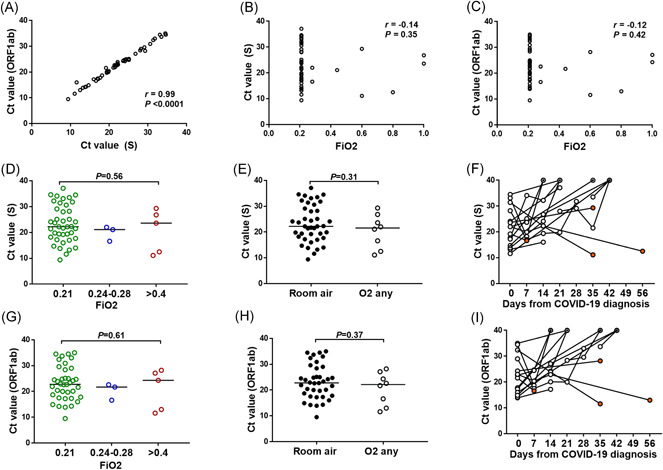
Methods: We assessed the correlation of severe acute respiratory syndrome coronavirus 2 (SARS-CoV-2) Ct values in nasopharyngeal swab samples with the oxygen requirements at the time of sample collection. Specimens were tested with the Simplexa PCR platform, which targets the SARS-CoV-2 ORF1ab and S genes.

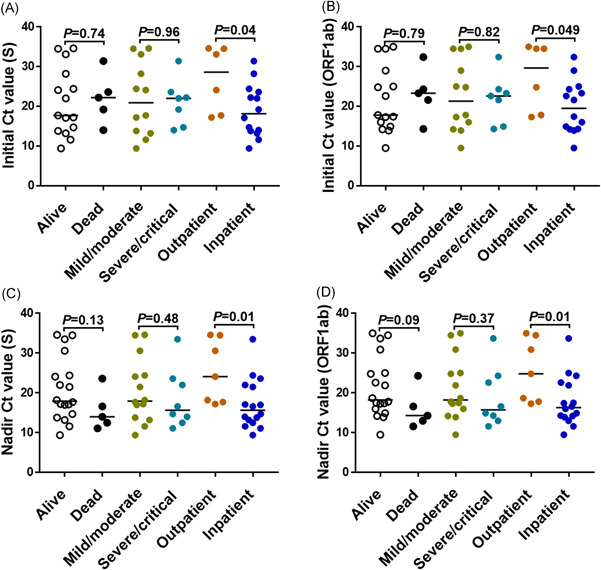
Results: We identified 23 COVID-19 patients with 49 Ct values available. While Ct values from ORF1ab and S genes were highly correlated for a given specimen, there was no correlation between Ct values for any of these target genes and the oxygen requirements of the patient at the time of sample collection. We found no differences in the initial nor the nadir Ct values between survivors and non-survivors or mild/moderate versus severe/critical illness at the maximum point of illness.

Conclusion: SARS-CoV-2 Ct values have limited value in the management of COVID-19.

Keywords: COVID-19; SARS-CoV-2/Ct value; hematopoietic cell transplantation; oxygen.


Conflict of interest statement

The authors declare that there are no conflict of interests.

Figures

Figure 1
Figure 1
Lack of correlation between SARS‐CoV‐2 PCR cycle threshold (C t) values and oxygen requirements at the time of PCR testing. (A–C) Spearman correlation between S and ORF1ab gene targets on the same clinical specimen (A), and between each SARS‐CoV‐2 gene target and the recorded fraction of inspired oxygen (FiO2) (B–C) at the time of sample collection for PCR testing. (D–I) Distribution of SARS‐CoV‐2 C t values across requirements of FiO2 strata at the time of PCR testing for S (D–E) and ORF1ab (G–H) genes. Bars corresponds to the median C t value. p value was calculated using Mann–Whitney or Kruskal–Wallis tests where appropriate for comparison between groups. Trajectory of C t values over time for patients with 2 or more PCR swabs available (F, I). All negative values were given a value of 40 indicated with circled dot. Three patients with negative PCR documented on routine testing obtained more than 6 weeks from previous positive test were considered outliers and not included in the figure. Orange circles correspond to the last C t value available if patient is deceased. PCR, polymerase chain reaction; SARS‐CoV‐2, severe acute respiratory syndrome coronavirus 2
Figure 2
Figure 2
Lower SARS‐CoV‐2 PCR C t value among COVID‐19 patients requiring hospital admission. Initial (A–B) and nadir (C–D) SARS‐CoV‐2 C t values by clinical outcome are shown for the gene targets specified in the y‐ axis. COVID‐19 severity was defined as follows: mild (the clinical symptoms are mild and no pneumonia manifestations can be found in imaging); moderate (pneumonia manifestations on imaging); severe (tachypnea with respiratory rate >30 per minute, hypoxia requiring FiO2 > 0.4 to attain SpO2 > 94%, a ratio of arterial partial pressure of oxygen to fraction of inspired oxygen [PaO2/FiO2]<300 mmHg, and/or lung infiltrates >50%); and critical (respiratory failure requiring mechanical ventilation, septic shock and/or multiorgan failure). Data for maximum COVID‐19 severity missing in one patient admitted at an outside hospital. p value was calculated using Mann–Whitney for comparison between groups. COVID‐19, coronavirus disease 2019; C t, cycle threshold; PCR, polymerase chain reaction; SARS‐CoV‐2, severe acute respiratory syndrome coronavirus 2.

Similar articles

Cited by

References

    1. Gniazdowski V, Morris CP, Wohl S, et al. Repeat COVID‐19 molecular testing: correlation of SARS‐CoV‐2 culture with molecular assays and cycle thresholds. Clin Infect Dis. 2020. 10.1093/cid/ciaa1616 - DOI - PMC - PubMed
    1. Young BE, Ong SWX, Ng LFP, et al. Viral dynamics and immune correlates of COVID‐19 disease severity. Clin Infect Dis. 2020. 10.1093/cid/ciaa1280 - DOI - PMC - PubMed
    1. Bullard J, Dust K, Funk D, et al. Predicting infectious severe acute respiratory syndrome coronavirus 2 from diagnostic samples. Clin Infect Dis. 2020;71(10):2663‐2666. - PMC - PubMed
    1. La Scola B, Le Bideau M, Andreani J, et al. Viral RNA load as determined by cell culture as a management tool for discharge of SARS‐CoV‐2 patients from infectious disease wards. Eur J Clin Microbiol Infect Dis. 2020;39(6):1059‐1061. - PMC - PubMed
    1. Infectious Diseases Society of America . IDSA and AMP joint statement on the use of SARS‐CoV‐2 PCR cycle threshold (Ct) values for clinical decision‐making. 2021; https://www.idsociety.org/globalassets/idsa/public-health/covid-19/idsa-...

MeSH terms