

The combined use of SEM-EDX, Raman, ATR-FTIR and visible reflectance techniques for the characterisation of Roman wall painting pigments from Monte d'Oro area (Rome): an insight into red, yellow and pink shades
- PMID: 34196870
- PMCID: PMC9001301
- DOI: 10.1007/s11356-021-15085-w
The combined use of SEM-EDX, Raman, ATR-FTIR and visible reflectance techniques for the characterisation of Roman wall painting pigments from Monte d'Oro area (Rome): an insight into red, yellow and pink shades
Abstract
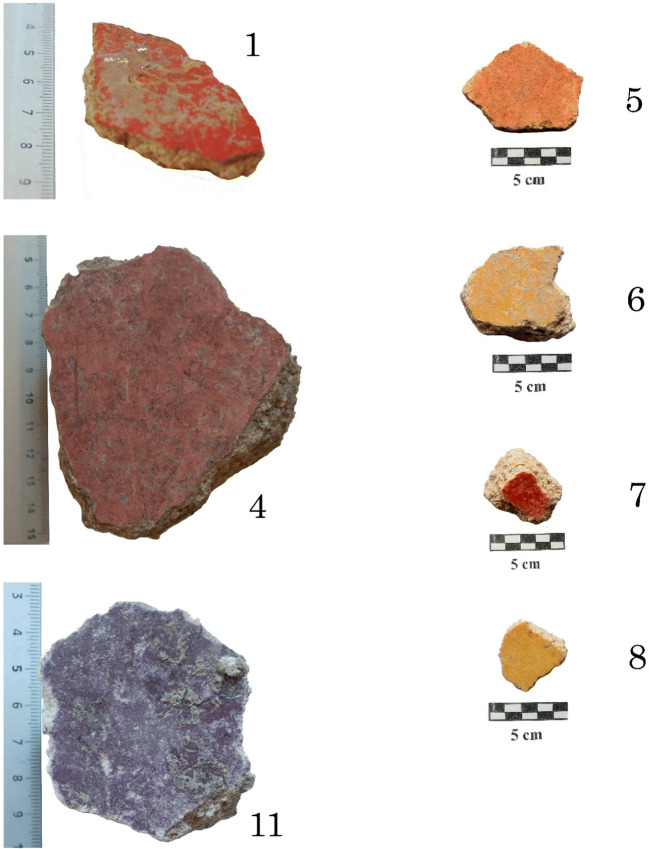
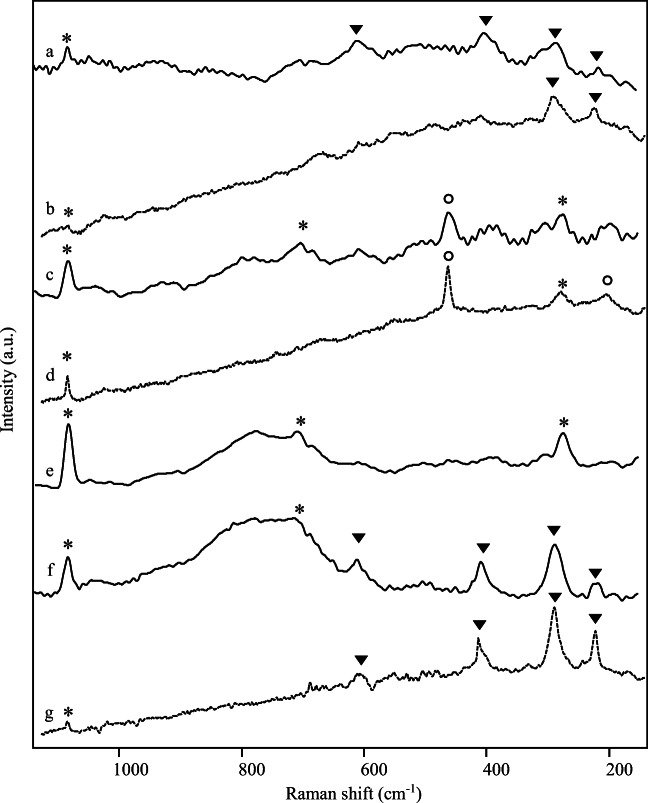
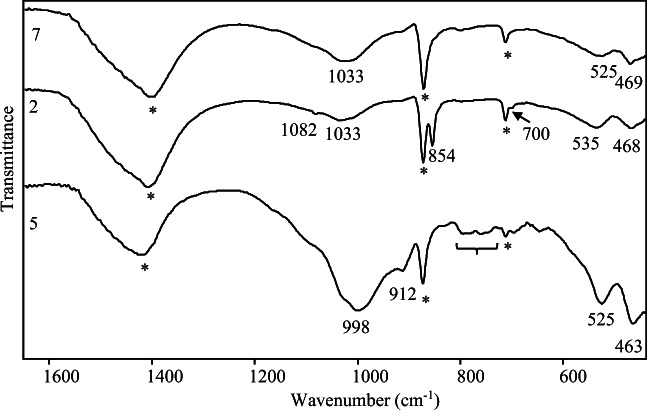
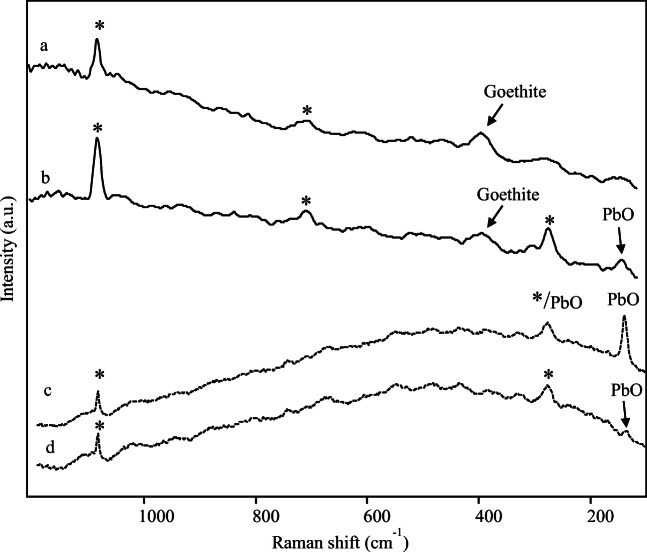
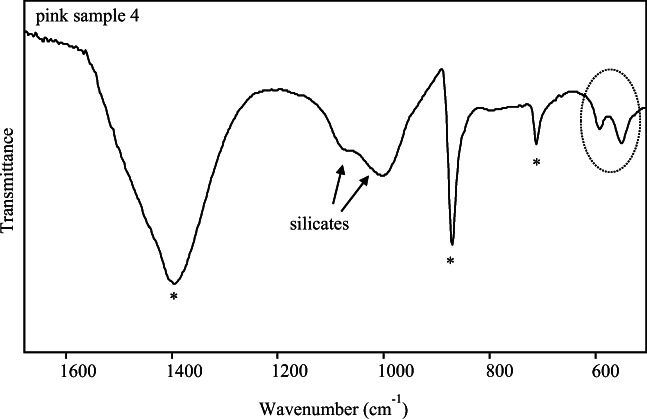
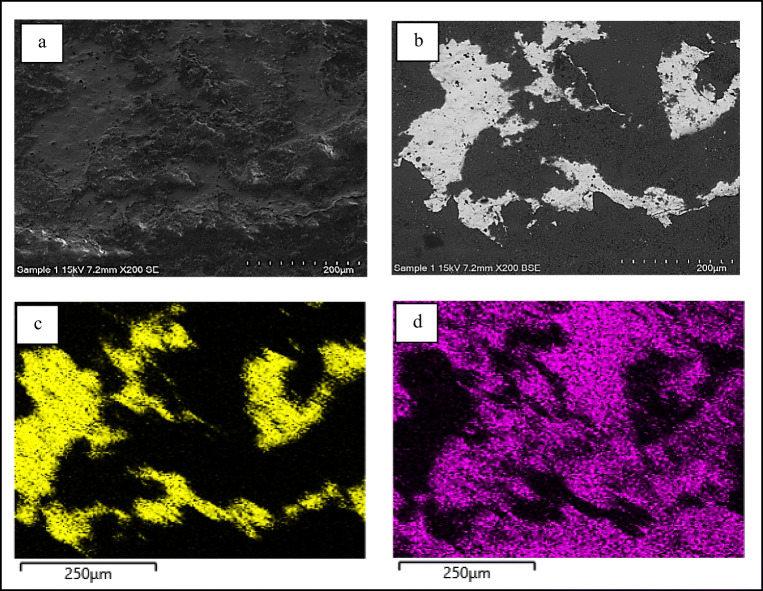
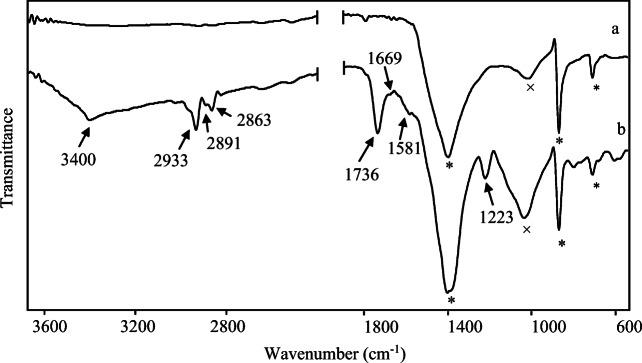
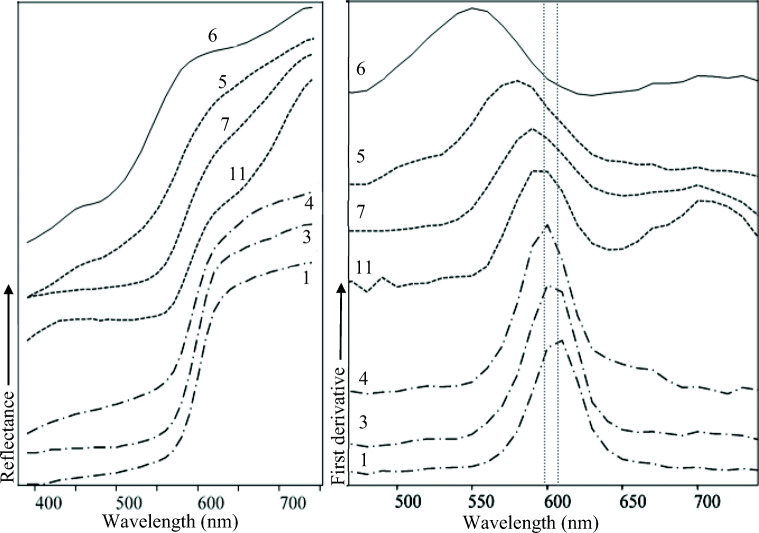
The aim of this work has been the identification of the painter's materials employed in the wall decoration of some destroyed buildings dating approximately between the first century B.C. and the first century A.D. This research originates from a previously started joined archaeological and analytical investigation concerning a varied group of findings that resulted from a rescue excavation performed by Soprintendenza Archeologica in the area of Monte d'Oro in Rome. The focus of this study progression has been directed to a numerous selection of monochrome red, pink and yellow-pigmented fragments. The analyses were performed by means of scanning electron microscopy energy dispersive X-ray spectroscopy (SEM-EDX) combined with Raman and Fourier transform infrared (FTIR) spectroscopies; visible reflectance measurements have also been carried out and the relevance of this technique in such a kind of archaeological studies has been highlighted. Most attention has been given to the assessment of the performances of non-destructive techniques achieved by portable Raman, and visible reflectance instrumentation to test their diagnostic capabilities. In addition to the expected and well-known pigments such as cinnabar, red ochre, hematite for the reds and yellow ochre for the yellows, the study highlighted a diffuse use of mixed colours and in some cases the possible presence of overlapped painted layers and confirmed the presence of gildings. Among the mixtures of pigments, the most singular outcome concerns the pink fragments revealing the possible application of bone white, which seems to be rather uncommon as a pigment in Roman wall decorations.
Keywords: ATR-FTIR; Ash; Bone white; Gold; Raman; Roman wall paintings; SEM-EDX; Visible reflectance.
© 2021. The Author(s).
Conflict of interest statement
The authors declare no competing interests.
Figures
References
-
- Aceto M, Agostino A, Fenoglio G, Idone A, Gulmini M, Picollo M, Ricciardi P, Delaneyf JK. Characterisation of colourants on illuminated manuscripts by portable fibre optic UV-visible-NIR reflectance spectrophotometry. Anal Methods. 2014;6:1488–1500. doi: 10.1039/C3AY41904E. - DOI
-
- Aliatis I, Bersani D, Campani E, Casoli A, Lottici PP, Mantovan S, Marino IG. Pigments used in Roman wall Paintings in the Vesuvian area. J Raman Spectrosc. 2010;41:1537–1542. doi: 10.1002/jrs.2701. - DOI
-
- Amadori ML, Barcelli S, Poldi G, Ferrucci F, Andreotti A, Baraldi P, Colombini MP. Invasive and non-invasive analyses for knowledge and conservation of Roman wall paintings of the Villa of the Papyri in Herculaneum. Microchem J. 2015;118:183–192. doi: 10.1016/j.microc.2014.08.016. - DOI
-
- Andersen FA, Brecevic L. Infrared spectra of amorphous and crystalline calcium carbonate. Acta Chem Scand. 1991;45:1018–1024. doi: 10.1002/chin.199209005. - DOI
-
- Aze S, Vallet J-M, Pomey M, Baronnet A, Grauby O. Red lead darkening in wall paintings: natural ageing of experimental wall paintings versus artificial ageing tests. Eur J Mineral. 2007;19:883–890. doi: 10.1127/0935-1221/2007/0019-1771. - DOI
MeSH terms
LinkOut - more resources
Full Text Sources
Research Materials
Miscellaneous
