. 2021 Aug 9;6(15):e141395.
doi: 10.1172/jci.insight.141395.

Monoallelic IRF5 deficiency in B cells prevents murine lupus

Affiliations

Monoallelic IRF5 deficiency in B cells prevents murine lupus

Alex Pellerin et al. JCI Insight. .

Abstract

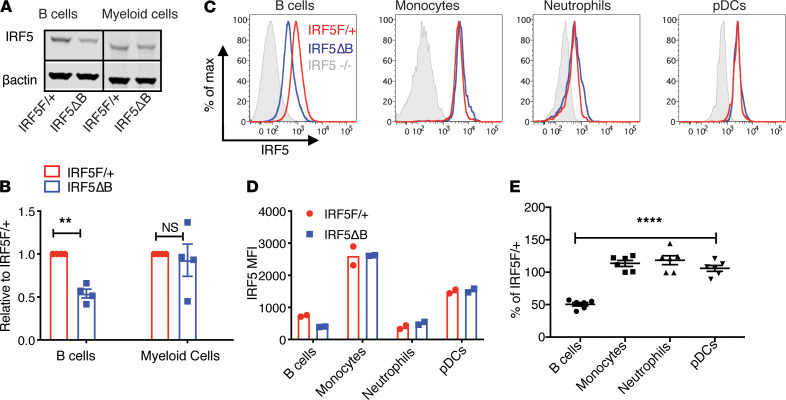
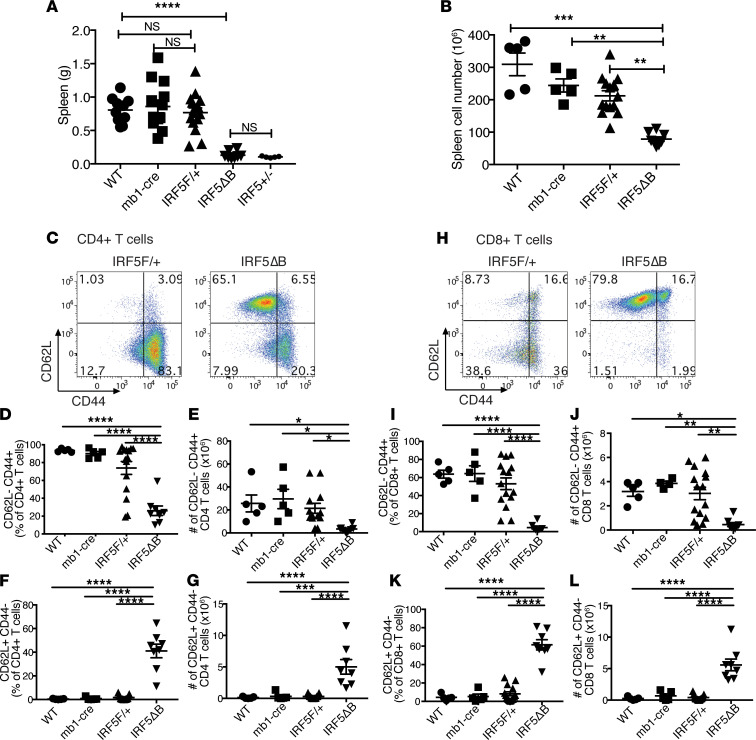
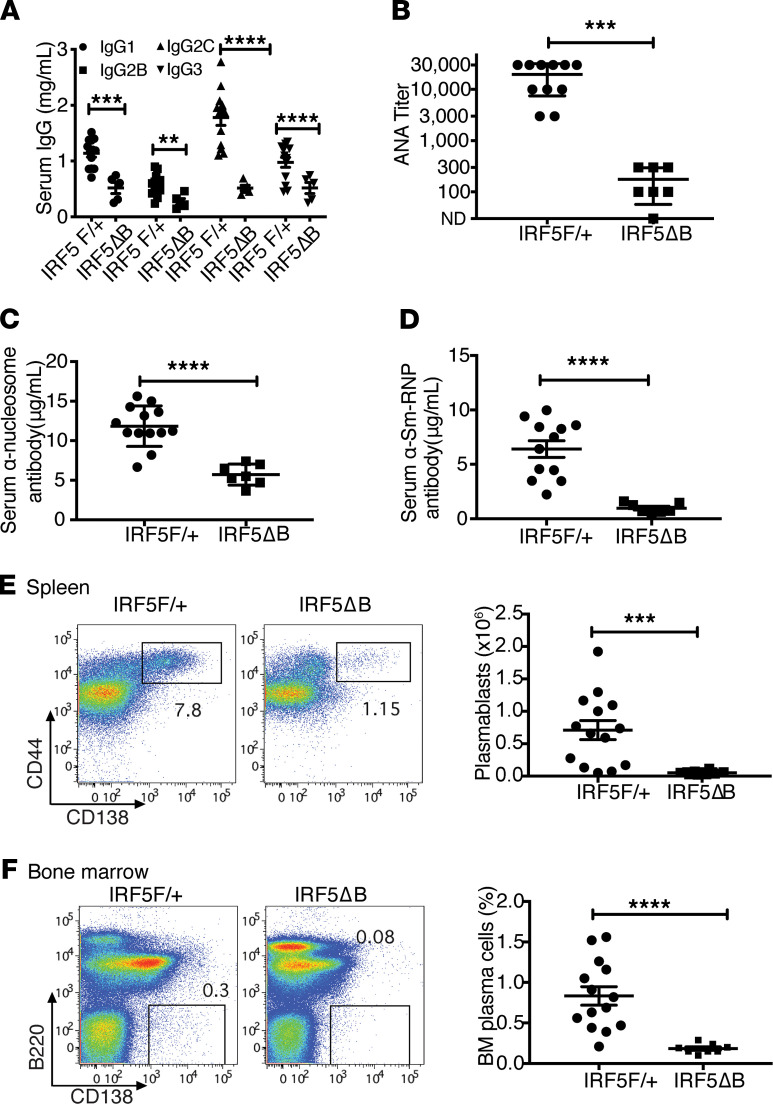
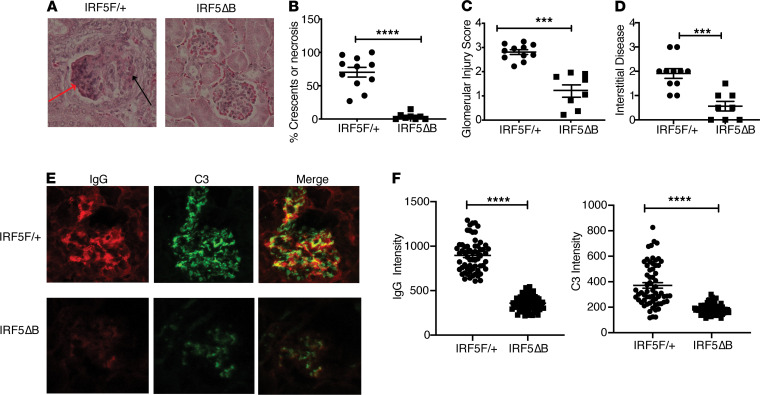
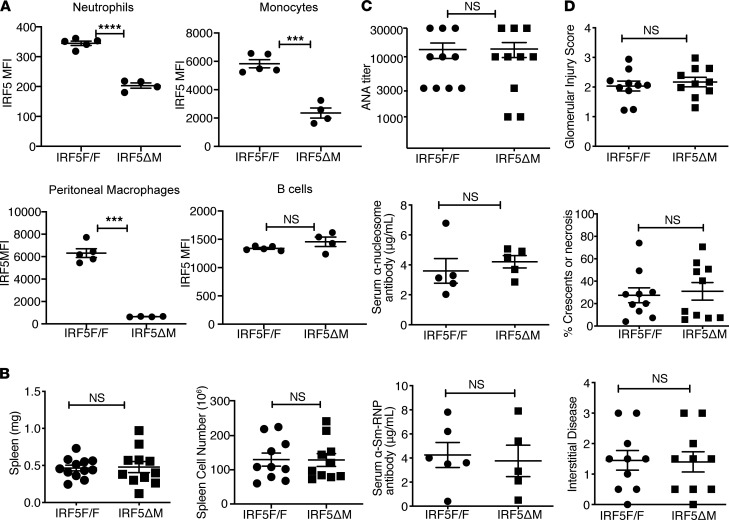
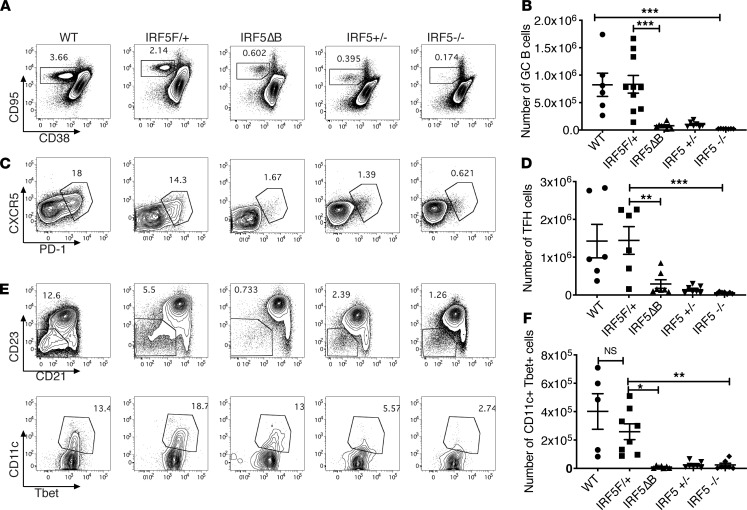
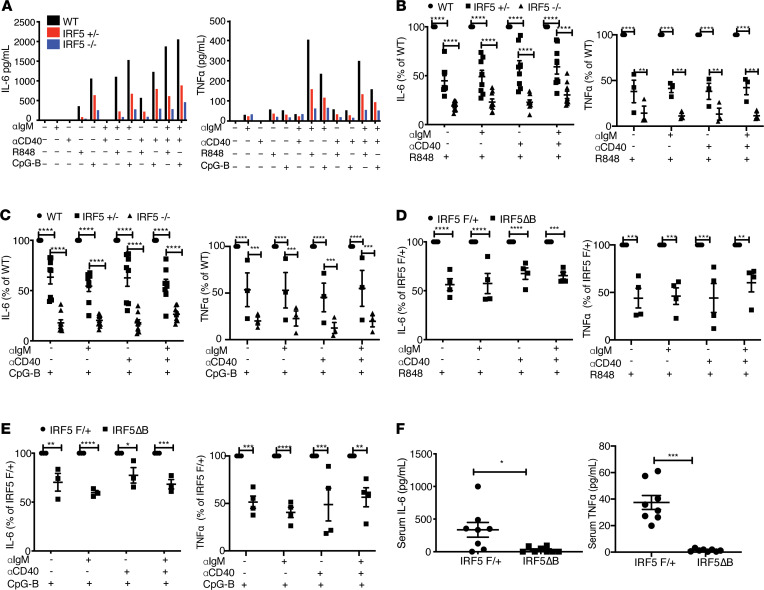
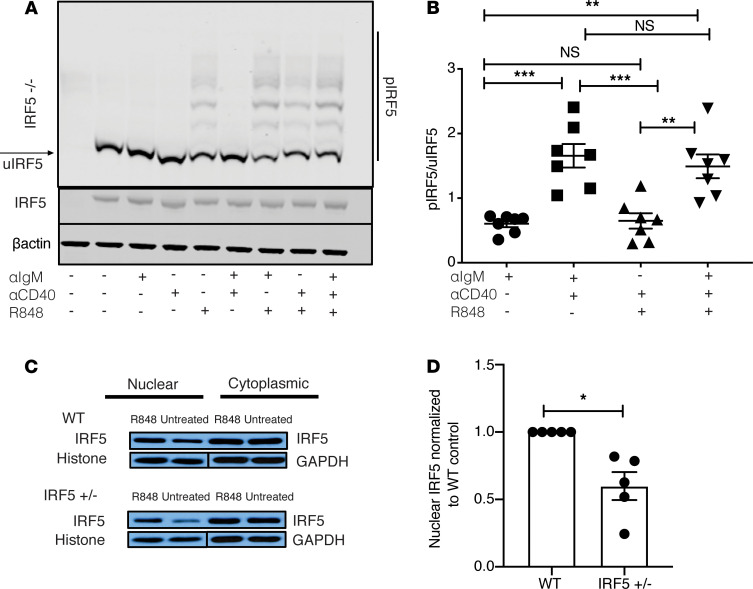
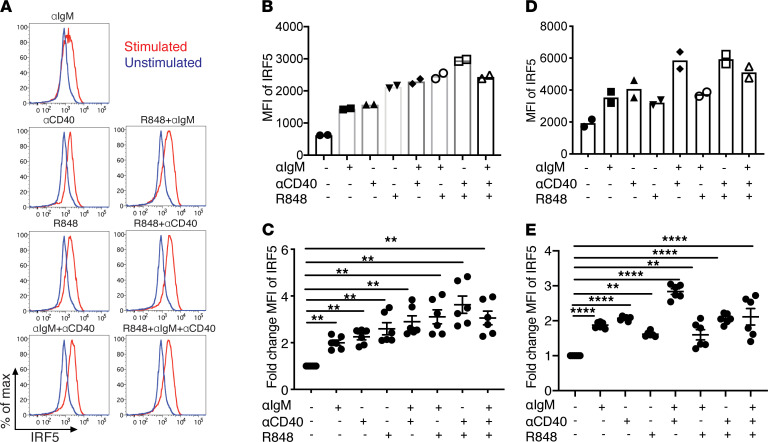
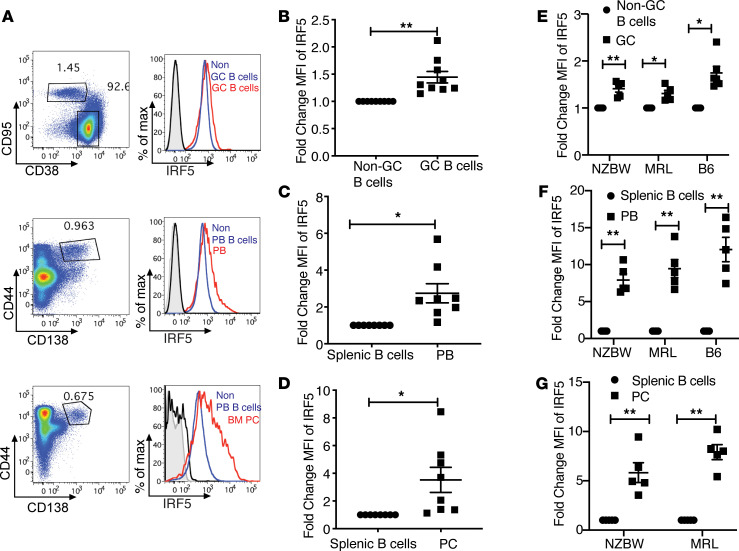
Gain-of-function polymorphisms in the transcription factor IFN regulatory factor 5 (IRF5) are associated with an increased risk of developing systemic lupus erythematosus. However, the IRF5-expressing cell type(s) responsible for lupus pathogenesis in vivo is not known. We now show that monoallelic IRF5 deficiency in B cells markedly reduced disease in a murine lupus model. In contrast, similar reduction of IRF5 expression in macrophages, monocytes, and neutrophils did not reduce disease severity. B cell receptor and TLR7 signaling synergized to promote IRF5 phosphorylation and increase IRF5 protein expression, with these processes being independently regulated. This synergy increased B cell-intrinsic IL-6 and TNF-α production, both key requirements for germinal center (GC) responses, with IL-6 and TNF-α production in vitro and in vivo being substantially lower with loss of 1 allele of IRF5. Mechanistically, TLR7-dependent IRF5 nuclear translocation was reduced in B cells from IRF5-heterozygous mice. In addition, we show in multiple lupus models that IRF5 expression was dynamically regulated in vivo with increased expression in GC B cells compared with non-GC B cells and with further sequential increases during progression to plasmablasts and long-lived plasma cells. Overall, a critical threshold level of IRF5 in B cells was required to promote disease in murine lupus.

Keywords: Autoimmune diseases; Autoimmunity.


Conflict of interest statement

Conflict of interest: The authors have declared that no conflict of interest exists.

Figures

Figure 1
Figure 1. B cell–specific reduction of IRF5 expression in IRF5ΔB mice.
All analyses were done in 8- to 10-week-old FcγRIIB−/−Yaa mice. (A) Representative Western blot of IRF5 protein expression in sorted splenic B cells (CD19+) and myeloid cells (CD11b+Ly6G) from IRF5F/+ and IRF5ΔB mice. All lanes were run on the same gel but were noncontiguous. (B) Expression of IRF5 in B cells and myeloid cells from IRF5ΔB mice normalized to IRF5F/+ (n = 4). Data were analyzed using 2-tailed, unpaired Welch’s t test; **P < 0.01. (C) Representative flow cytometry plots of intracellular IRF5 expression in CD19+ B cells, CD11b+Ly6C+ monocytes, CD11b+Ly6G+ neutrophils, and CD11bPDCA1+Ly6C+ pDCs from IRF5F/+, IRF5ΔB, and IRF5–/– global knockout mice. (D) MFI values of IRF5 in B cells, monocytes, neutrophils, and pDCs from IRF5F/+ and IRF5ΔB mice (representative experiment of 3 individual experiments, n = 2 for each genotype). (E) IRF5 expression in B cells, monocytes, neutrophils, and pDCs from IRF5ΔB mice normalized to the IRF5F/+ littermate control in each experiment (n = 6). Data are shown as mean ± SEM and were analyzed using 1-way ANOVA with Tukey’s post hoc test; ****P < 0.0001. IRF5, IFN regulatory factor 5; pDCs, plasmacytoid DCs.
Figure 2
Figure 2. Splenomegaly and T cell activation are reduced in IRF5ΔB mice.
All analyses were done in 5-month-old FcγRIIB−/−Yaa mice. (A) Spleen weights from WT (n = 10), mb1cre (n = 13), IRF5F/+ (n = 16), IRF5ΔB (n = 8), and IRF5+/– (global heterozygous deletion, n = 5) mice. (B) Splenic cell counts from WT (n = 5), mb1cre (n = 5), IRF5F/+ (n = 14), and IRF5ΔB (n = 8) mice. (C) Representative flow cytometry plots of CD4+CD62LCD44+ (effector/memory) and CD62L+CD44 (naive) T cells from spleen of IRF5F/+ and IRF5ΔB mice. (D and E) Percentage and number of CD62LCD44+ CD4+ T cells from WT (n = 5), mb1cre (n = 5), IRF5F/+ (n = 15), and IRF5ΔB (n = 8) mice. (F and G) Percentage and number of CD62L+CD44CD4+ T cells. (H) Representative flow cytometry plots of CD8+CD62LCD44+ (effector/memory) and CD62L+CD44 (naive) T cells from spleen of IRF5F/+ and IRF5ΔB mice. (I and J) Percentage and number of CD62LCD44+CD8+ T cells from WT (n = 5), mb1cre (n = 5), IRF5F/+ (n = 15), and IRF5ΔB (n = 8) mice. (K and L) Percentage and number of CD62L+CD44CD8+ T cells. Data are shown as mean ± SEM and were analyzed using 1-way ANOVA with Tukey’s post hoc test; *P < 0.05, **P < 0.01, ***P < 0.001, ****P < 0.0001. IRF5, IFN regulatory factor 5.
Figure 3
Figure 3. Serum IgG, autoantibodies, and plasma cells are reduced in IRF5ΔB mice.
All analyses were done in 5-month-old FcγRIIB−/−Yaa mice. (AD) IRF5F/+ (n = 11) and IRF5ΔB mice (n = 5–7) were analyzed. (A) Serum IgG isotype concentrations. (B) Serum antinuclear autoantibody titers. (C) Serum anti-nucleosome IgG concentration. (D) Serum anti-Sm/RNP IgG concentrations. (E) Representative flow cytometry plots and total numbers of splenic plasmablasts in IRF5F/+ (n = 15) and IRF5ΔB (n = 8) mice. (F) Representative flow cytometry plots and percentages of bone marrow plasma cells in IRF5F/+ (n = 15) and IRF5ΔB (n = 8) mice. Data are shown as mean ± SEM and were analyzed using 2-tailed, unpaired Welch’s t test; **P < 0.01, ***P < 0.001, ****P < 0.0001. IRF5, IFN regulatory factor 5.
Figure 4
Figure 4. Decreased renal disease in IRF5ΔB mice.
All analyses were done in 5-month-old FcγRIIB−/−Yaa mice. (A) Representative renal histology of IRF5F/+ and IRF5ΔB mice. Red arrow depicts necrotic cells; black arrow depicts cellular crescent (original magnification, ×20). (BD) Quantification of renal disease by (B) percentage of glomeruli with crescents or necrosis, (C) glomerular injury score, and (D) interstitial disease. IRF5F/+ (n = 11) and IRF5B (n = 8). (E) Representative examples and (F) quantitation of glomerular IgG and complement C3 deposition measured by fluorescence intensity in 11–14 glomeruli per mouse from 5 mice per group. All scored glomeruli are shown (original magnification, ×20). Data are shown as mean ± SEM and were analyzed using 2-tailed, unpaired Welch’s t test; ***P < 0.001, ****P < 0.0001. IRF5, IFN regulatory factor 5.
Figure 5
Figure 5. LysMcre-mediated deletion of IRF5 does not reduce disease in FcγRIIB−/−Yaa mice.
All analyses were done in FcγRIIB−/−Yaa littermates that either did not express LysMcre (IRF5fl/fl) or did express LysMcre (IRF5ΔM). (A) Flow cytometry quantitation of intracellular IRF5 expression (MFI values) in neutrophils (CD11b+Ly6G+), monocytes (CD11b+Ly6C+), and B cells (CD19+) from spleen, and in peritoneal macrophages (F/480+CD11b+), in 8- to 10-week-old FcγRIIB−/−Yaa littermates (n = 4 or n = 5). Data are shown as mean ± SEM and were analyzed using 2-tailed, unpaired Welch’s t test; ***P < 0.001, ****P < 0.0001. (BD) All analyses were done in 5-month-old FcγRIIB−/−Yaa littermates. (B) Spleen weight and cell counts from IRF5fl/fl (n = 10–12) and IRF5ΔM mice (n = 10–12). (C) Serum antinuclear autoantibody titers, serum anti-nucleosome IgG concentration, and serum anti-Sm/RNP IgG concentration (n = 5–10). (D) Quantification of renal disease by glomerular injury score, percentage of glomeruli with crescents or necrosis, and interstitial disease (n = 10). Data are shown as mean ± SEM and were analyzed using 2-tailed, unpaired Welch’s t test. IRF5, IFN regulatory factor 5.
Figure 6
Figure 6. GC B cells, Tfhs, and T-bet+ B cells are reduced in the spleens of IRF5ΔB mice.
Spleen cells from 8- to 10-week-old FcγRIIB−/−Yaa WT (n = 6), IRF5F/+ (n = 10), IRF5ΔB (n = 8), IRF5+/– (global heterozygous deletion, n = 7), and IRF5–/– (global homozygous deletion, n = 7) mice were analyzed. (A and B) Representative flow cytometry plots and total numbers of CD95+CD38 GC B cells (gated on CD19+B220+ cells). (C and D) Representative flow cytometry plots and total numbers of CXCR5+PD-1+ Tfhs (gated on CD3+CD4+). (E) Upper panel indicates CD23CD21 B cells (gated on B220+CD19+CD43CD93 cells); lower panel indicates T-bet+CD11c+ ABCs gated on the CD23CD21 B cells shown in the upper panel. A representative example is shown. (F) Total number of T-bet+CD11c+ ABCs. Data are shown as mean ± SEM and were analyzed using 1-way ANOVA with Tukey’s post hoc test; *P < 0.05, **P < 0.01, ***P < 0.001. GC, germinal center; Tfhs, T follicular helper cells; IRF5, IFN regulatory factor 5; ABCs, age-associated B cells.
Figure 7
Figure 7. Reduced IRF5 expression in B cells decreases IL-6 and TNF-α production in vitro, and serum IL-6 and TNF-α is reduced in IRF5ΔB mice.
(AC) B cells were isolated from the spleens of FcγRIIB−/−Yaa mice at 8–10 weeks of age and stimulated for 24 hours with anti-IgM, anti-CD40, R848, and CpG-B alone or in combination. (A) Representative experiments showing mean IL-6 and TNF-α production by B cells from WT, IRF5+/–, and IRF5–/– mice (n = 2 for each genotype). (B and C) IL-6 (n = 8) and TNF-α (n = 3) production after R848 stimulation (B) and CpG-B stimulation (C) by B cells from WT, IRF5+/–, and IRF5–/– mice normalized to the WT control in each experiment. (D and E) IL-6 and TNF-α production by B cells from IRF5ΔB mice normalized to the littermate IRF5F/+ control in each experiment (n = 4 for each genotype). Data are shown as mean ± SEM and were analyzed using 2-way ANOVA with Tukey’s post hoc test; **P < 0.01, ***P < 0.001, ****P < 0.0001. (F) Mean serum IL-6 and TNF-α levels from 5-month-old IRF5ΔB (n = 8) and littermate IRF5F/+ (n = 8) mice. Data are shown as mean ± SEM and were analyzed using 2-tailed, unpaired Welch’s t test; *P < 0.05, ***P < 0.001. IRF5, IFN regulatory factor 5.
Figure 8
Figure 8. TLR7 signaling is required for IRF5 phosphorylation, and IRF5 nuclear translocation is reduced in B cells from FcγRIIB−/−Yaa IRF5+/– mice.
(A and B) B cells were isolated from the spleens of FcγRIIB−/−Yaa mice at 8–10 weeks of age. (A) B cells were stimulated with anti-IgM, anti-CD40, and R848 alone or in combination for 2 hours and the protein lysate analyzed using phospho-Tag gel (upper panel) or standard gel (lower panels). B cells isolated from an IRF5-deficient (IRF5–/–) mouse are shown in the first lane. p-IRF5 denotes phosphorylated IRF5. A representative example of 7 individual experiments is shown. (B) Ratio of p-IRF5 to unphosphorylated IRF5 (u-IRF5). Intensity of p-IRF5 was normalized to the intensity of unphosphorylated IRF5 (lowest band of IRF5 on p-Tag gel as shown in A) (n = 7). (C and D) B cells from FcγRIIB−/−Yaa (WT) and FcγRIIB−/−Yaa IRF5+/– mice were stimulated for 2 hours with R848, or not stimulated (untreated), and IRF5 was probed in the nuclear and cytoplasmic fractions. (C) A representative experiment of 4 individual experiments is shown. (D) Ratio of IRF5 expression in nucleus relative to the WT after R848 stimulation; nuclear IRF5 intensity in each sample was first normalized to its own loading control (histone; n = 5). Data are shown as mean ± SEM and were analyzed using 1-way ANOVA with Tukey’s post hoc test; *P < 0.05, **P < 0.01, ***P < 0.001. IRF5, IFN regulatory factor 5.
Figure 9
Figure 9. IRF5 expression is increased in activated B cells in vitro.
(AE) Splenic B cells were isolated from 8- to 10-week-old FcγRIIB−/−Yaa or C57BL/6 mice and were either not stimulated or stimulated with anti-IgM, anti-CD40, and R848 alone or in combination for 24 hours. (A) Intracellular IRF5 levels were measured using flow cytometry. A representative experiment of 6 individual experiments using B cells from FcγRIIB−/−Yaa mice is shown. (B and D) MFI of IRF5 with and without stimulation in B cells from FcγRIIB−/−Yaa mice (B) and C57BL/6 mice (D) (n = 2 per strain). (C and E) Fold change of IRF5 expression normalized to unstimulated control in B cells from FcγRIIB−/−Yaa mice (C) and C57BL/6 mice (E) (n = 6 per strain). Data are shown as mean ± SEM and were analyzed using 1-way ANOVA with Tukey’s post hoc test; **P < 0.01, ****P < 0.0001. IRF5, IFN regulatory factor 5.
Figure 10
Figure 10. IRF5 expression is increased in GC B cells, splenic PBs, and BM PCs in vivo.
(AG) Flow cytometry performed on splenocytes and bone marrow from FcγRIIB−/−Yaa mice at 8–10 weeks of age. (A) Representative examples of IRF5 expression in GC B cells (CD38CD95+CD19+) and non-GC B cells (CD38+CD95; upper panel); PBs (CD44+CD138+) and CD19+CD138 B cells (non-PBs; middle panel); and BM PCs (CD44+ CD138+) and non-PB B cells from spleens (lower panel). (B) Fold change in IRF5 expression in GC B cells normalized to non-GC B cells (n = 9). (C) Fold change in IRF5 expression in PBs normalized to non-PBs (n = 8). (D) Fold change in IRF5 expression in PCs normalized to splenic non-PBs (n = 8). (EG) IRF5 expression in NZB/W mice (n = 6), MRL/lpr mice (n = 6), and C57BL/6 (n = 6) mice immunized with 4-hydroxy-3-nitrophenylacetyl coupled to chicken γ-globulin. (E) Fold change of IRF5 expression in GC B cells. (F) Fold change of IRF5 expression in PBs. (G) Fold change of IRF5 expression in plasma cells. Black histogram shows isotype control in non-GC B cells, non-PBs, or BM PCs; gray-tinted histogram shows isotype control in GC B cells, PBs, or BM PCs; blue histogram shows IRF5 expression in non-GC B cells and non-PBs; red histogram shows IRF5 expression in GC B cells, PBs, or BM PCs. Data are shown as mean ± SEM and were analyzed using 2-tailed, unpaired Welch’s t test; *P < 0.05, **P < 0.01. IRF5, IFN regulatory factor 5; GC, germinal center; PBs, plasmablasts; BM PCs, bone marrow plasma cells.

References

    1. Liu Z, Davidson A. Taming lupus-a new understanding of pathogenesis is leading to clinical advances. Nat Med. 2012;18(6):871–882. doi: 10.1038/nm.2752. - DOI - PMC - PubMed
    1. Tsokos GC. Autoimmunity and organ damage in systemic lupus erythematosus. Nat Immunol. 2020;21(6):605–614. doi: 10.1038/s41590-020-0677-6. - DOI - PMC - PubMed
    1. Eames HL, et al. Interferon regulatory factor 5 in human autoimmunity and murine models of autoimmune disease. Transl Res. 2016;167(1):167–182. doi: 10.1016/j.trsl.2015.06.018. - DOI - PubMed
    1. Barnes BJ. Genetic versus non-genetic drivers of SLE: implications of IRF5 dysregulation in both roads leading to SLE. Curr Rheumatol Rep. 2019;21(1):2. doi: 10.1007/s11926-019-0803-3. - DOI - PMC - PubMed
    1. Richez C, et al. IFN regulatory factor 5 is required for disease development in the FcgammaRIIB-/-Yaa and FcgammaRIIB-/- mouse models of systemic lupus erythematosus. J Immunol. 2010;184(2):796–806. doi: 10.4049/jimmunol.0901748. - DOI - PMC - PubMed

Publication types

MeSH terms