

Disparities in Learning Mode Access Among K-12 Students During the COVID-19 Pandemic, by Race/Ethnicity, Geography, and Grade Level - United States, September 2020-April 2021
- PMID: 34197363
- PMCID: PMC8248594
- DOI: 10.15585/mmwr.mm7026e2
Disparities in Learning Mode Access Among K-12 Students During the COVID-19 Pandemic, by Race/Ethnicity, Geography, and Grade Level - United States, September 2020-April 2021
Abstract
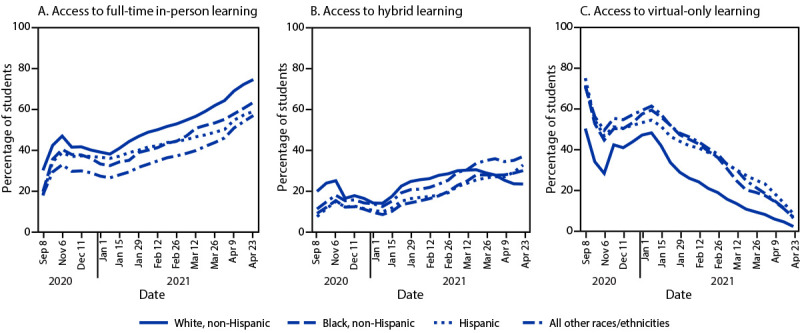
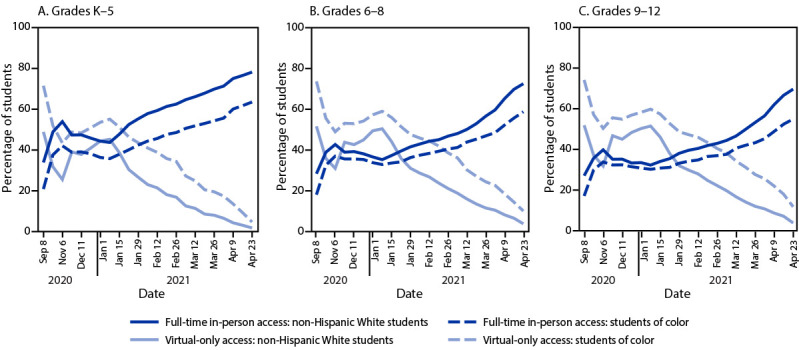
In response to the COVID-19 pandemic, schools across the United States began transitioning to virtual learning during spring 2020. However, schools' learning modes varied during the 2020-21 school year across states as schools transitioned at differing times back to in-person learning, in part reflecting updated CDC guidance. Reduced access to in-person learning is associated with poorer learning outcomes and adverse mental health and behavioral effects in children (1-3). Data on the learning modes available in 1,200 U.S. public school districts (representing 46% of kindergarten through grade 12 [K-12] public school enrollment) from all 50 states and the District of Columbia during September 2020-April 2021 were matched with National Center for Education Statistics (NCES) demographic data. Learning mode access was assessed for K-12 students during the COVID-19 pandemic, over time and by student race/ethnicity, geography, and grade level group. Across all assessed racial/ethnic groups, prevalence of virtual-only learning showed more variability during September-December 2020 but declined steadily from January to April 2021. During January-April 2021, access to full-time in-person learning for non-Hispanic White students increased by 36.6 percentage points (from 38.0% to 74.6%), compared with 31.1 percentage points for non-Hispanic Black students (from 32.3% to 63.4%), 23.0 percentage points for Hispanic students (from 35.9% to 58.9%) and 30.6 percentage points for students of other races/ethnicities (from 26.3% to 56.9%). In January 2021, 39% of students in grades K-5 had access to full-time in-person learning compared with 33% of students in grades 6-8 and 30% of students in grades 9-12. Disparities in full-time in-person learning by race/ethnicity existed across school levels and by geographic region and state. These disparities underscore the importance of prioritizing equitable access to this learning mode for the 2021-22 school year. To increase equitable access to full-time in-person learning for the 2021-22 school year, school leaders should focus on providing safety-optimized in-person learning options across grade levels. CDC's K-12 operational strategy presents a pathway for schools to safely provide in-person learning through implementing recommended prevention strategies, increasing vaccination rates for teachers and older students with a focus on vaccine equity, and reducing community transmission (4).
Conflict of interest statement
All authors have completed and submitted the International Committee of Medical Journal Editors form for disclosure of potential conflicts of interest. No potential conflicts of interest were disclosed.
Figures
References
-
- Woodworth JL, Raymond ME, Chirbas K, et al. Online charter school study 2015. Stanford, CA: Center for Research on Education Outcomes; 2015. Accessed May 26, 2021. https://credo.stanford.edu/publications/online-charter-school-study
-
- Verlenden JV, Pampati S, Rasberry CN, et al. Association of children’s mode of school instruction with child and parent experiences and well-being during the COVID-19 pandemic—COVID experiences survey, United States, October 8–November 13, 2020. MMWR Morb Mortal Wkly Rep 2021;70:369–76. 10.15585/mmwr.mm7011a1 - DOI - PMC - PubMed
-
- Loades ME, Chatburn E, Higson-Sweeney N, et al. Rapid systematic review: the impact of social isolation and loneliness on the mental health of children and adolescents in the context of COVID-19 2020. J Am Acad Child Adolesc Psychiatry 2020;59:1218–1239.e3. 10.1016/j.jaac.2020.05.009 - DOI - PMC - PubMed
-
- CDC. COVID-19: operational strategy for K–12 schools through phased prevention. Atlanta, GA: US Department of Health and Human Services, CDC; 2021. https://www.cdc.gov/coronavirus/2019-ncov/community/schools-childcare/op...
-
- Chen C. 2019–20 common core of data (ccd) universe files. Washington, DC: US Department of Education, National Center for Education Statistics; 2021. Accessed May 4, 2021. https://nces.ed.gov/pubsearch/pubsinfo.asp?pubid=2021150
MeSH terms
Grants and funding
LinkOut - more resources
Full Text Sources
Medical
Research Materials
Miscellaneous
