

Evaluation of sow thermal preference across three stages of reproduction
- PMID: 34197578
- PMCID: PMC8355610
- DOI: 10.1093/jas/skab202
Evaluation of sow thermal preference across three stages of reproduction
Abstract
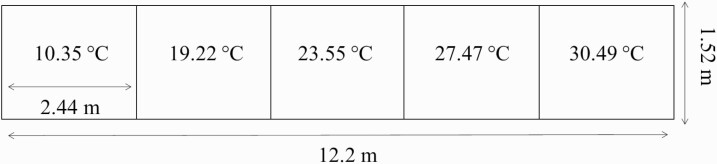
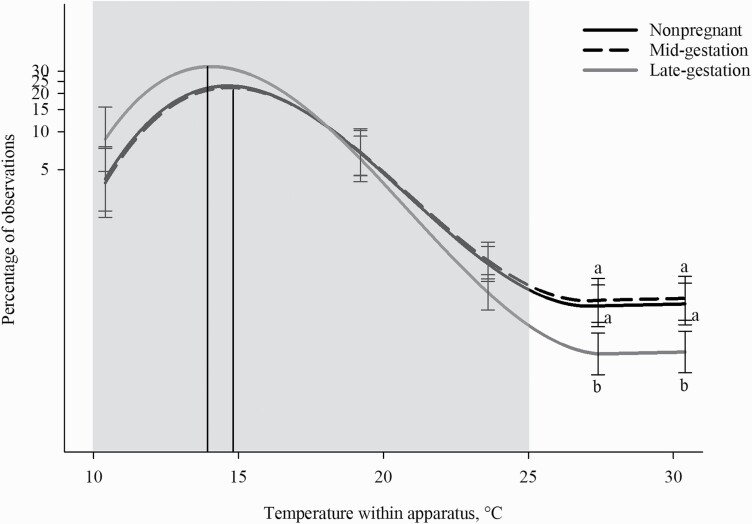
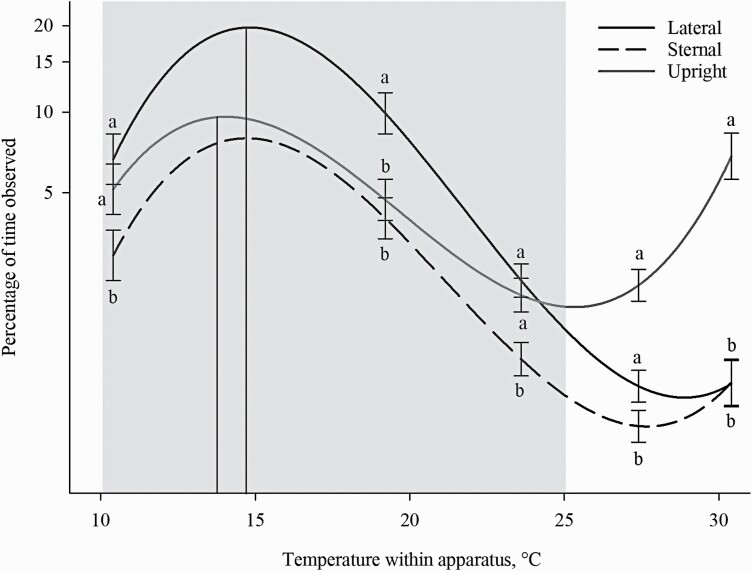
The metabolic heat production of modern pigs has increased by an average of 16%, compared with sows of 30 years ago. Therefore, it is likely that temperature recommendations require updating to meet the needs of modern pigs. The objective of this study was to evaluate whether different reproductive stages of sows altered thermal preference and if current recommendations required updating. Twenty multiparous sows (3.4 ± 1.2 parity) in different reproductive stages (nonpregnant: n = 7; mid-gestation: 58.5 ± 5.68 d, n = 6; and late-gestation: 104.7 ± 2.8 d, n = 7) were tested. Thermal preference was individually tested, and sows could freely choose a temperature, using a thermal gradient between 10.4 and 30.5 °C. Sows were given 24 h to acclimate to the thermal apparatus. Before testing began, sows were given daily feed allotment and returned to the apparatus. Video from the 24-h test period was used to record sow behavior (time spent inactive), posture (upright and sternal and lateral lying), and location using instantaneous scan samples every 15 min. Data were analyzed using PROC MIXED procedure in SAS 9.4. A cubic regression model was used to calculate the sow's most preferred temperature based on the location, or temperature, in which they spent the most time. The preference range was calculated using peak temperature preference ±SE for each sow. The reproductive stage altered where sows spent their time within the thermal gradient (P < 0.01). Late-gestation sows preferred cooler temperatures (14.0 °C) than mid-gestation (14.8 °C; P < 0.01) and nonpregnant sows (14.8 °C; P < 0.01). In summary, sow thermal preferences were within the lower half of the current recommended range (10 to 25 °C). This indicates that temperatures at the higher end of the recommended range could be uncomfortable to sows and that the thermal comfort zone of sows may be narrower than recommendations indicate.
Keywords: reproductive stage; sows; thermal comfort zone; thermal preference; thermal recommendations.
© The Author(s) 2021. Published by Oxford University Press on behalf of the American Society of Animal Science. All rights reserved. For permissions, please e-mail: journals.permissions@oup.com.
Figures
References
-
- Bianca, W. 1968. Thermoregulation. In: Hafez E. S. E., editor. Adaptation of domestic animals. Pullman, Washington/Philadelphia: Washington State University/Lea & Febiger; p. 97–18.
-
- Bond, T. E., C. F. Kelly, and H. Heitman Jr. 1959. Hog house air conditioning and ventilation data Trans. ASAE. 2(1):1–4. doi:10.13031/2013.41147 - DOI
-
- Brown-Brandl, T. M., Hayes M. D., Xin H., Nienaber J. A., and Li H.. . 2014. Heat and moisture production of modern swine. ASHRAE Trans. 120: 469–489. doi:10.13031/trans.57.1071 - DOI
MeSH terms
Grants and funding
LinkOut - more resources
Full Text Sources
