. 2021 Aug 18;109(16):2590-2603.e13.
doi: 10.1016/j.neuron.2021.06.005. Epub 2021 Jun 30.

Anterior thalamic dysfunction underlies cognitive deficits in a subset of neuropsychiatric disease models

Affiliations

Anterior thalamic dysfunction underlies cognitive deficits in a subset of neuropsychiatric disease models

Dheeraj S Roy et al. Neuron. .

Abstract

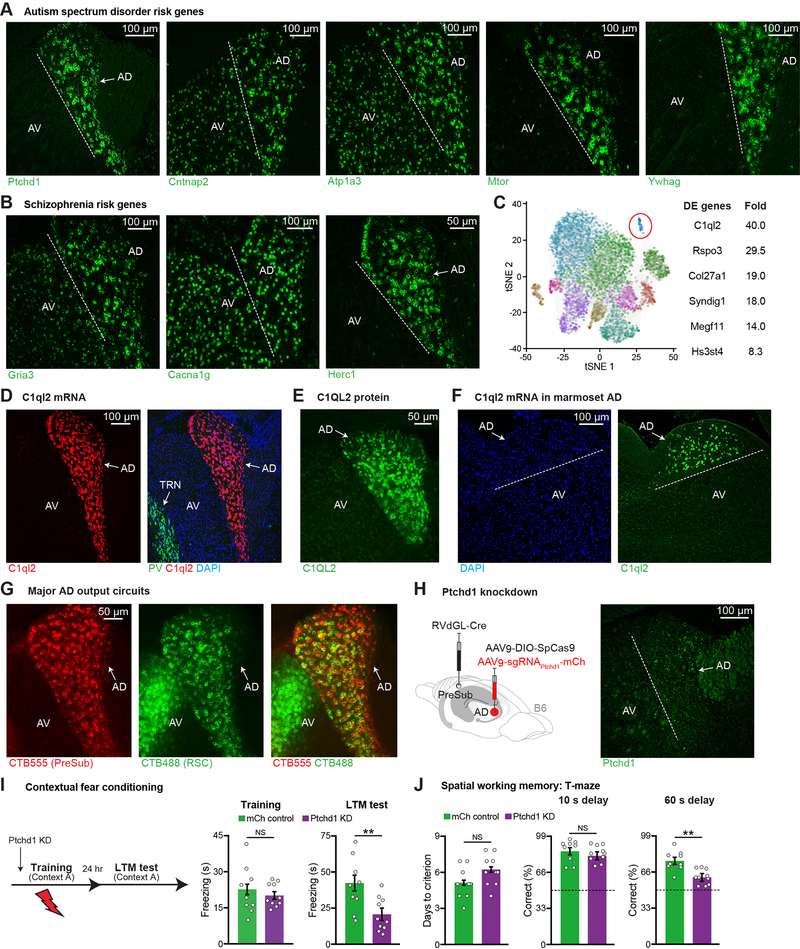
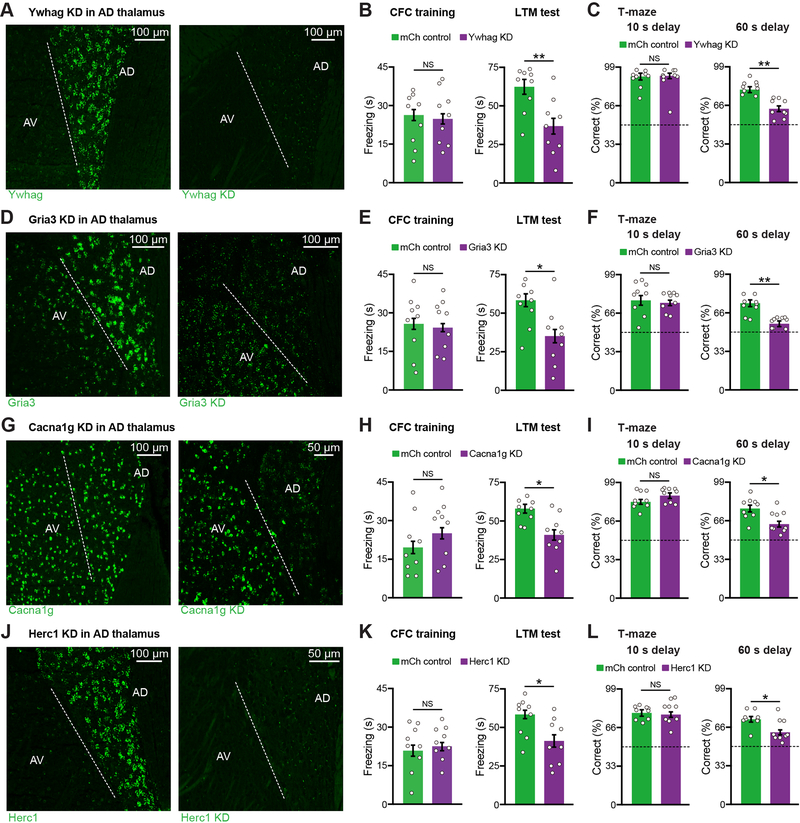
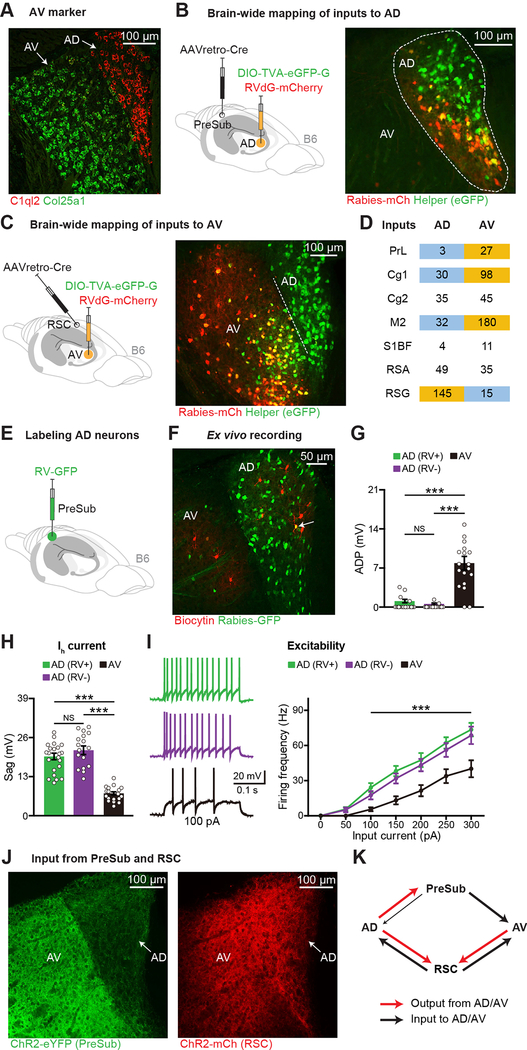
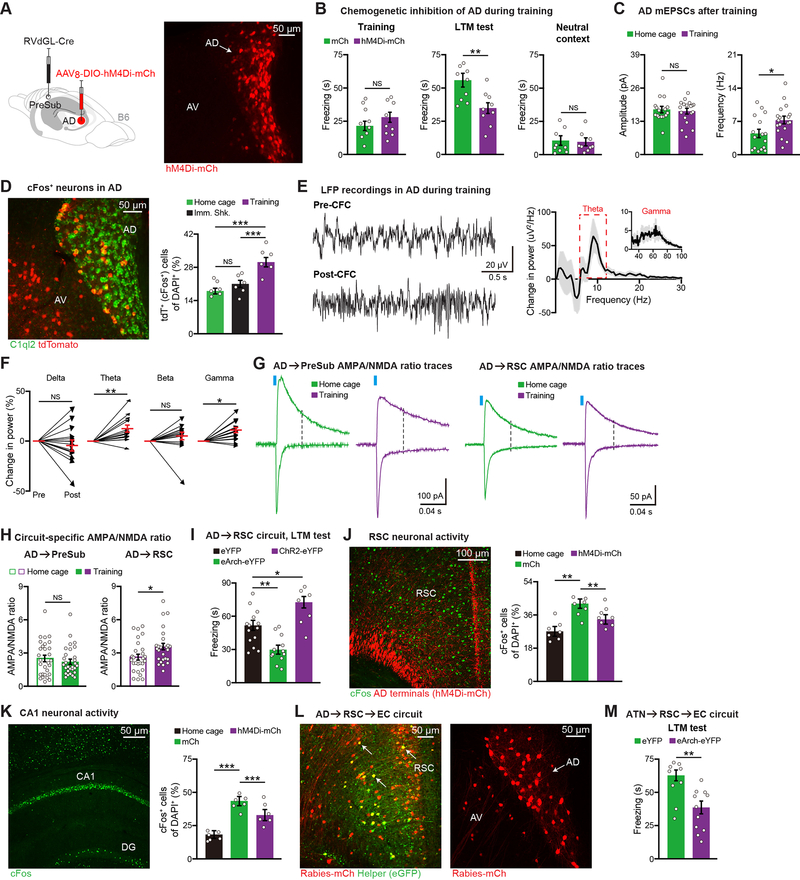
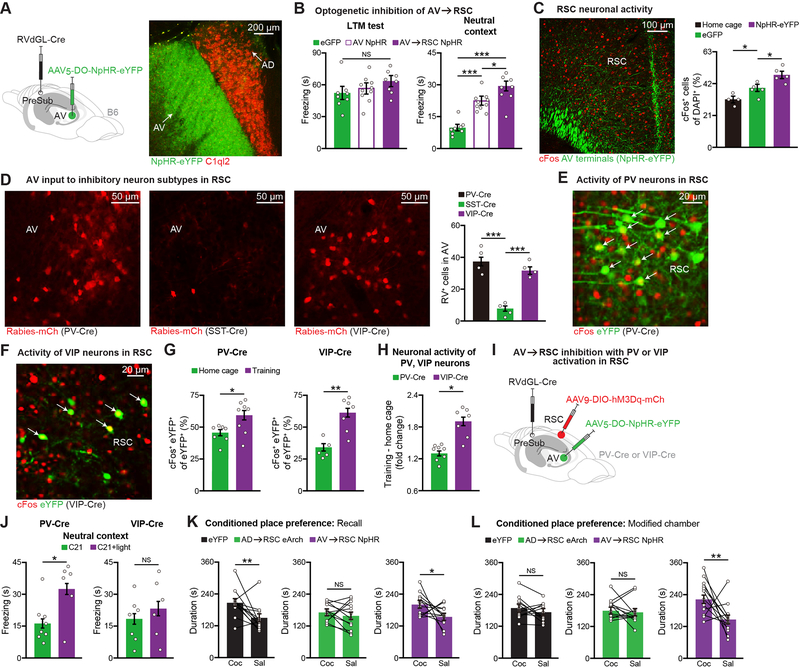
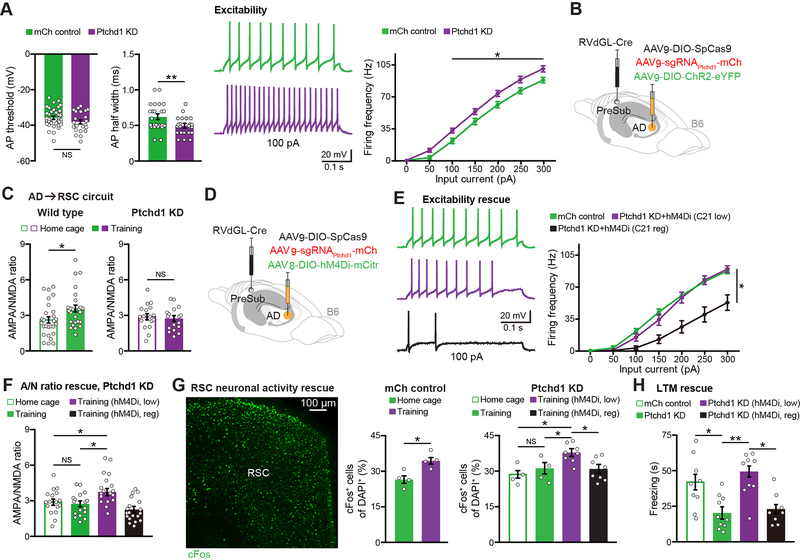
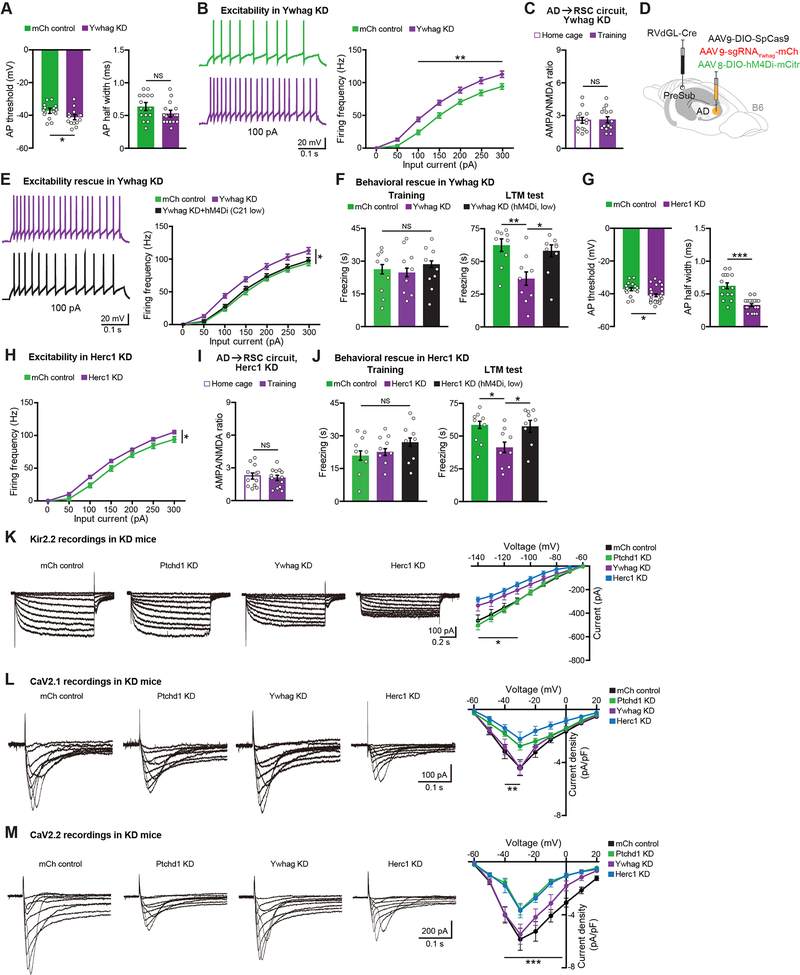
Neuropsychiatric disorders are often accompanied by cognitive impairments/intellectual disability (ID). It is not clear whether there are converging mechanisms underlying these debilitating impairments. We found that many autism and schizophrenia risk genes are expressed in the anterodorsal subdivision (AD) of anterior thalamic nuclei, which has reciprocal connectivity with learning and memory structures. CRISPR-Cas9 knockdown of multiple risk genes selectively in AD thalamus led to memory deficits. While the AD is necessary for contextual memory encoding, the neighboring anteroventral subdivision (AV) regulates memory specificity. These distinct functions of AD and AV are mediated through their projections to retrosplenial cortex, using differential mechanisms. Furthermore, knockdown of autism and schizophrenia risk genes PTCHD1, YWHAG, or HERC1 from AD led to neuronal hyperexcitability, and normalization of hyperexcitability rescued memory deficits in these models. This study identifies converging cellular to circuit mechanisms underlying cognitive deficits in a subset of neuropsychiatric disease models.

Keywords: anterior thalamic nuclei; autism; cognition; memory; neuropsychiatric disorders; retrosplenial; schizophrenia; thalamus.


Conflict of interest statement

Declaration of interests The authors declare no competing interests.

Figures

Figure 1.
Figure 1.. Memory Impairments in AD Thalamus-Specific PTCHD1 Knockdown Mice
(A-B) FISH staining of ASD (A), schizophrenia risk genes (B), in ATN. Anterodorsal (AD), anteroventral (AV). (C) 11 excitatory neuron clusters in mouse thalamus from DropViz (89,027 cells, n = 6 mice) (left), top differentially expressed (DE) genes from the highlighted cluster (right). Rspo3 (R-spondin 3), Col27a1 (collagen type XXVII alpha 1 chain), Syndig1 (synapse differentiation inducing 1), Megf11 (multiple EGF like domains 11), Hs3st4 (heparan sulfate-glucosamine 3-sulfotransferase 4). (D) FISH staining in ATN, parvalbumin (PV) neurons in TRN, DAPI staining (blue). (E) Antibody staining in ATN. (F) FISH staining in marmoset ATN. (G) Retrograde CTB labeling from PreSub or RSC in ATN. Average of 296 CTB555+ and 271 CTB488+ cells were observed in AD. 84% of all PreSub-projecting neurons send collaterals to RSC (n = 3 mice). (H) Circuit-based PTCHD1 knockdown (KD) strategy (left), FISH staining after KD (right). Ptchd1 expression is decreased by 96% (fluorescence intensity) in KD mice as compared to mCh controls in Figure S1H (n = 3 mice per group). (I) CFC behavior. mCh control mice received an AAV expressing mCherry in AD in place of the AAV expressing sgRNAs. Long-term memory (LTM) recall test (mCh n = 9, KD n = 10 mice). (J) T-maze behavior (mCh n = 9, KD n = 10 mice). Dashed line indicates chance level (50% correct). Dashed line indicates the border between AD and AV. Two-tailed unpaired t test (I, J). For statistical comparisons, **p < 0.01; NS, not significant. Data are presented as mean ± SEM.
Figure 2.
Figure 2.. Knockdown of Several ASD and Schizophrenia Risk Genes from AD Thalamus Leads to Memory Impairments
(A-C) FISH staining (A), CFC behavior (B), T-maze behavior (C) (n = 9 mice per group). Ywhag expression is decreased by 94% (fluorescence intensity) in KD mice as compared to mCh controls (n = 3 mice per group). (D-F) FISH staining (D), CFC behavior (E), T-maze behavior (F) (n = 9 mice per group). Gria3 expression is decreased by 92% (fluorescence intensity) in KD mice as compared to mCh controls (n = 3 mice per group). (G-I) FISH staining (G), CFC behavior (H), T-maze behavior (I) (n = 9 mice per group). Cacna1g expression is decreased by 90% (fluorescence intensity) in KD mice as compared to mCh controls (n = 3 mice per group). (J-L) FISH staining (J), CFC behavior (K), T-maze behavior (L) (n = 9 mice per group). Herc1 expression is decreased by 97% (fluorescence intensity) in KD mice as compared to mCh controls (n = 3 mice per group). Dashed line indicates the border between AD and AV. Control FISH staining (A, D, G, J) from mCh mice. Dashed line in T-maze (C, F, I, L) indicates chance level (50% correct). Two-tailed unpaired t test (B-C, E-F, H-I, K-L). For statistical comparisons, *p < 0.05, **p < 0.01; NS, not significant. Data are presented as mean ± SEM.
Figure 3.
Figure 3.. Inputs and Electrophysiological Properties of AD and AV Thalamus
(A) FISH staining in ATN. (B-D) Mapping brain-wide inputs to AD or AV. RV starters (yellow) in AD (B) or AV (C), average RV-positive cell counts (D) (n = 3 mice for AD, n = 4 mice for AV, normalized starters across groups). PrL (prelimbic cortex), Cg1 (cingulate cortex area 1), Cg2 (cingulate cortex area 2), M2 (secondary motor cortex), S1BF (primary somatosensory cortex barrel field), RSA (retrosplenial agranular cortex), RSG (retrosplenial granular cortex). Dashed line in panel C indicates the border between AD and AV, see also Figures S2E–S2F. (E-I) RV-GFP labeling (E) of AD neurons (green), recorded neurons (red) (F), after-depolarization potential (ADP) amplitude (G), Ih current-induced sag (H), excitability (I) (22 AD RV+, 17 AD RV, 18 AV neurons, n = 3 mice). (J-K) Terminals of ChR2-eYFP injected into PreSub (left) or ChR2-mCherry injected into RSC (right) (J), connectivity between AD, AV, PreSub, and RSC (K). One-way ANOVA followed by Bonferroni post-hoc test (G-H), and two-way ANOVA with repeated measures followed by Bonferroni post-hoc test (I). For statistical comparisons, ***p < 0.001; NS, not significant. Data are presented as mean ± SEM.
Figure 4.
Figure 4.. The AD→RSC→EC Circuit is Necessary for Contextual Memory Encoding
(A) hM4Di expression in AD. (B) CFC behavior (n = 9 mice per group). mCherry control (mCh) mice received a Cre-dependent mCherry virus in place of the hM4Di virus. (C) mEPSCs of AD neurons from home cage (16 neurons) or CFC training (18 neurons) groups (n = 3 mice per group). (D) Activity of AD neurons using Fos-TRAP mice (n = 6 mice per group). Immediate shock (Imm. Shk.). AD neurons revealed by C1QL2 staining. (E-F) LFP traces before (Pre) vs. after (Post) CFC training, change in LFP power after training (E), change in power for individual frequency bands (F) (n = 15 mice). (G-H) AMPA/NMDA ratio recordings of AD circuits, representative traces (G), quantification (H) (AD→PreSub: 29 neurons per group, AD→RSC: 27 home cage and 26 training neurons, n = 3 mice per group). (I) Optogenetic terminal inhibition (eArch-eYFP, n = 12 mice) or activation (ChR2-eYFP, n = 7 mice) during CFC training. Control (eYFP, n = 14 mice). LTM test is plotted. (J-K) cFos staining in RSC using home cage (n = 7 mice), training control (mCherry or mCh, n = 7 mice), training AD hM4Di-mCh (n = 8 mice) groups (J), cFos staining in hippocampal CA1 (K) (n = 6 mice per group). Both mCh and hM4Di-mCh groups received C21 injections prior to training. Dentate gyrus (DG). (L) Two-step RV tracing showing AD, AV inputs to entorhinal cortex (EC)-projecting RSC neurons. Starters (yellow) in RSC (left image), upstream ATN labeling (right image). (M) Optogenetic terminal inhibition of EC-projecting RSC neurons, which receive ATN input, during training (eYFP n = 9 mice, eArch-eYFP n = 11 mice). Two-tailed unpaired t test (B-C, H, M), paired t test (F), and one-way ANOVA followed by Bonferroni post-hoc test (D, I-K). For statistical comparisons, *p < 0.05, **p < 0.01, ***p < 0.001; NS, not significant. Data are presented as mean ± SEM.
Figure 5.
Figure 5.. The AV→RSC Circuit Regulates Memory Specificity
(A) Halorhodopsin (NpHR) expression in AV, C1QL2 staining (red). (B) AV cell bodies or AV→RSC terminal inhibition during CFC training (day 1) followed by LTM recall and neutral context tests (control eGFP n = 8 mice, AV NpHR n =10 mice, AV→RSC NpHR n = 8 mice). (C) cFos staining in RSC using home cage (n = 4 mice), training control (eGFP, n = 5 mice), training AV→RSC NpHR-eYFP (n = 5 mice) groups. (D) Retrograde RV tracing in PV-Cre, somatostatin (SST)-Cre, or VIP-Cre mice. Images show RV labeling in AV thalamus (left), quantification of RV+ cells in AV (n = 4 mice per group) (right). Normalized starters across groups. (E-G) cFos activation of PV, VIP cell types in RSC during CFC training, representative images (E-F), overlap quantification (G) (PV-Cre: home cage n = 7 and training n = 8 mice, VIP-Cre: home cage n = 5 and training n = 7 mice). Cre mice were prepared by injecting a Cre-dependent eYFP virus in RSC. (H) Fold change plotted relative to average home cage counts (n = 8 PV-Cre training mice, n = 7 VIP-Cre training mice). (I-J) AV→RSC inhibition with PV or VIP activation in RSC during training, viral injection schematic (I), neutral context test (J) (PV-Cre: C21 n = 8 and C21+light n = 6 mice, VIP-Cre: C21 n = 7 and C21+light n = 6 mice). (K-L) AD→RSC or AV→RSC terminal inhibition during training in the cocaine-induced conditioned place preference behavior. Preference for the cocaine (Coc) vs. the saline (Sal) side is plotted within animal for the recall test (K), and the modified chamber test (L) (n = 12 mice per group). One-way ANOVA followed by Bonferroni post-hoc test (B-D), two-tailed unpaired t test (G-H, J), and paired t test (K-L). For statistical comparisons, *p < 0.05, **p < 0.01, ***p < 0.001; NS, not significant. Data are presented as mean ± SEM.
Figure 6.
Figure 6.. Normalizing Neuronal Hyperexcitability Rescues Memory Deficits in PTCHD1 KD Mice
(A) Ex vivo recordings from control (mCherry or mCh) vs. KD mice showing action potential (AP) threshold, AP half width, and neuronal excitability (24 mCh neurons, 23 KD neurons, n = 3 mice per group). (B-C) Viral injection schematic for electrophysiological recordings (B), AMPA/NMDA ratio recordings of the AD→RSC circuit (C) in wild type (data from Figure 4H) or KD (17 neurons per group, n = 3 mice each) animals. (D-F) Viral approach to chemogenetically normalize excitability in KD mice (D), AD neuronal excitability rescue ex vivo (E) (mCh control data from panel A, 14 neurons each for KD C21 low dose and KD C21 regular dose from n = 3 mice per group), AMPA/NMDA (A/N) ratio rescue in the AD→RSC circuit of KD mice (F) (PTCHD1 KD home cage and training data from panel C, 18 neurons for training low dose and 19 neurons for training regular dose from n = 3 mice per group). (G-H) cFos activation in RSC during CFC training for KD and rescue groups (G) (mCh controls n = 4 mice per group, KD home cage and training n = 4 mice per group, KD hM4Di groups n = 8 mice per group). CFC LTM test in KD and rescue groups (H) (mCh control and PTCHD1 KD data from Figure 1I, KD low n = 9 mice, KD regular n = 8 mice). Two-way ANOVA with repeated measures followed by Bonferroni post-hoc test (excitability data in A, E), two-tailed unpaired t test (AP threshold/half width in A, C, mCh control in G), and one-way ANOVA followed by Bonferroni post-hoc test (F, PTCHD1 KD in G, H). For statistical comparisons, *p < 0.05, **p < 0.01; NS, not significant. Data are presented as mean ± SEM.
Figure 7.
Figure 7.. Normalizing Neuronal Hyperexcitability Rescues Memory Deficits in YWHAG and HERC1 KD Mice
(A-B) Ex vivo recordings from control (mCherry or mCh) vs. YWHAG KD mice showing AP threshold and AP half width (A), neuronal excitability (B) (15 mCh neurons, 16 KD neurons, n = 3 mice per group). (C) AMPA/NMDA ratio recordings of the AD→RSC circuit in YWHAG KD mice (14 neurons per group, n = 3 mice each). (D) Viral approach to chemogenetically normalize excitability in YWHAG KD mice. (E) AD neuronal excitability rescue ex vivo (mCh control and YWHAG KD data from panel B, 15 neurons for KD C21 low dose group from n = 3 mice). (F) CFC training and LTM recall test in KD and rescue groups (mCh control and YWHAG KD data from Figure 2B, KD low n = 9 mice). (G-H) Ex vivo recordings from mCh control vs. HERC1 KD mice showing AP threshold and AP half width (G), neuronal excitability (H) (15 mCh neurons, 23 KD neurons, n = 3 mCh mice, n = 4 KD mice). (I) AMPA/NMDA ratio recordings of the AD→RSC circuit in HERC1 KD mice (12 home cage, 13 training neurons, n = 3 mice each). (J) CFC training and LTM recall test in KD and rescue groups (mCh control and HERC1 KD data from Figure 2K, KD low n = 9 mice). (K-M) KIR2.2 (K) (11 mCh neurons from 5 mice, 10 PTCHD1 KD neurons from 5 mice, 11 YWHAG KD neurons from 5 mice, 12 HERC1 KD neurons from 6 mice), CAV2.1 (L) (9 mCh neurons from 6 mice, 8 PTCHD1 KD neurons from 5 mice, 8 YWHAG KD neurons from 5 mice, 8 HERC1 KD neurons from 6 mice), and CAV2.2 (M) (9 mCh neurons from 6 mice, 8 PTCHD1 KD neurons from 5 mice, 8 YWHAG KD neurons from 5 mice, 8 HERC1 KD neurons from 6 mice) ex vivo current recordings. Current-voltage plotted for KIR2.2, current density-voltage plotted for CAV2.1 and CAV2.2. Two-tailed unpaired t test (A, C, G, I), two-way ANOVA with repeated measures followed by Bonferroni post-hoc test (B, E, H, K-M), and one-way ANOVA followed by Bonferroni post-hoc test (F, J). For statistical comparisons, *p < 0.05, **p < 0.01, ***p < 0.001; NS, not significant. Data are presented as mean ± SEM.

References

    1. Aida T, Chiyo K, Usami T, Ishikubo H, Imahashi R, Wada Y, Tanaka KF, Sakuma T, Yamamoto T, and Tanaka K (2015). Cloning-free CRISPR/Cas system facilitates functional cassette knock-in in mice. Genome Biol. 16, 87. - PMC - PubMed
    1. Aggleton JP, Keith AB, and Sahgal A (1991). Both fornix and anterior thalamic, but not mammillary, lesions disrupt delayed non-matching-to-position memory in rats. Behav. Brain Res. 44, 151–161. - PubMed
    1. Challis RC, Kumar SR, Chan KY, Challis C, Beadle K, Jang MJ, Kim HM, Rajendran PS, Tompkins JD, Shivkumar K, et al. (2019). Systemic AAV vectors for widespread and targeted delivery in rodents. Nat. Protoc. 14, 379–414. - PubMed
    1. Chatterjee S, Sullivan HA, MacLennan BJ, Xu R, Hou Y, Lavin TK, Lea NE, Michalski JE, Babcock KR, Dietrich S, et al. (2018). Nontoxic, double-deletion-mutant rabies viral vectors for retrograde targeting of projection neurons. Nat. Neurosci. 21, 638–646. - PMC - PubMed
    1. Chaudhry A, Noor A, Begagne B, Baker K, Bok LA, Brady AF, Chitayat D, Chung BH, Cytrynbaum C, Dyment D, et al. (2015). Phenotypic spectrum associated with PTCHD1 deletions and truncating mutations includes intellectual disability and autism spectrum disorder. Clin. Genet. 88, 224–233. - PubMed

Publication types

MeSH terms