. 2021 Aug 3;120(15):3103-3111.
doi: 10.1016/j.bpj.2021.06.009. Epub 2021 Jun 29.

Identification of a critical lipid ratio in raft-like phases exposed to nitric oxide: An AFM study

Affiliations

Identification of a critical lipid ratio in raft-like phases exposed to nitric oxide: An AFM study

Sanjai Karanth et al. Biophys J. .

Abstract

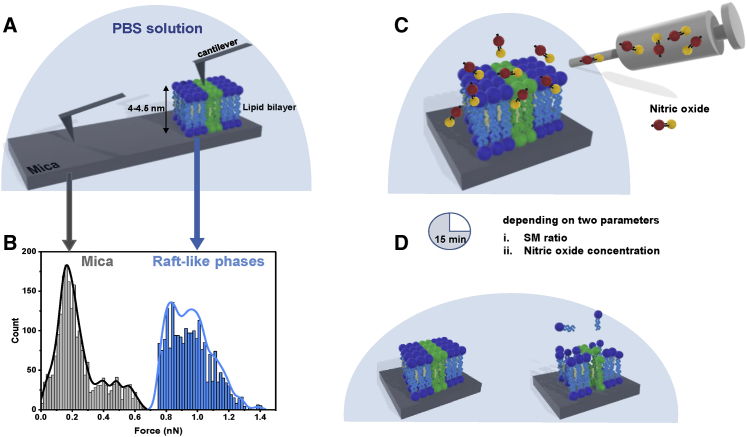
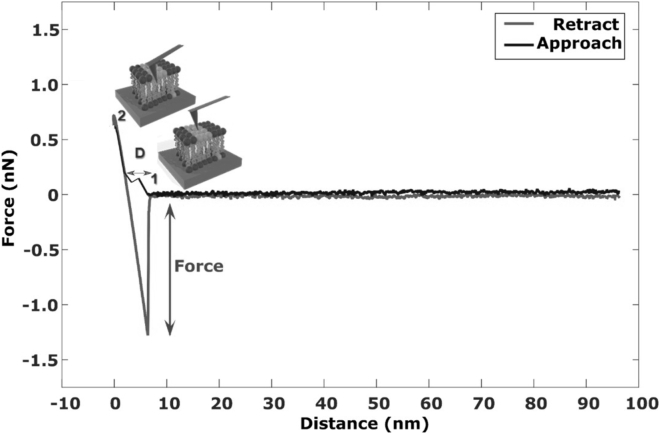
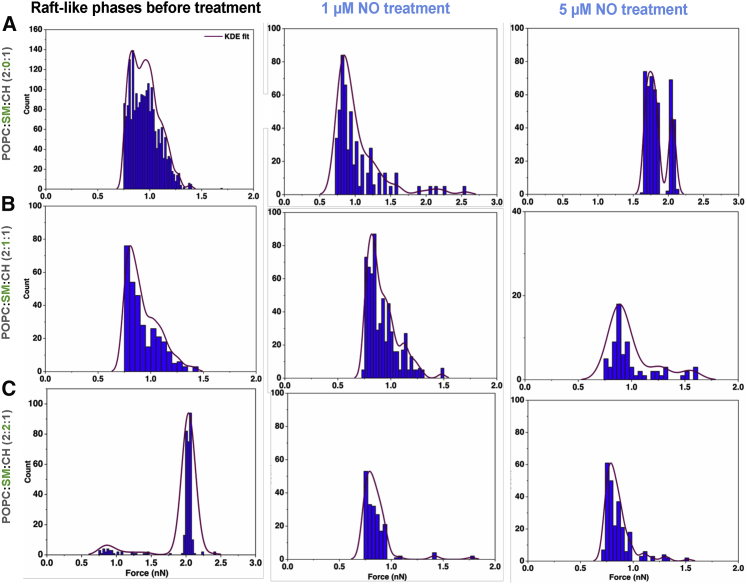
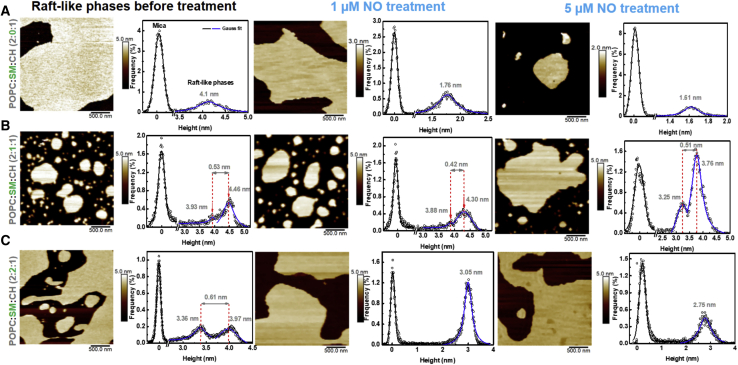
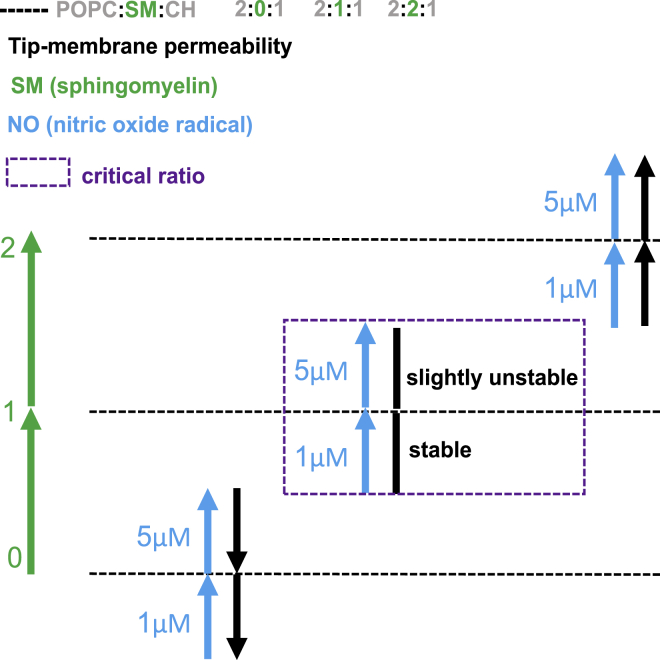
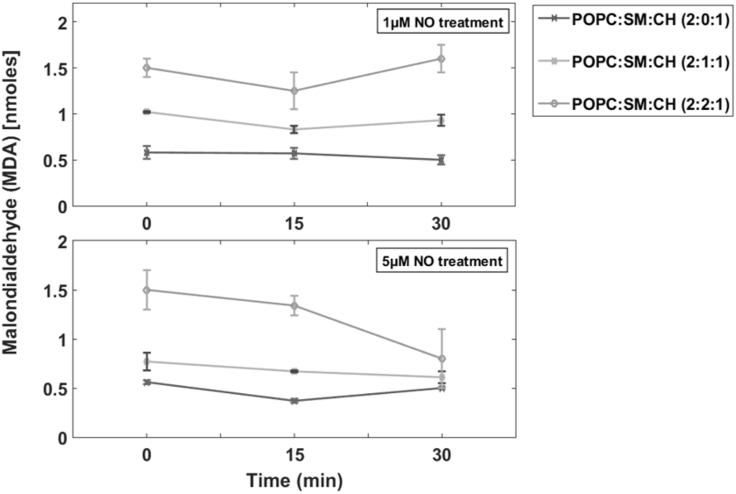
Lipid rafts are discrete, heterogeneous domains of phospholipids, sphingolipids, and sterols that are present in the cell membrane. They are responsible for conducting cell signaling and maintaining lipid-protein functionality. Redox-stress-induced modifications to any of their components can severely alter the mechanics and dynamics of the membrane causing impairment to the lipid-protein functionality. Here, we report on the effect of sphingomyelin (SM) in controlling membrane permeability and its role as a regulatory lipid in the presence of nitric oxide (NO). Force spectroscopy and atomic force microscopy imaging of raft-like phases (referring here to the coexistence of "liquid-ordered" and "liquid-disordered" phases in model bilayer membranes) prepared from lipids: 1-palmitoyl-2-oleoyl-glycero-3-phosphocholine (POPC):SM:cholesterol (CH) (at three ratios) showed that the adhesion forces to pull the tip out of the membrane increased with increasing SM concentration, indicating decreased membrane permeability. However, in the presence of NO radical (1 and 5 μM), the adhesion forces decreased depending on SM concentration. The membrane was found to be stable at the ratio POPC:SM:CH (2:1:1) even when exposed to 1 μM NO. We believe that this is a critical ratio needed by the raft-like phases to maintain homeostasis under stress conditions. The stability could be due to an interplay existing between SM and CH. However, at 5 μM NO, membrane deteriorations were detected. For POPC:SM:CH (2:2:1) ratio, NO displayed a pro-oxidant behavior and damaged the membrane at both radical concentrations. These changes were reflected by the differences in the height profiles of the raft-like phases observed by atomic force microscopy imaging. Malondialdehyde (a peroxidation product) detection suggests that lipids may have undergone lipid nitroxidation. The changes were instantaneous and independent of radical concentration and incubation time. Our study underlines the need for identifying appropriate ratios in the lipid rafts of the cell membranes to withstand redox imbalances caused by radicals such as NO.


Figures

Figure 1
Figure 1
Overview of the experimental setup and determination of threshold pull-out forces. Before measurements of tip-membrane forces, forces due to nonspecific interactions (i.e., tip-mica surface) were determined (A). The tip-mica surface generated adhesive forces ranging between 0.02 and 0.65 nN (B) with a maximum at ~0.2 nN. Based on the obtained values, 0.75 nN was set as threshold force above which adhesive forces were attributed to the pull-out force of tip from the lipid bilayer. Control and RLPs samples (with changing SM concentration) were later treated with NO for 15 min (C) and the possible outcomes were determined using force spectroscopy and AFM imaging (D). The histogram shown in (B) is plotted from the adhesion data of untreated POPC:SM:CH (2:0:1) bilayers. The straight lines are KDE. Break-through forces are described in Fig. 2. To see this figure in color, go online.
Figure 2
Figure 2
Schematic representation of acquisition of a force curve and respective events on the bilayer. Initially, the tip starts moving in the solution from a large distance toward the lipid bilayer (approach curve) until it comes in contact with it (indicated in the diagram as point 1). Then, the tip penetrates into the bilayer (generating break-through force) and constant compliance occurs (point 2). When the tip is pulled out of the lipid bilayer, it generates an adhesive force, detected as pull-out force (retract curve). The depth of tip penetration on approach (D), corresponds to the height of bilayer. As a typical example, a force curve for untreated POPC:SM:CH (2:0:1) bilayers is shown.
Figure 3
Figure 3
Histograms of tip-lipid bilayer pull-out forces of RLPs with different SM concentration in dependence to NO treatment. Force data of untreated RLP (left column), RLP post 1 μM (middle column) and post 5 μM NO treatment (right column) are shown. In each row, RLP with the same composition are shown. Untreated RLP show increase in pull-out forces at the largest SM concentration (AC, left) which indicates reduced membrane permeability. Addition of 1 μM NO to 2:0:1 (POPC:SM:CH) ratio caused the force spectrum to broaden (A, middle) compared with control (A, left), with maxima forces at 0.85 and 1.21 nN. At 5 μM, the maxima forces increased further to 1.74 and 2.05 nN (A, right). For 2:1:1 (POPC:SM:CH) ratio, a competitive behavior is observed and after NO treatment (at 1 and 5 μM), the pull-out forces (B, middle and right) were similar to untreated 2:1:1 (POPC:SM:CH) ratio. This indicates presence of possible critical concentration in maintaining membrane integrity. At 2:2:1 (POPC:SM:CH) ratio, detrimental effect of NO is observed (C, middle and right) with decrease in pull-out forces compared with control (C, left), indicating membrane destruction. Histograms represent force data of only tip-membrane interactions and tip-mica forces are excluded. To see this figure in color, go online.
Figure 4
Figure 4
AFM images of RLP with changing SM concentration and NO treatment. Images of untreated RLP (left column), RLP post 1 μM (middle column) and post 5 μM NO treatment (right column) are shown. The height histograms of each image are adjacent to it. At 2:0:1 (POPC:SM:CH) ratio, addition of NO showed decrease in the height of the lipid bilayer (A, middle and right) compared with control (A, left). At 2:1:1 (POPC:SM:CH) ratio, the difference in the heights of the two lipid phases for NO-treated samples was minor (B, middle and right) and similar to control (B, left) i.e., ~0.5 nm even though reduction in the height of individual phases were observed. This indicates membrane stability and negligible effect of NO. At 2:2:1 (POPC:SM:CH) ratio, merging of lipid phases (C, middle and right) is observed indicating the role of NO as a pro-oxidant. To see this figure in color, go online.
Figure 5
Figure 5
Interpretation of tip-membrane permeability of RLPs with changing SM ratio and NO concentration. In the presence of NO (blue arrow), tip-membrane permeability (black arrow) of POPC:SM:CH (2:0:1) decreases with increase in NO concentration. With addition of SM (green arrow) i.e., POPC:SM:CH (2:1:1) ratio, 1 μM NO shows stable RLPs and unaltered tip-membrane permeability. At 5 μM NO, the tip-membrane permeability was almost the same. This indicates existence of a critical ratio (violet-dashed box). POPC:SM:CH (2:2:1) ratio showed increase in tip-membrane permeability with increase in NO concentration. To see this figure in color, go online.
Figure 6
Figure 6
Lipid peroxidation assay to detect formation of MDA. With concentration of POPC being fixed, increasing SM supplemented to the amount of MDA (nM) formed. At 1 μM NO treatment (above), RLP of 2:0:1 showed lower MDA concentration (~0.6 nM) compared to 2:1:1 (~0.8 nM) and 2:1:1 (POPC:SM:CH) showed lower MDA compared to 2:2:1 (POPC:SM:CH) ratio (~1.25 nM). The same behavior was observed at 5 μM NO concentration (below). The increase in MDA with increase in SM concentration may be due to the presence of unsaturation. To confirm this hypothesis, a similar assay was performed with N-palmitoyl-D-erythro-sphingosylphosphorylcholine (100% 16:0 SM) and constant MDA levels were observed irrespective of lipid ratio or NO concentration (Fig. S3). The assay shows that although NO initiated the peroxidation, the concentration of produced MDA becomes constant over time, indicating that all available unsaturated lipids were modified. The absorbance values were obtained after subtraction of the blank as mentioned in the Materials and methods.

References

    1. Anishkin A., Loukin S.H., Kung C. Feeling the hidden mechanical forces in lipid bilayer is an original sense. Proc. Natl. Acad. Sci. USA. 2014;111:7898–7905. - PMC - PubMed
    1. Diz-Muñoz A., Fletcher D.A., Weiner O.D. Use the force: membrane tension as an organizer of cell shape and motility. Trends Cell Biol. 2013;23:47–53. - PMC - PubMed
    1. van Meer G., de Kroon A.I. Lipid map of the mammalian cell. J. Cell Sci. 2011;124:5–8. - PubMed
    1. Karanth S., Meesaragandla B., Delcea M. Changing surface properties of artificial lipid membranes at the interface with biopolymer coated gold nanoparticles under normal and redox conditions. Biophys. Chem. 2020;267:106465. - PubMed
    1. Ayala A., Muñoz M.F., Argüelles S. Lipid peroxidation: production, metabolism, and signaling mechanisms of malondialdehyde and 4-hydroxy-2-nonenal. Oxid. Med. Cell. Longev. 2014;2014:360438. - PMC - PubMed

Publication types

LinkOut - more resources