. 2021 Jul 20;120(14):2814-2827.
doi: 10.1016/j.bpj.2021.06.003. Epub 2021 Jun 29.

Dynamics of the SARS-CoV-2 nucleoprotein N-terminal domain triggers RNA duplex destabilization

Affiliations

Dynamics of the SARS-CoV-2 nucleoprotein N-terminal domain triggers RNA duplex destabilization

Ícaro P Caruso et al. Biophys J. .

Abstract

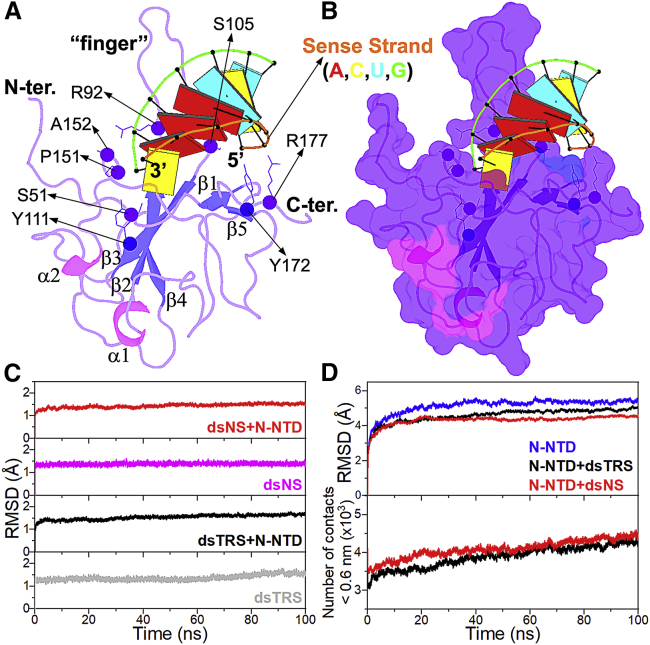
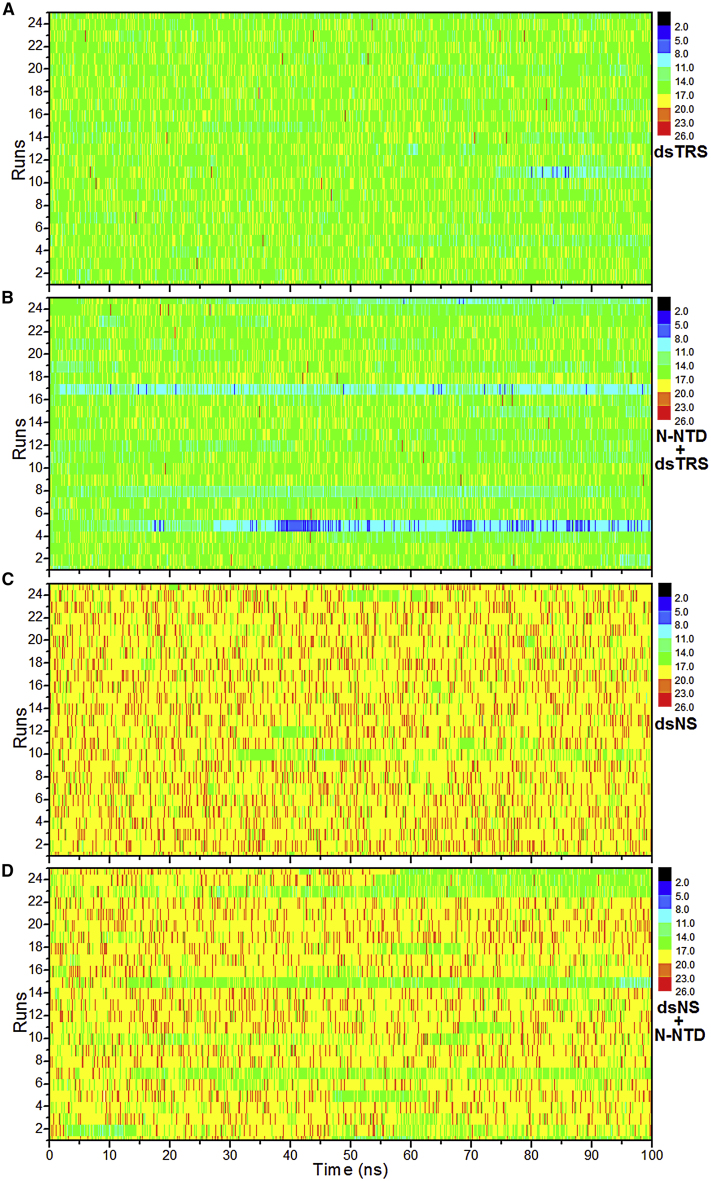
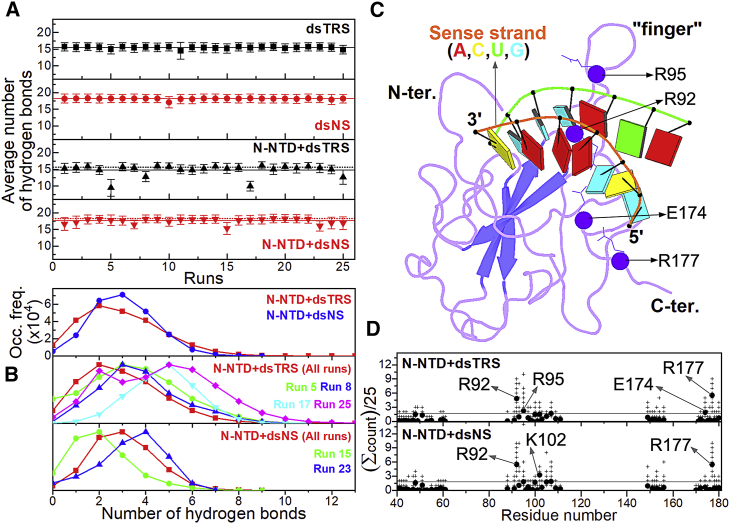
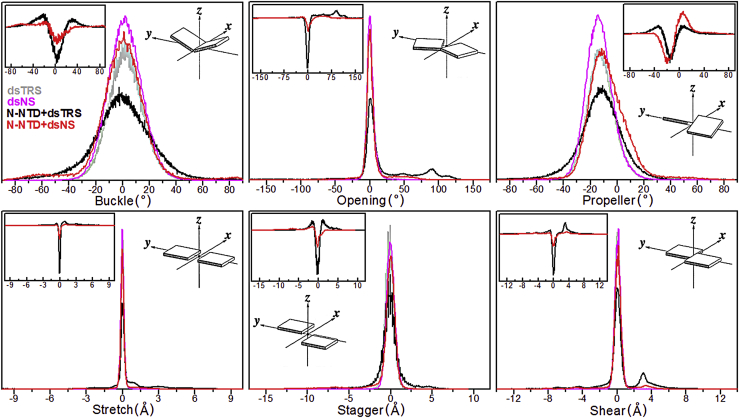
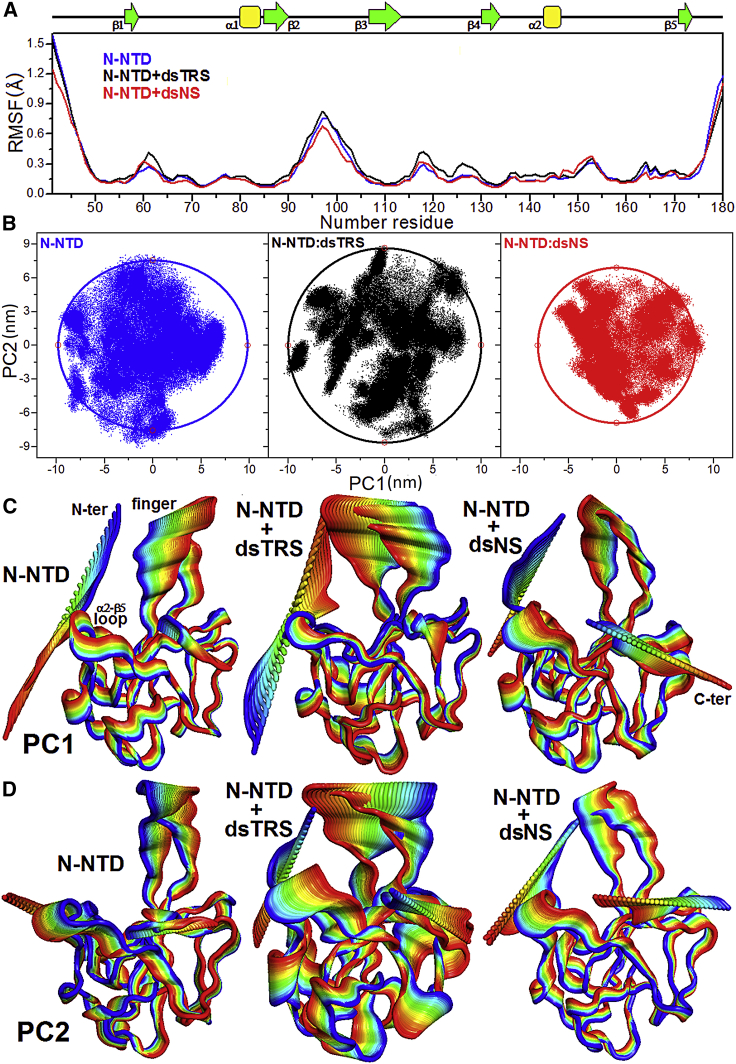
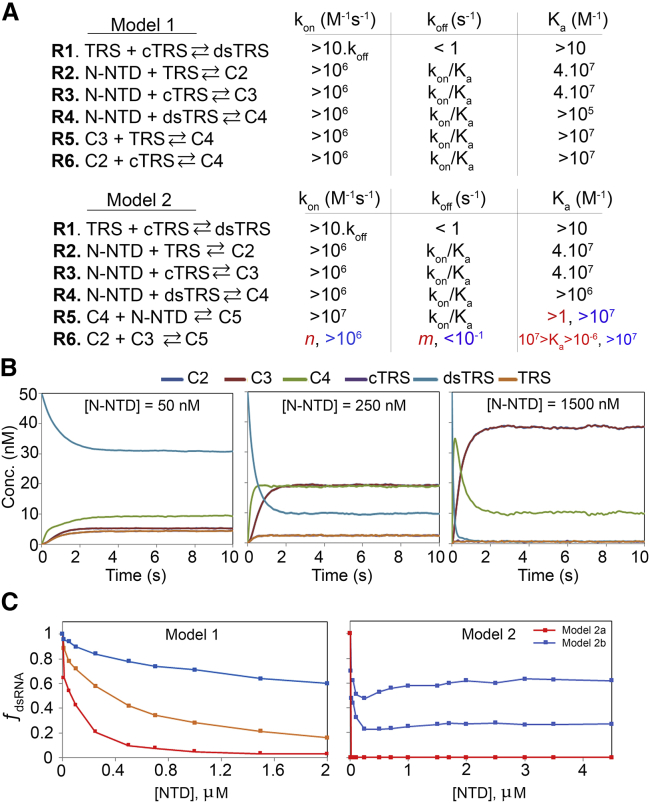
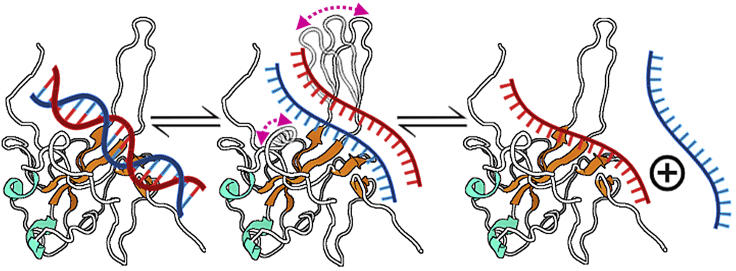
The nucleocapsid (N) protein of betacoronaviruses is responsible for nucleocapsid assembly and other essential regulatory functions. The N protein N-terminal domain (N-NTD) interacts and melts the double-stranded transcriptional regulatory sequences (dsTRSs), regulating the discontinuous subgenome transcription process. Here, we used molecular dynamics (MD) simulations to study the binding of the severe acute respiratory syndrome coronavirus 2 N-NTD to nonspecific (NS) and TRS dsRNAs. We probed dsRNAs' Watson-Crick basepairing over 25 replicas of 100 ns MD simulations, showing that only one N-NTD of dimeric N is enough to destabilize dsRNAs, triggering melting initiation. dsRNA destabilization driven by N-NTD was more efficient for dsTRSs than dsNS. N-NTD dynamics, especially a tweezer-like motion of β2-β3 and Δ2-β5 loops, seems to play a key role in Watson-Crick basepairing destabilization. Based on experimental information available in the literature, we constructed kinetics models for N-NTD-mediated dsRNA melting. Our results support a 1:1 stoichiometry (N-NTD/dsRNA), matching MD simulations and raising different possibilities for N-NTD action: 1) two N-NTD arms of dimeric N would bind to two different RNA sites, either closely or spatially spaced in the viral genome, in a cooperative manner; and 2) monomeric N-NTD would be active, opening up the possibility of a regulatory dissociation event.


Figures

Figure 1
Figure 1
Structural model of the N-NTD/dsRNA complex and its validation from MD simulations. (A) Structural model of the N-NTD/dsTRS complex determined by molecular docking calculations and mutation of dsNS nucleotide sequence. N-NTD is presented as a cartoon, and dsTRS is denoted as a ribbon model with basepairing as colored rectangles. The color of the rectangles corresponds to the nitrogenous base of the dsRNA sense strand, namely A: red, C: yellow, U: cyan, and G: green. The large protruding β2-β3 loop is referred to as the finger. The residues involved in polar contacts with the dsTRS are presented as sphere (α-carbon) and lines (side chain). The α-helix and β-sheet secondary structures are colored in magenta and blue, respectively. (B) Surface representation of the structural model of the N-NTD/dsTRS complex. (C) Average RMSD values for dsNS and dsTRS in their free and N-NTD-bound states. (D) Average RMSD values for N-NTD in its free and dsRNA-bound state (top) and average number of contacts between N-NTD and dsRNA atoms (distance <0.6 nm) (bottom). The average values correspond to 25 MD simulations with the same starting point. To see this figure in color, go online.
Figure 2
Figure 2
Stability of the WC basepairing via RNA-RNA hydrogen bonds of dsRNAs. The number of RNA-RNA hydrogen bonds formed between the sense and antisense strands of dsNS and dsTRS in their free states (A and C) and in complex with N-NTD (B and D) over the 100 ns simulations for the 25 MD replicas (runs) is shown. The plot takes into consideration the canonical WC basepairing, which represents the majority of hydrogen bonds (18 for dsNS and 16 for dsTRS), and noncanonical transient hydrogen bonds. The color bar denotes the correspondence between the color code and the number of RNA-RNA hydrogen bonds.
Figure 3
Figure 3
Analysis of the RNA-RNA and protein-RNA hydrogen bonds. (A) The average number of RNA-RNA hydrogen bonds between the sense and antisense strands of dsNS (red) and dsTRS (black) in their free states (squares and circles) and in complex with N-NTD (up and down triangles, respectively) for each of the 25 replicas of 100 ns MD simulation. The black and red solid lines denote the overall average values for the 25 runs, which are also presented numerically with their respective SDs. The dotted line shows the overall average values for the 25 runs for the free dsRNA. The standard deviation along the MD simulation for each replica is denoted by the error bars. (B, top) Distribution of the occurrence frequency of the number of hydrogen bonds between the nitrogenous bases of dsRNA (dsTRS in red and dsNS in blue) and N-NTD for the 25 replicas along the 100 ns MD simulations. (Middle) Normalized distribution of occurrence frequency of the number of protein-nitrogenous base hydrogen bonds for all 25 replicas (red) and runs 5 (green), 8 (blue), 17 (cyan), and 25 (magenta) of the N-NTD/dsTRS complex. (Bottom) Normalized distribution of the number of protein-nitrogenous base hydrogen bonds for all 25 replicas (red) and runs 15 (green) and 23 (blue) of the N-NTD/dsNS complex. (C) Structural model of the N-NTD/dsTRS complex representative of the MD simulation for run 5. The protein is shown in a purple cartoon, and dsTRS is denoted as a ribbon model with nitrogenous bases and basepairing as colored squares and rectangles, respectively. The color of the squares corresponds to the type of nitrogenous base, namely A: red, C: yellow, U: cyan, and G: green, and the rectangles refer to the nitrogenous base color of the dsRNA sense strand. (D) Average counts per replica of protein-RNA hydrogen bonds with percentage of persistence higher than 10% as a function of the residue number (solid circle). The crosses show the counts for each replica. The horizontal line shows the threshold of the average counts averaged over all residues plus one SD. To see this figure in color, go online.
Figure 4
Figure 4
Normalized population distributions of the local basepair parameters. Normalized population distributions of local basepair parameters (angles: buckle, opening, and propeller; distances: stretch, stagger, and shear) for runs 5, 8, 17, and 25 of dsTRS and runs 15 and 23 of dsNS in their free form (dsTRS in light gray and dsNS in magenta, respectively) and complexed with N-NTD are shown (N-NTD + dsTRS in black and N-NTD + dsNS in red). The normalization was defined with respect to the highest distribution curse for each basepair parameter. The plot insets correspond to the difference between the population distributions of N-NTD-bound dsRNA minus its free state for dsNS (red) and dsTRS (black). The scheme insets illustrate the geometrical definition of each local basepair parameter (41). To see this figure in color, go online.
Figure 5
Figure 5
Analysis of N-NTD conformational flexibility in its free and dsRNA-bound states. (A) RMSF values as a function of residue number for N-NTD in its free state (blue line) and complexed with either dsTRS (black) or dsNS (red). The secondary structures along the sequence are indicated at the top. (B) PCA scatter plots PC1 and PC2 for free N-NTD (blue dots, left) and for N-NTD complexed with either TRS (black dots, middle) or NS (red dots, right) dsRNAs. The extent of the conformational space for each scatter plot was measured by fitting an elliptical shell (solid lines) that contains 95% of the density. (C and D) Motions filtered from the eigenvectors of PC1 (C) and PC2 (D) for the dynamics data of N-NTD in its free form and complexed with either dsTRS or dsNS. The motion direction is indicated by the color variation from blue to red. To perform the RMSF and PCA calculations, the last 50 ns of trajectories of the 25 replicates were concatenated for each of the molecular systems (free or dsRNA-bound N-NTD), resulting in MD simulations of 1.25 μs. To see this figure in color, go online.
Figure 6
Figure 6
Simulation of the kinetics of dsRNA-melting activity. (A) Reactions R1–R6 for models 1 and 2. Model 1 implies the melting activity with stoichiometry of 1 N-NTD for 1 dsRNA (C4), and model 2 implies the formation of a sandwich with a stoichiometry two N-NTDs and one dsRNA (C5). At the right of each reaction are the ranges of kon, koff, and Ka in which the simulation produces a dsRNA-melting curve, respecting the boundaries described in the text. For reaction R6 of model 2, the color code refers to the color of the simulated melting curves for model 2. (B) Illustration of the kinetics of dsRNA-melting for model 1 in three different concentrations of N-NTD (50, 250, and 1500 nM). (C) Simulated dsRNA-melting curve for model 1 and 2. We used the starting concentration of 50 nM of dsRNA for all simulations. For model 1 simulations, we used the following reaction rates: kon (R1) = 4 × 10−1 M−1 s−1 and koff = 8 × 10−4 s−1; kon (R2, R3) = 4 × 107 M−1 s−1 and koff = 1 s−1; kon (R4) = 1 × 107 M−1 s−1 and koff = 1 s−1; kon (R5, R6) = 4 × 107 M−1 s−1 and koff = 1 s−1 (red); kon (R5, R6) = 4 × 108 M−1 s−1 and koff = 1 s−1 (orange); and kon (R5, R6) = 6 × 108 M−1 s−1 and koff = 1 × 10−1 s−1 (blue). For model 2 simulations, we used the following reaction rates: kon (R1) = 4 × 10−1 M−1 s−1 and koff = 8 × 10−4 s−1; kon (R2, R3) = 4 × 107 M−1 s−1 and koff = 1 s−1; kon (R4) = 1 × 107 M−1 s−1 and koff = 1 s−1; kon (R5) = 1 × 108 M−1 s−1 and koff = 1 s−1 (red); kon (R6) = 1 × 10−1 M−1 s−1 and koff = 1 × 108 s−1 (red); kon (R6) = 1 × 106 M−1 s−1 and koff = 1 × 10−1 s−1 (blue, bottom); and kon (R6) = 1 × 107 M−1 s−1 and koff = 1 × 10−1 s−1 (blue, top). To see this figure in color, go online.
Figure 7
Figure 7
Summary of the proposed mechanism for dsRNA melting activity of N-NTD. The binding of one N-NTD to one dsRNA triggers the destabilization of WC basepairing of the dsRNA and consequently exposes the nitrogenous bases for interacting directly with the N-NTD. We suggest that this activity is a consequence of intrinsic dynamics of N-NTD, especially because of the tweezer-like motion between β2-β3 (finger) and Δ2-β5 loops. The protein is denoted as cartoon with the helix-Δ and β-strand secondary structures colored in cyan and orange, respectively. The dsRNA is showed as a line model with the complementary strands colored in red and blue. The tweezer-like motion between the finger and Δ2-β5 loop is indicated by bidirectional arrows colored in magenta. To see this figure in color, go online.

References

    1. Zhu N., Zhang D., Tan W., China Novel Coronavirus Investigating and Research Team A novel coronavirus from patients with pneumonia in China, 2019. N. Engl. J. Med. 2020;382:727–733. - PMC - PubMed
    1. Zhou P., Yang X.L., Shi Z.L. A pneumonia outbreak associated with a new coronavirus of probable bat origin. Nature. 2020;579:270–273. - PMC - PubMed
    1. Klein S., Cortese M., Chlanda P. SARS-CoV-2 structure and replication characterized by in situ cryo-electron tomography. Nat. Commun. 2020;11:5885. - PMC - PubMed
    1. Naqvi A.A.T., Fatima K., Hassan M.I. Insights into SARS-CoV-2 genome, structure, evolution, pathogenesis and therapies: structural genomics approach. Biochim. Biophys. Acta Mol. Basis Dis. 2020;1866:165878. - PMC - PubMed
    1. Fang S.G., Shen H., Liu D.X. Proteolytic processing of polyproteins 1a and 1ab between non-structural proteins 10 and 11/12 of Coronavirus infectious bronchitis virus is dispensable for viral replication in cultured cells. Virology. 2008;379:175–180. - PMC - PubMed

Publication types