

Gut Microbiota Profile and Its Association with Clinical Variables and Dietary Intake in Overweight/Obese and Lean Subjects: A Cross-Sectional Study
- PMID: 34199239
- PMCID: PMC8231825
- DOI: 10.3390/nu13062032
Gut Microbiota Profile and Its Association with Clinical Variables and Dietary Intake in Overweight/Obese and Lean Subjects: A Cross-Sectional Study
Abstract
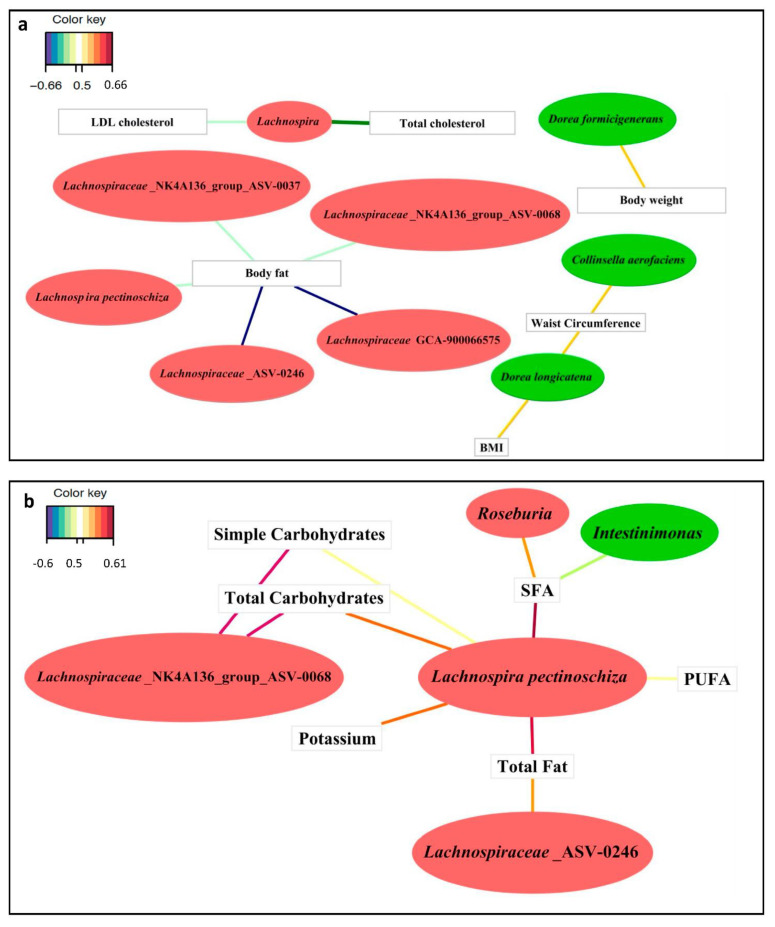
We aimed to differentiate gut microbiota composition of overweight/obese and lean subjects and to determine its association with clinical variables and dietary intake. A cross-sectional study was performed with 96 overweight/obese subjects and 32 lean subjects. Anthropometric parameters were positively associated with Collinsella aerofaciens, Dorea formicigenerans and Dorea longicatena, which had higher abundance the overweight/obese subjects. Moreover, different genera of Lachnospiraceae were negatively associated with body fat, LDL and total cholesterol. Saturated fatty acids (SFAs) were negatively associated with the genus Intestinimonas, a biomarker of the overweight/obese group, whereas SFAs were positively associated with Roseburia, a biomarker for the lean group. In conclusion, Dorea formicigenerans, Dorea longicatena and Collinsella aerofaciens could be considered obesity biomarkers, Lachnospiraceae is associated with lipid cardiovascular risk factors. SFAs exhibited opposite association profiles with butyrate-producing bacteria depending on the BMI. Thus, the relationship between diet and microbiota opens new tools for the management of obesity.
Keywords: dietary intake; gut microbiota; obesity; saturated fatty acids.
Conflict of interest statement
The authors declare no conflict of interest.
Figures
Similar articles
-
Low dietary fiber intake increases Collinsella abundance in the gut microbiota of overweight and obese pregnant women.Gut Microbes. 2018;9(3):189-201. doi: 10.1080/19490976.2017.1406584. Epub 2018 Mar 13. Gut Microbes. 2018. PMID: 29144833 Free PMC article.
-
Dietary intake of fat and fibre according to reference values relates to higher gut microbiota richness in overweight pregnant women.Br J Nutr. 2017 Sep;118(5):343-352. doi: 10.1017/S0007114517002100. Br J Nutr. 2017. PMID: 28901891
-
Ketonuria Is Associated with Changes to the Abundance of Roseburia in the Gut Microbiota of Overweight and Obese Women at 16 Weeks Gestation: A Cross-Sectional Observational Study.Nutrients. 2019 Aug 8;11(8):1836. doi: 10.3390/nu11081836. Nutrients. 2019. PMID: 31398880 Free PMC article.
-
Relationship between fatty acids intake and Clostridium coccoides in obese individuals with metabolic syndrome.Food Res Int. 2018 Nov;113:86-92. doi: 10.1016/j.foodres.2018.07.002. Epub 2018 Jul 4. Food Res Int. 2018. PMID: 30195549 Review.
-
Gut Microbiome Composition in Obese and Non-Obese Persons: A Systematic Review and Meta-Analysis.Nutrients. 2021 Dec 21;14(1):12. doi: 10.3390/nu14010012. Nutrients. 2021. PMID: 35010887 Free PMC article.
Cited by
-
Exercise-changed gut mycobiome as a potential contributor to metabolic benefits in diabetes prevention: an integrative multi-omics study.Gut Microbes. 2024 Jan-Dec;16(1):2416928. doi: 10.1080/19490976.2024.2416928. Epub 2024 Oct 29. Gut Microbes. 2024. PMID: 39473051 Free PMC article. Clinical Trial.
-
Low-gainer diet-induced obese microbiota transplanted mice exhibit increased fighting.Clin Transl Sci. 2024 Sep;17(9):e13906. doi: 10.1111/cts.13906. Clin Transl Sci. 2024. PMID: 39212186 Free PMC article.
-
Gut Microbiota Patterns in Patients with Non-Alcoholic Fatty Liver Disease: A Comprehensive Assessment Using Three Analysis Methods.Int J Mol Sci. 2023 Oct 17;24(20):15272. doi: 10.3390/ijms242015272. Int J Mol Sci. 2023. PMID: 37894951 Free PMC article.
-
Gut microbiota is associated with dietary intake and metabolic markers in healthy individuals.Food Nutr Res. 2022 Jun 23;66. doi: 10.29219/fnr.v66.8580. eCollection 2022. Food Nutr Res. 2022. PMID: 35844956 Free PMC article.
-
Dietary macronutrients and the gut microbiome: a precision nutrition approach to improve cardiometabolic health.Gut. 2022 Jun;71(6):1214-1226. doi: 10.1136/gutjnl-2020-323715. Epub 2022 Feb 8. Gut. 2022. PMID: 35135841 Free PMC article. Review.
References
-
- World Health Organization Obesity and Overweight. [(accessed on 15 July 2020)]; Available online: https://www.who.int/news-room/fact-sheets/detail/obesity-and-overweight.
-
- National Heart Lung and Blood Institute Overweight and Obesity | NHLBI, NIH. [(accessed on 15 July 2020)]; Available online: https://www.nhlbi.nih.gov/health-topics/overweight-and-obesity.
-
- González-Rodríguez L.G., Perea Sánchez J.M., Aranceta-Bartrina J., Gil Á., González-Gross M., Serra-Majem L., Varela-Moreiras G., Ortega R.M. Intake and Dietary Food Sources of Fibre in Spain: Differences with Regard to the Prevalence of Excess Body Weight and Abdominal Obesity in Adults of the ANIBES Study. Nutrients. 2017;9:326. doi: 10.3390/nu9040326. - DOI - PMC - PubMed
MeSH terms
Substances
Grants and funding
LinkOut - more resources
Full Text Sources
Other Literature Sources
Medical
