. 2021 Jun 13;22(12):6336.
doi: 10.3390/ijms22126336.

Inter-Metastatic Heterogeneity of Tumor Marker Expression and Microenvironment Architecture in a Preclinical Cancer Model

Affiliations

Inter-Metastatic Heterogeneity of Tumor Marker Expression and Microenvironment Architecture in a Preclinical Cancer Model

Jessica Kalra et al. Int J Mol Sci. .

Abstract

Background: Preclinical drug development studies rarely consider the impact of a candidate drug on established metastatic disease. This may explain why agents that are successful in subcutaneous and even orthotopic preclinical models often fail to demonstrate efficacy in clinical trials. It is reasonable to anticipate that sites of metastasis will be phenotypically unique, as each tumor will have evolved heterogeneously with respect to gene expression as well as the associated phenotypic outcome of that expression. The objective for the studies described here was to gain an understanding of the tumor heterogeneity that exists in established metastatic disease and use this information to define a preclinical model that is more predictive of treatment outcome when testing novel drug candidates clinically.

Methods: Female NCr nude mice were inoculated with fluorescent (mKate), Her2/neu-positive human breast cancer cells (JIMT-mKate), either in the mammary fat pad (orthotopic; OT) to replicate a primary tumor, or directly into the left ventricle (intracardiac; IC), where cells eventually localize in multiple sites to create a model of established metastasis. Tumor development was monitored by in vivo fluorescence imaging (IVFI). Subsequently, animals were sacrificed, and tumor tissues were isolated and imaged ex vivo. Tumors within organ tissues were further analyzed via multiplex immunohistochemistry (mIHC) for Her2/neu expression, blood vessels (CD31), as well as a nuclear marker (Hoechst) and fluorescence (mKate) expressed by the tumor cells.

Results: Following IC injection, JIMT-1mKate cells consistently formed tumors in the lung, liver, brain, kidney, ovaries, and adrenal glands. Disseminated tumors were highly variable when assessing vessel density (CD31) and tumor marker expression (mkate, Her2/neu). Interestingly, tumors which developed within an organ did not adopt a vessel microarchitecture that mimicked the organ where growth occurred, nor did the vessel microarchitecture appear comparable to the primary tumor. Rather, metastatic lesions showed considerable variability, suggesting that each secondary tumor is a distinct disease entity from a microenvironmental perspective.

Conclusions: The data indicate that more phenotypic heterogeneity in the tumor microenvironment exists in models of metastatic disease than has been previously appreciated, and this heterogeneity may better reflect the metastatic cancer in patients typically enrolled in early-stage Phase I/II clinical trials. Similar to the suggestion of others in the past, the use of models of established metastasis preclinically should be required as part of the anticancer drug candidate development process, and this may be particularly important for targeted therapeutics and/or nanotherapeutics.

Keywords: chemoresistance; drug development; inter-metastatic heterogeneity; metastasis; multiplex immunohistochemistry; preclinical studies; translational medicine.


Conflict of interest statement

The authors declare no conflict of interest.

Figures

Figure 1
Figure 1
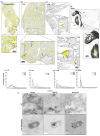
JIMT-1mKate cells (red) were inoculated in the mammary fat pad or left ventricle of female NCr nude mice. Subsequently, solid tumor (a) and metastatic (b) progression was followed using Maestro imaging. Organs excised from animals were imaged ex vivo using Maestro imaging (c). Disease consistently developed in the liver, lungs, kidney, ovaries, adrenal gland, and brain (d). Tumor-positive ovaries from animals inoculated with JIMT-1mKate and JIMT-1 cells were used as a positive and negative control respectively, to optimize Maestro imaging (e). Tumors and metastatic lesions were excised and subject to hematoxylin staining (f). Selected images show an orthotopic tumor (top bar = 250 µm), a tumor-infiltrated ovary (bottom, left, bar = 500 µm), and tumor nodules in the liver (arrows, bar = 250 µm).
Figure 2
Figure 2
mKate, Her2/neu, and Hoechst nuclear dye were used to identify metastatic lesions in organ tissues subject to tumor mapping immunofluorescence. The location of metastatic lesions within normal tissues was identified using images of Hoechst 33342 nuclear dye (grey) and mKate (yellow). Although JIMT-1 cells were transduced with mKate, orthotopic tumors (a) and metastatic lesions (bd) showed significant heterogeneity in mKate positivity when comparing lesions from different locations, as well as when comparing metastatic lesions within the same liver (b), lung (c), or brain (d) sections. mKate fluorescence was evaluated for heterogeneity by plotting the distribution of pixels across intensity levels from 0 to 255. When comparing entire tumor maps of orthotopic tumors or lesions of the brain, the distribution of pixels across intensity levels is similar for four animals (e,h). However, when comparing lesions within the liver and lungs, heterogeneity in mKate expression is observed (f,g). Bar = 250 µm. Orthotopic tumors and metastatic lesions from the liver were examined for the presence of mKate, hMHC1, and Her2/neu in order to determine how well each of these markers would be able to distinguish between human tissue and mouse tissue. The liver metastasis shown exemplifies heterogeneity in the staining of all three markers (i).
Figure 3
Figure 3
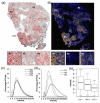
Significant intra-tumoral heterogeneity of Her2/neu expression is observed in orthotopic tumors. Tissue sections of orthotopic tumors were probed for Her2/neu expression and imaged for Her2/neu (red) and Hoechst (grey) (n = 4). A representative image of an orthotopic tumor is shown (a), selected regions from the tumor that represent high expression levels (R1), low expression levels (R2), and moderate expression levels (R3) are shown where grey represents nuclei, and red Her2/neu expression. A heat map was generated from the greyscale image of Her2/neu fluorescence (b, R1, R2, R3), where red represents strong staining, yellow moderate staining and blue weak staining. Her2/neu expression was evaluated for heterogeneity by plotting the distribution of pixels across intensity levels from 0 to 255 for four orthotopic tumors (c), and for three ROI within one orthotopic tumor (d). Boxplots were used to illustrate the distribution of pixels across intensity levels for three ROI within one orthotopic tumor, and a Kruskal–Wallis test provided a statistically significant p-value (<0.005). (e). Bar = 250 µm.
Figure 4
Figure 4
Significant inter-metastatic heterogeneity is seen for Her2/neu expression across liver lesions. Sections of liver tissue were probed for Her2/neu expression and imaged for Her2/neu (red) and Hoechst (grey) (n = 3). A representative image of a section of liver tissue is shown (a), and metastatic lesions are identified as M1 through to M6. Selected lesions that represent high expression levels (M6) and low expression levels (M1 and M4) are shown. A heat map was generated from the greyscale image of Her2/neu fluorescence (b). Her2/neu expression was examined by looking at the distribution of pixels across intensity levels from 0 to 255 for each lesion within the tissue (c). The average pixel intensity for each lesion within 3 liver samples from three animals was also plotted (d). Boxplots were used to illustrate the distribution of pixels across intensity levels for each lesion within one liver section, and a Kruskal–Wallis test provided a statistically significant p-value (<0.0001) (e). Bar = 250 µm.
Figure 5
Figure 5
Significant inter-metastatic heterogeneity is seen for Her2/neu expression across lung lesions. Sections of lung tissue were probed for Her2/neu expression and imaged for Her2/neu (red) and Hoechst (grey) (n = 3). A representative image of a section of lung tissue is shown (a), and metastatic lesions are identified as M1 through to M9. Selected lesions from the lung that represent high expression levels (M2 and M3), as well as low expression levels (M4 and M7), are shown. A heat map was generated from the greyscale image of Her2/neu fluorescence (b). Her2/neu expression was examined by looking at the distribution of pixels across intensity levels from 0 to 255 in each of the lesions within the tissue (c). The average pixel intensity for each lesion was also calculated and plotted (d). Boxplots were used to illustrate the distribution of pixels across intensity levels for each lesion within one lung section, and a Kruskal–Wallis test provided a statistically significant p-value (<0.0001) (e). Bar = 250 µm.
Figure 6
Figure 6
Inter-metastatic heterogeneity is not observed in Her2/neu expression across brain lesions. Tissue sections of the brain were probed for Her2/neu expression and imaged for Her2/neu (red) and Hoechst (grey) (n = 2). A representative image of a section of brain tissue is shown (a), and metastatic lesions are identified as M1 through to M8. Selected lesions from the brain are also shown (M1, M2, M4, and M5). A heat map was generated from the greyscale image of Her2/neu fluorescence (b). Her2/neu expression was examined by looking at the distribution of pixels across intensity levels from 0 to 255 for each lesion within the tissue (c). The average pixel intensity for each lesion was also plotted (d). Boxplots were used to illustrate the distribution of pixels across intensity levels for each lesion within one brain section, and a Kruskal–Wallis test provided a statistically significant p-value (<0.005) (e).
Figure 7
Figure 7
Vascular architecture and density show significant intra-tumoral and inter-metastatic heterogeneity. To examine vascular density, tissue sections were stained with Hoechst (grey) and CD31 (blue). The size and structures of blood vessels are shown in representative lesions from orthotopic tumors, lung, liver, and brain (a). Differences in vascular architecture can be appreciated between lesions (T), as well as between lesions (T) and their respective adjacent normal tissues (N). Bar = 100 µm. Vascular density was calculated using an automated algorithm that calculates the average distance of any given pixel in a region of interest to a CD31-positive pixel. The vascular density for each lesion was plotted as a box and whisker plot to illustrate the variability, and a Kruskal–Wallis test did not provide a statistically significant p-value (0.1983) (b).
Figure 8
Figure 8
Tissue sections were simultaneously probed for Her2/neu expression (red) and CD31 (blue) from orthotopic tumors (a), liver (b), lung (c), and brain (d) tissues. Vascular density was quantified by calculating the average distance from each pixel to a CD31-positive object and correlated with average pixel intensity of the Her2/neu expression for liver (b), lung (c), and brain lesions (d).

References

    1. Day C.-P., Merlino G., Van Dyke T. Preclinical Mouse Cancer Models: A Maze of Opportunities and Challenges. Cell. 2015;163:39–53. doi: 10.1016/j.cell.2015.08.068. - DOI - PMC - PubMed
    1. Kerbel R.S. Human Tumor Xenografts as Predictive Preclinical Models for Anticancer Drug Activity in Humans: Better than Commonly Perceived—But They Can Be Improved. Cancer Biol. Ther. 2003;2:133–138. doi: 10.4161/cbt.213. - DOI - PubMed
    1. Peterson J.K., Houghton P.J. Integrating pharmacology and in vivo cancer models in preclinical and clinical drug development. Eur. J. Cancer. 2004;40:837–844. doi: 10.1016/j.ejca.2004.01.003. - DOI - PubMed
    1. Ruggeri B.A., Camp F., Miknyoczki S. Animal models of disease: Pre-clinical animal models of cancer and their applications and utility in drug discovery. Biochem. Pharmacol. 2014;87:150–161. doi: 10.1016/j.bcp.2013.06.020. - DOI - PubMed
    1. Takimoto C.H. Why Drugs Fail: Of Mice and Men Revisited. Clin. Cancer Res. 2001;7:229–230. - PubMed

Substances