. 2021 Jun 4;11(6):746.
doi: 10.3390/brainsci11060746.

Three-Dimensional X-ray Imaging of β-Galactosidase Reporter Activity by Micro-CT: Implication for Quantitative Analysis of Gene Expression

Affiliations

Three-Dimensional X-ray Imaging of β-Galactosidase Reporter Activity by Micro-CT: Implication for Quantitative Analysis of Gene Expression

Olga Ermakova et al. Brain Sci. .

Abstract

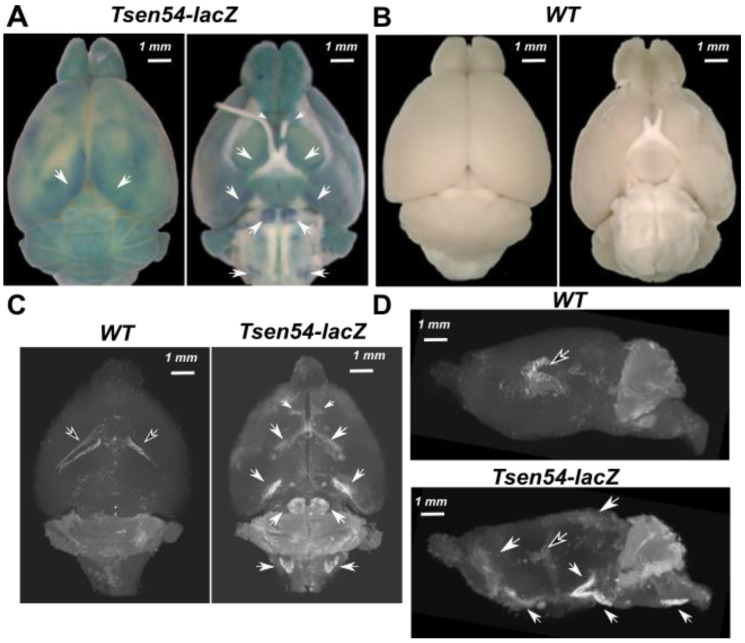
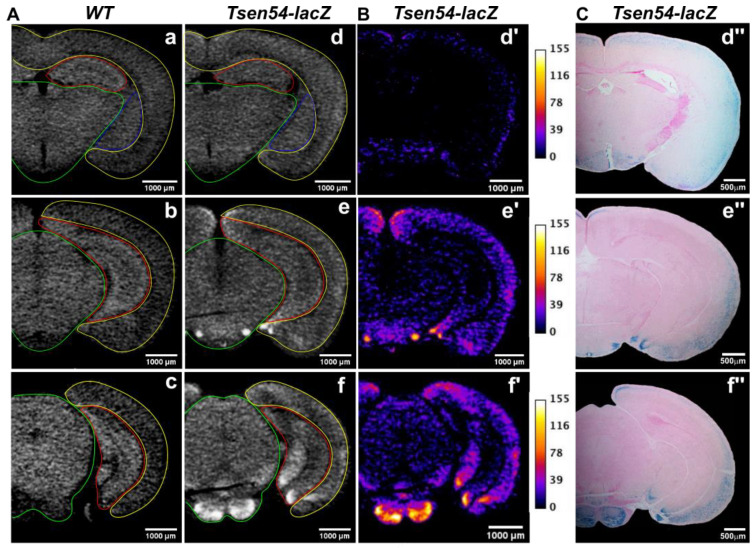
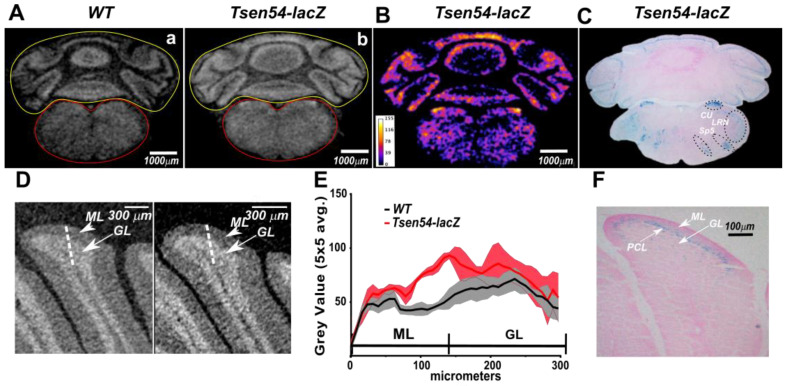
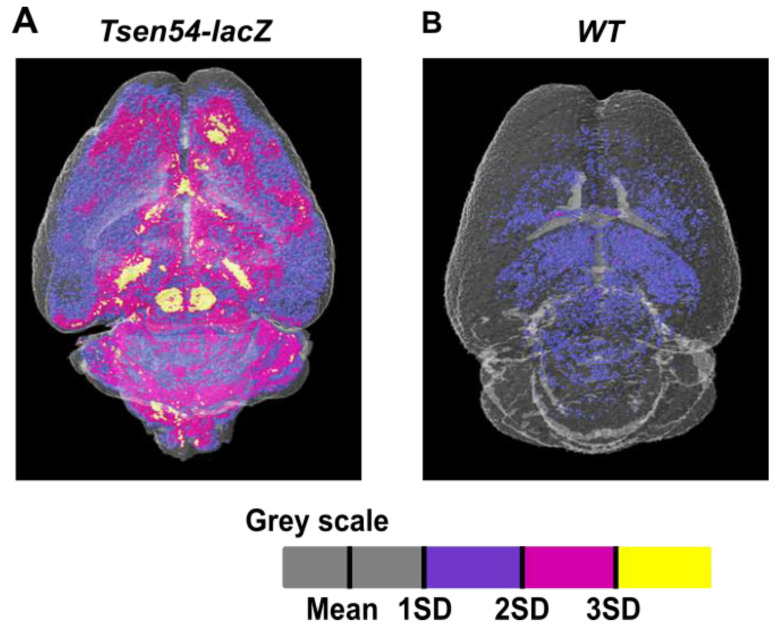
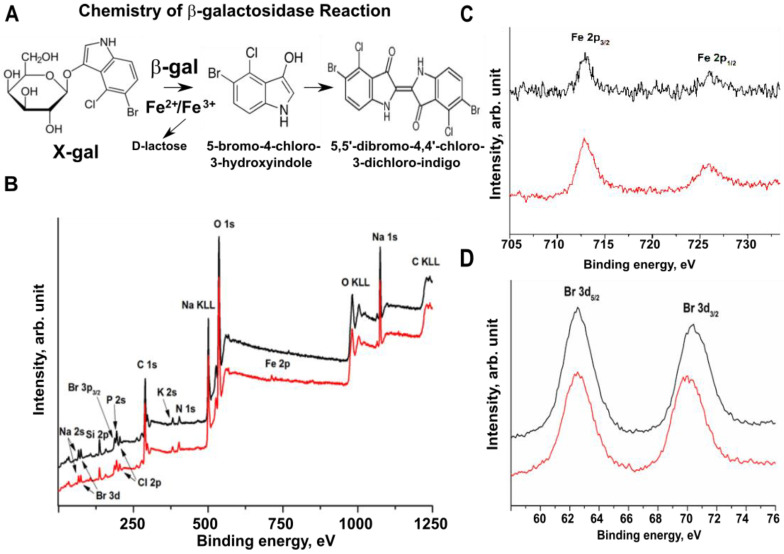
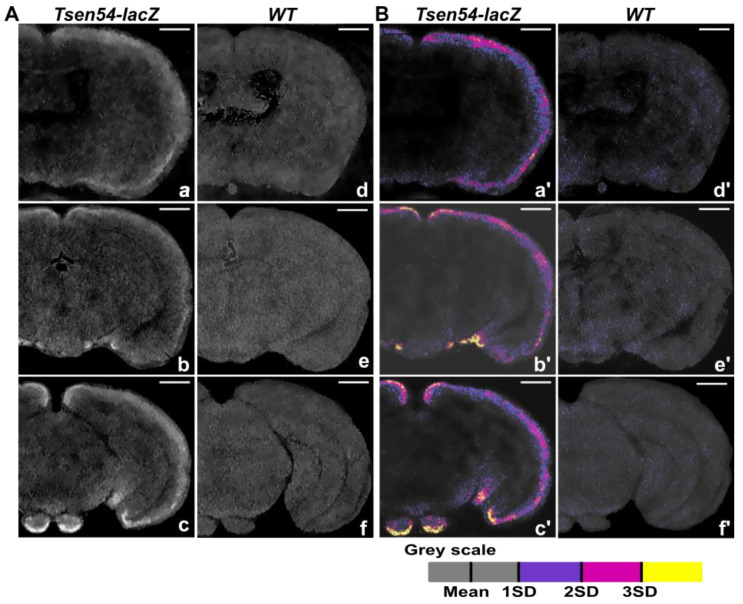
Acquisition of detailed anatomical and molecular knowledge from intact biological samples while preserving their native three-dimensional structure is still a challenging issue for imaging studies aiming to unravel a system's functions. Three-dimensional micro-CT X-ray imaging with a high spatial resolution in minimally perturbed naive non-transparent samples has recently gained increased popularity and broad application in biomedical research. Here, we describe a novel X-ray-based methodology for analysis of β-galactosidase (lacZ) reporter-driven gene expression in an intact murine brain ex vivo by micro-CT. The method relies on detection of bromine molecules in the product of the enzymatic β-galactosidase reaction. Enhancement of the X-ray signal is observed specifically in the regions of the murine brain where expression of the lacZ reporter gene is also detected histologically. We performed quantitative analysis of the expression levels of lacZ reporter activity by relative radiodensity estimation of the β-galactosidase/X-gal precipitate in situ. To demonstrate the feasibility of the method, we performed expression analysis of the Tsen54-lacZ reporter gene in the murine brain in a semi-quantitative manner. Human mutations in the Tsen54 gene cause pontocerebellar hypoplasia (PCH), a group of severe neurodegenerative disorders with both mental and motor deficits. Comparing relative levels of Tsen54 gene expression, we demonstrate that the highest Tsen54 expression is observed in anatomical brain substructures important for the normal motor and memory functions in mice.

Keywords: Tsen54; X-ray imaging; gene expression; lacZ reporter; mouse brain; mouse phenotyping; pontocerebellar hypoplesia.


Conflict of interest statement

The authors declare no conflict of interest.

Figures

Figure 1
Figure 1
Three-dimensional imaging of Tsen54-lacZ expression in intact adult mouse brain by micro-CT. (A) Dorsal and ventral views of Tsen54-lacZ mouse brain stained with X-gal/FeCN and visualized by stereomicroscope; (B) dorsal and ventral views of littermate control whole mouse brain stained with X-gal/FeCN and visualized by stereomicroscope. (C) Representative maximum intensity projection (MIP) micro-CT images scanned with the resolution 5 μm/voxel of whole brain from Tsen54-lacZ (N = 3) and wild type (WT) (N = 3) animals. (D) Sagittal view of MIP images of the brains represented in panel (C). Additional regions of increased density (indicated by white arrows) in Tsen54-LacZ brains correspond to precipitated product of X-gal substrate converted by β-gal. White arrows indicate the regions of the elevated density in Tsen54-lacZ brains imaged by micro-CT and corresponding regions in the brains imaged by microscopy. The arrows filled with black indicate the endogenous densities detected both in the wild type and experimental brains.
Figure 2
Figure 2
Comparison of virtual X-ray sections to histological sections of Tsen54-lacZ cerebrum reveals X-ray-detected regions of reporter gene expression. (A) Two-dimensional micro-CT-derived sections from cerebrum of wild type (ac) and Tsen54-lacZ (df) animals. (B) Segmentation analysis of the virtual micro-CT-derived sections from Tsen54-lacZ brains (d′–f′). The lines delineate the segmentation regions: yellow—cortex; red—hippocampal plate; blue—amygdala; green—central brain. The Lookup Table (LUT) function was set from a 0 to 155 grayscale value interval. (C) Corresponding histological sections from the Tsen54-lacZ brain whole-mount stained with X-gal and counterstained with eosin solution (d″–f″). Micro-CT scans were performed with the resolution 20 μm/voxel.
Figure 3
Figure 3
Comparative analysis of virtual X-ray and histological sections in hindbrain region. (A) Representative 2D virtual sections from hindbrain region of wild type (a) and Tsen54-lacZ (b) brains. Segmentation lines are indicated: yellow—cerebellar lobes, and red—brainstem. Resolution of the micro-CT scan is 20 μm/voxel. (B) Segmentation analysis of the 2D micro-CT hindbrain section. The LUT function was set from a 0 to 155 grayscale value interval. (C) Histological section of hindbrain from the Tsen54-lacZ brain. The regions with the highest expression in brainstem are indicated: CU—cuneate nucleus; Sp5—spinal nucleus of trigeminal; LRN—lateral reticular nucleus. (D) Two-dimensional micro-CT-acquired image of the simple cerebellar lobule from the Tsen54-lacZ and wild type animals at 5 μm/voxel resolution. The punctate lines indicate the regions selected for density quantification. Arrows indicate the cerebellar love layers. (E) Averages of brightness values, corrected for background, from Tsen54-lacZ (N = 3) and wild type (N = 3) cerebellar lobules, were plotted as a function of distance. (F) Histological analysis of the simple cerebellar lobule of cerebellum from the whole-mount X-gal/FeCN stained brains. ML—molecular layer; PCL—Purkinje cell layer; and GL—granular layer.
Figure 4
Figure 4
Relative quantification of Tsen54-lacZ gene expression by micro-CT analysis. (A,B) The average grayscale values were calculated using three datasets from the Tsen54-lacZ brains using CTAN (Bruker) software. The sum of the average mean and one standard deviation was set up as a background of non-contrasted tissues (gray), while values outside of this range were color-coded: 1SD(Standard Deviation) to 2SD—blue (lowest brightness); 2SD to 3SD—magenta (intermediate); and 3SD and above (maximum)—yellow. These calculated values were applied to the datasets obtained from the Tsen54-lacZ (A) and wild type (B) brains. Resolution of the micro-CT original images is 20 μm/voxel.
Figure 5
Figure 5
XPS analysis of the β-galactosidase enzymatic reaction products. (A) Schematic representation of the β-gal reaction in vitro. (BD) X-ray photoemission spectroscopy (XPS) analysis of the β-gal reaction products: black lines—β-gal reaction performed with X-gal/FeCN substrate; red lines—X-gal/FeCN substrate only; (B) complete survey spectra of the β-gal reaction products; (C,D) regions of main photoemission spectra Fe 2p (C) and Br 3d (D) peaks; black lines—reaction of β-gal with X-gal/FeCN substrate; red lines—X-gal/FeCN substrate only. KLL- auger transition; β-gal-β-galactosidase.
Figure 6
Figure 6
Virtual micro-CT sections from the Tsen54-lacZ murine cerebrum stained with X-gal in the presence of tetrazolium as an electron acceptor. (A) Virtual micro-CT sections of murine cerebrum from Tsen54-lacZ (ac) and wild type (df) brains. Whole-mount brains were stained with X-gal in the presence of tetratzolium, and volume images were acquired with the resolution of 20 μm/voxel. (B) Segmentation analysis of the micro-CT-imaged brains was performed using CTAN (Bruker) software on 2D sections from Tsen54-lacZ (ac) and wild type brains (df). Sum of mean and one standard deviation (1SD) calculated from an entire dataset was defined as a background (gray color); intervals between 1SD and 2SD—blue; 2SD and 3SD—magenta; and 3SD and maximum—yellow. The same values were applied for segmentation of the micro-CT-derived sections from the wild type brains. SD—standard deviation; Scale bar—1 mm.

References

    1. Streicher J., Donat M.A., Strauss B., Spörle R., Schughart K., Müller G.B. Computer-based three-dimensional visualization of developmental gene expression. Nat. Genet. 2000;25:147–152. doi: 10.1038/75989. - DOI - PubMed
    1. Lein E.S., Hawrylycz M.J., Ao N., Ayres M., Bensinger A., Bernard A., Boe A.F., Boguski M.S., Brockway K.S., Byrnes E.J., et al. Genome-wide atlas of gene expression in the adult mouse brain. Nature. 2007;445:168–176. doi: 10.1038/nature05453. - DOI - PubMed
    1. Knowles D.W., Biggin M.D. Building quantitative, three-dimensional atlases of gene expression and morphology at cellular resolution. Wiley Interdiscip Rev. Dev. Biol. 2013;2:767–779. doi: 10.1002/wdev.107. - DOI - PMC - PubMed
    1. Ju T., Warren J., Carson J., Bello M., Kakadiaris I., Chiu W., Thaller C., Eichele G. 3D volume reconstruction of a mouse brain from histological sections using warp filtering. J. Neurosci. Methods. 2006;156:84–100. doi: 10.1016/j.jneumeth.2006.02.020. - DOI - PubMed
    1. Brandle K. A new method for aligning histological serial sections for three-dimensional reconstruction. Comput. Biomed. Res. 1989;22:52–62. doi: 10.1016/0010-4809(89)90015-3. - DOI - PubMed

LinkOut - more resources