. 2021 Jun 4;10(6):501.
doi: 10.3390/biology10060501.

Characterization of Rheumatoid Arthritis Risk-Associated SNPs and Identification of Novel Therapeutic Sites Using an In-Silico Approach

Affiliations

Characterization of Rheumatoid Arthritis Risk-Associated SNPs and Identification of Novel Therapeutic Sites Using an In-Silico Approach

Mehran Akhtar et al. Biology (Basel). .

Abstract

Single-nucleotide polymorphisms (SNPs) are reported to be associated with many diseases, including autoimmune diseases. In rheumatoid arthritis (RA), about 152 SNPs are reported to account for ~15% of its heritability. These SNPs may result in the alteration of gene expression and may also affect the stability of mRNA, resulting in diseased protein. Therefore, in order to predict the underlying mechanism of these SNPs and identify novel therapeutic sites for the treatment of RA, several bioinformatics tools were used. The damaging effect of 23 non-synonymous SNPs on proteins using different tools suggested four SNPs, including rs2476601 in PTPN22, rs5029941 and rs2230926 in TNFAIP3, and rs34536443 in TYK2, to be the most damaging. In total, 42 of 76 RA-associated intronic SNPs were predicted to create or abolish potential splice sites. Moreover, the analysis of 11 RA-associated UTR SNPs indicated that only one SNP, rs1128334, located in 3'UTR of ETS1, caused functional pattern changes in BRD-BOX. For the identification of novel therapeutics sites to treat RA, extensive gene-gene interaction network interactive pathways were established, with the identification of 13 potential target sites for the development of RA drugs, including three novel target genes. The anticipated effect of these findings on RA pathogenesis may be further validated in both in vivo and in vitro studies.

Keywords: SNPs; gene–gene interaction; miRNA; rheumatoid arthritis; therapeutic sites.


Conflict of interest statement

The authors declare that they have no conflict of interest.

Figures

Figure 1
Figure 1
Workflow of the study. (A) SNP distribution and analysis with regard to their respective effects. (B) Prediction of gene–gene interactions and core region genes. This figure was generated using Microsoft PowerPoint 2016.
Figure 2
Figure 2
Distribution of SNPs associated with RA, represented in a pie chart. This figure was generated using Microsoft Excel 2016.
Figure 3
Figure 3
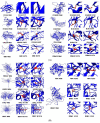
Modeled structures using MODELER v9.22 for wild-type proteins along with a close-up of wild and mutated amino acid residues. (A) Modeled structures for CTLA4, FCGR2A, CD226, AIRE, FCGR2B, IL6R, PLD4, and PRKCH. (B) Modeled structures for RTKN2, YDJC, SH2B3, TYK2, WDFY4, and IRAK1. (C) Modeled structures for NFKBIE, PADI4, PTPN22, and TNFAIP3. All the protein structures were visualized, and figures were generated using Chimera v1.11 software (https://www.cgl.ucsf.edu/chimera/, accessed on 3 February 2021). The structures were then assembled and combined using Microsoft PowerPoint 2016.
Figure 3
Figure 3
Modeled structures using MODELER v9.22 for wild-type proteins along with a close-up of wild and mutated amino acid residues. (A) Modeled structures for CTLA4, FCGR2A, CD226, AIRE, FCGR2B, IL6R, PLD4, and PRKCH. (B) Modeled structures for RTKN2, YDJC, SH2B3, TYK2, WDFY4, and IRAK1. (C) Modeled structures for NFKBIE, PADI4, PTPN22, and TNFAIP3. All the protein structures were visualized, and figures were generated using Chimera v1.11 software (https://www.cgl.ucsf.edu/chimera/, accessed on 3 February 2021). The structures were then assembled and combined using Microsoft PowerPoint 2016.
Figure 4
Figure 4
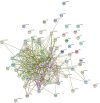
Gene–gene interaction model of 75 RA-associated genes using STRING. This figure was downloaded as a high-quality image file from STRING v11.0 (https://string-db.org/, accessed on 25 February 2021). A guide, representing the different colors in this figure, is provided in Supplementary Figure S2.
Figure 5
Figure 5
Gene–gene interaction network generated by GeneMANIA for all the interaction types. This figure was downloaded as a high-quality image file from GeneMANIA v3.5.1 (https://genemania.org/, accessed on 25 February 2021).
Figure 6
Figure 6
Gene–gene interaction network predicted by GeneMANIA showing only co-localized genes in pathways. This figure was downloaded as a high-quality image file from GeneMANIA v3.5.1 (https://genemania.org/, accessed on 25 February 2021).

References

    1. Halushka M., Fan J., Bentley K., Hsie L., Shen N., Weder A., Cooper R., Lipshutz R., Chakravarti A. Patterns of sin-gle-nucleotide polymorphisms in candidate genes for blood-pressure homeostasis. Nat. Genet. 1999;22:239–247. doi: 10.1038/10297. - DOI - PubMed
    1. Yamamoto K., Okada Y., Suzuki A., Kochi Y. Genetics of rheumatoid arthritis in Asia—Present and future. Nat. Rev. Rheumatol. 2015;11:375–379. doi: 10.1038/nrrheum.2015.7. - DOI - PubMed
    1. Silman A.J. Epidemiology of rheumatoid arthritis. APMIS. 1994;102:721–728. doi: 10.1111/j.1699-0463.1994.tb05226.x. - DOI - PubMed
    1. Aho K., Koskenvuo M., Tuominen J., Kaprio J. Occurrence of rheumatoid arthritis in a nationwide series of twins. J. Rheumatol. 1986;13:899–902. - PubMed
    1. Silman A., Macgregor A., Thomson W., Holligan S., Carthy D., Farhan A., Ollier W. Twin con-cordance rates for rheumatoid arthritis: Results from a nationwide study. Rheumatology. 1993;32:903–907. doi: 10.1093/rheumatology/32.10.903. - DOI - PubMed

LinkOut - more resources