. 2021 Jun 4;10(6):914.
doi: 10.3390/antiox10060914.

Untargeted Metabolomics and Antioxidant Capacities of Muscadine Grape Genotypes during Berry Development

Affiliations

Untargeted Metabolomics and Antioxidant Capacities of Muscadine Grape Genotypes during Berry Development

Ahmed G Darwish et al. Antioxidants (Basel). .

Abstract

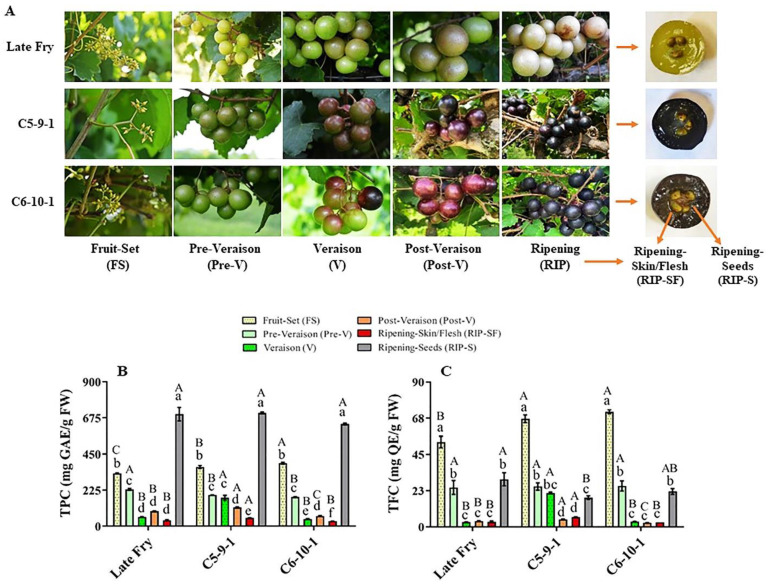
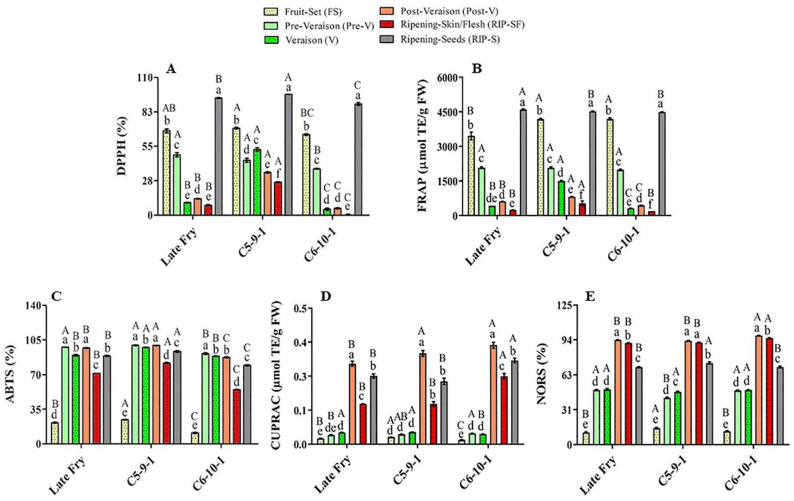
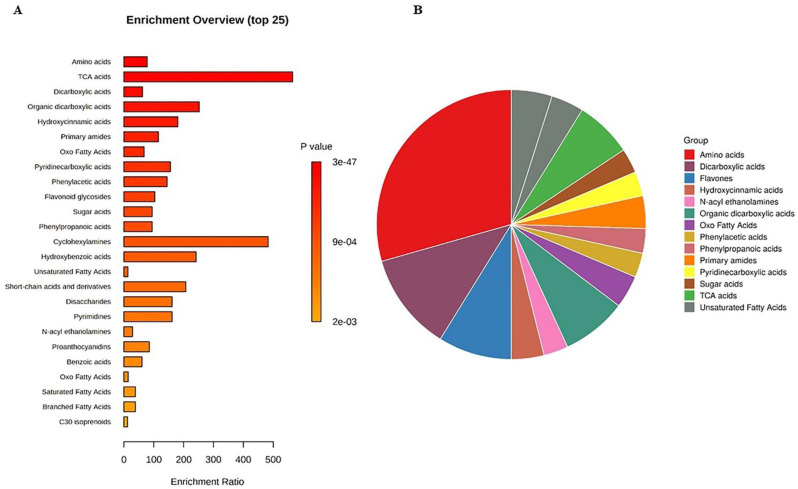
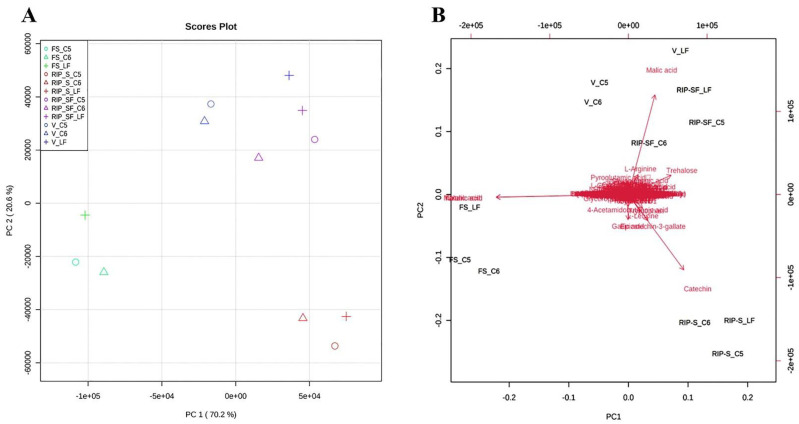
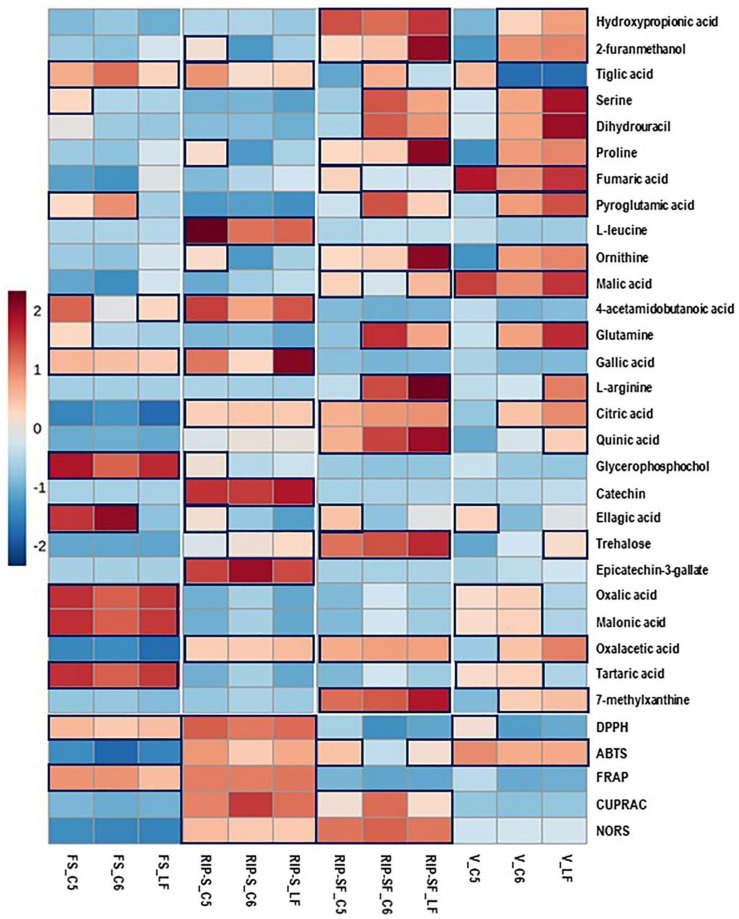
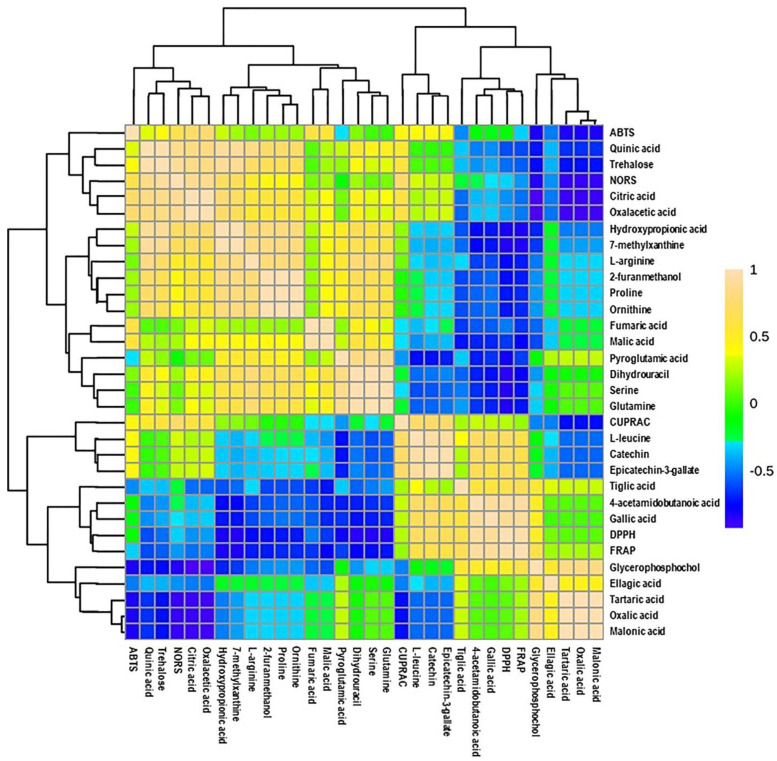
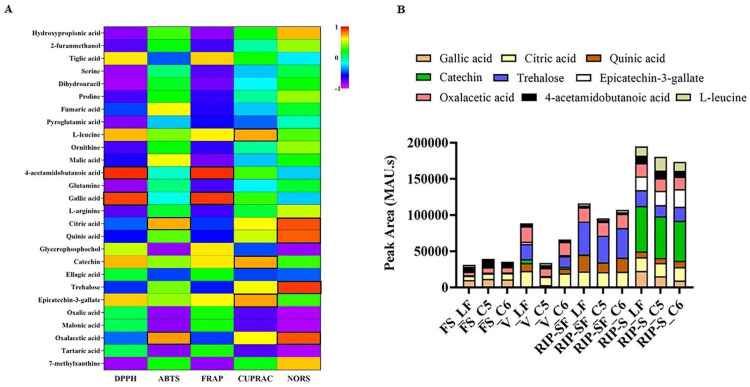
Three muscadine grape genotypes (Muscadinia rotundifolia (Michx.) Small) were evaluated for their metabolite profiling and antioxidant activities at different berry developmental stages. A total of 329 metabolites were identified using UPLC-TOF-MS analysis (Ultimate 3000LC combined with Q Exactive MS and screened with ESI-MS) in muscadine genotypes throughout different developmental stages. Untargeted metabolomics study revealed the dominant chemical groups as amino acids, organic acids, sugars, and phenolics. Principal component analysis indicated that developmental stages rather than genotypes could explain the variations among the metabolic profiles of muscadine berries. For instance, catechin, epicatechin-3-gallate, and gallic acid were more accumulated in ripening seeds (RIP-S). However, tartaric acid and malonic acid were more abundant during the fruit-set (FS) stage, and malic acid was more abundant in the veraison (V) stage. The variable importance in the projection (VIP > 0.5) in partial least-squares-discriminant analysis described 27 biomarker compounds, representing the muscadine berry metabolome profiles. A heatmap of Pearson's correlation analysis between the 27 biomarker compounds and antioxidant activities was able to identify nine antioxidant determinants; among them, gallic acid, 4-acetamidobutanoic acid, trehalose, catechine, and epicatechin-3-gallate displayed the highest correlations with different types of antioxidant activities. For instance, DPPH and FRAP conferred a similar antioxidant activity pattern and were highly correlated with gallic acid and 4-acetamidobutanoic acid. This comprehensive study of the metabolomics and antioxidant activities of muscadine berries at different developmental stages is of great reference value for the plant, food, pharmaceutical, and nutraceutical sectors.

Keywords: developmental stages; metabolomics; muscadine genotypes; nutritional biomarkers.


Conflict of interest statement

The authors declare no conflict of interest.

Figures

Figure 1
Figure 1
(A) A representative image of muscadine grape genotypes Late Fry, C5-9-1, and C6-10-1 during developmental stages. The developmental stages include fruit-set (FS), pre-veraison (pre-V), veraison (V), post-veraison (post-V), and ripening (RIP). The ripening stage was separated into skin/flesh (RIP-SF) and seeds (RIP-S). Accumulation of (B) total phenolic content (TPC) and (C) total flavonoid content (TFC) of muscadine grape genotypes at different developmental stages. Colors representing each developmental stage are indicated. The experiments were carried out in three biological replicates, and each replicate was repeated three times (n = 9). Data represent the mean values ± SD (n = 3). The different lowercase letters represent the significant differences among developmental stages of an individual genotype, and the different uppercase letters refer to the significant differences between genotypes of a particular developmental stage, according to Duncan’s multiple-range test (p > 0.05).
Figure 2
Figure 2
Antioxidant activities of muscadine grape genotypes at different developmental stages were determined using DPPH (A), FRAP (B), ABTS (C), CUPRAC (D), and NORS (E) assays. The experiments were carried out in three biological replicates, and each replicate was repeated three times (n = 9). Data represent the mean values ± SD (n = 3). The different lowercase letters represent the significant differences among developmental stages of an individual genotype, and the different uppercase letters refer to the significant differences between genotypes of a particular developmental stage, according to Duncan’s multiple-range test (p > 0.05).
Figure 3
Figure 3
(A) Bar chart and (B) interactive pie chart of the chemical classification of muscadine metabolites at selected developmental stages using metabolite set enrichment analysis (MSEA). Colors in the bar plot describe the p-value. The red and orange colors signify the high and low values, respectively. The lines indicate the enrichment ratio, which was computed by hits/expected, where hits = observed hits and expected = expected hits. The colors in the interactive pie chart designate each chemical group relative to the total number of compounds.
Figure 4
Figure 4
Principal components analysis (PCA) 2D score plot (A) and biplot (B) of the muscadine metabolites at selected developmental stages. The different short abbreviations in the biplot manifest the scores of the observations (i.e., muscadine genotypes). The vectors that point toward the same direction correspond to the variables (i.e., metabolites) with similar response profiles. The green color of the oval, triangle, and cross shape represents FS_C5, FS_C6, and FS_LF; blue represents V_C5, V_C6, and V_LF; purple represents RIP-SF_C5, RIP-SF_C6, and RIP-SF_LF; and red represents RIP-S_C5, RIP-S_C6, and RIP-S_LF. FS_LF: fruit-set_Late Fry; FS_C5: fruit-set_C5-9-1; FS_C6: fruit-set_C6-10-1; V_LF: veraison_Late Fry; V_C5: veraison_C5-9-1; V_C6: veraison_C6-10-1; RIP-SF_LF: ripening-skin/flesh_Late Fry; RIP-SF_C5: ripening-skin/flesh_C5-9-1; RIP-SF_C6: ripening-skin/flesh_C6-10-1; RIP-S_LF: ripening-seeds_Late Fry; RIP-S_C5: ripening-seeds_C5-9-1; RIP-S_C6: ripening-seeds_C6-10-1.
Figure 5
Figure 5
Heatmap analysis of candidate metabolites (VIP > 0.5) obtained by partial least-squares–discriminant analysis (PLS-DA) and antioxidant activities of muscadine genotypes at selected developmental stages. Each column refers to the muscadine genotype at different developmental stages, and each row indicates the metabolites and antioxidant activities. The red and blue colors in the plot describe high and low intensities, and the values range from –2 to +2. The higher the red color intensity (from +1 to +2 values), the higher the metabolite contents and antioxidant activities; in contrast, the higher blue color intensity (from –1 to –2 values) represents lower metabolite contents and antioxidant activities. FS_LF: fruit-set_Late Fry; FS_C5: fruit-set_C5-9-1; FS_C6: fruit-set_C6-10-1; V_LF: veraison_Late Fry; V_C5: veraison_C5-9-1; V_C6: veraison_C6-10-1; RIP-SF_LF: ripening-skin/flesh_Late Fry; RIP-SF_C5: ripening-skin/flesh_C5-9-1; RIP-SF_C6: ripening-skin/flesh_C6-10-1; RIP-S_LF: ripening-seeds_Late Fry; RIP-S_C5: ripening-seeds_C5-9-1; RIP-S_C6: ripening-seeds_C6-10-1.
Figure 6
Figure 6
Heatmap of Pearson correlation between candidate metabolites (VIP > 0.5) with antioxidant activities of muscadine genotypes at selected developmental stages. Correlation values range from –1 to +1. The values close to +1 represent the higher positive correlation, whereas values closer to zero mean there is no linear trend between the variables; values close to –1 represent the negative correlation between variables. FS_LF: fruit-set_Late Fry; FS_C5: fruit-set_C5-9-1; FS_C6: fruit-set_C6-10-1; V_LF: veraison_Late Fry; V_C5: veraison_C5-9-1; V_C6: veraison_C6-10-1; RIP-SF_LF: ripening-skin/flesh_Late Fry; RIP-SF_C5: ripening-skin/flesh_C5-9-1; RIP-SF_C6: ripening-skin/flesh_C6-10-1; RIP-S_LF: ripening-seeds_Late Fry; RIP-S_C5: ripening-seeds_C5-9-1; RIP-S_C6: ripening-seeds_C6-10-1.
Figure 7
Figure 7
Pearson correlations (A,B) the intensity of absorbance (MAU.s) values of nutritional biomarkers of muscadine genotypes at selected developmental stages. FS_LF: fruit-set_Late Fry; FS_C5: fruit-set_C5-9-1; FS_C6: fruit-set_C6-10-1; V_LF: veraison_Late Fry; V_C5: veraison_C5-9-1; V_C6: veraison_C6-10-1; RIP-SF_LF: ripening-skin/flesh_Late Fry; RIP-SF_C5: ripening-skin/flesh_C5-9-1; RIP-SF_C6: ripening-skin/flesh_C6-10-1; RIP-S_LF: ripening-seeds_Late Fry; RIP-S_C5: ripening-seeds_C5-9-1; RIP-S_C6: ripening-seeds_C6-10-1.

References

    1. Olien W.C. The muscadine grape: Botany, viticulture, history, and current industry. Hort. Sci. 1990;25:732–739. doi: 10.21273/HORTSCI.25.7.732. - DOI
    1. Xu C., Yagiz Y., Zhao L., Simonne A., Lu J., Marshall M.R. Fruit quality, nutraceutical and antimicrobial properties of 58 muscadine grape varieties (Vitis rotundifolia Michx.) grown in United States. Food Chem. 2017;215:149–156. doi: 10.1016/j.foodchem.2016.07.163. - DOI - PubMed
    1. Bralley E.E., Hargrove J.L., Greenspan P., Hartle D.K. Topical anti-inflammatory activities of Vitis rotundifolia (muscadine grape) extracts in the tetradecanoylphorbol acetate model of ear inflammation. J. Med. Food. 2007;10:636–642. doi: 10.1089/jmf.2006.244. - DOI - PubMed
    1. God J.M., Tate P., Larcom L.L. Anticancer effects of four varieties of muscadine grape. J. Med. Food. 2007;10:54–59. doi: 10.1089/jmf.2006.699. - DOI - PubMed
    1. Hudson T.S., Hartle D.K., Hursting S.D., Nunez N.P., Wang T.T., Young H.A., Arany P., Green J.E. Inhibition of prostate cancer growth by muscadine grape skin extract and resveratrol through distinct mechanisms. Cancer Res. 2007;67:8396–8405. doi: 10.1158/0008-5472.CAN-06-4069. - DOI - PubMed

LinkOut - more resources