Macrophage Plasticity and Polarization Are Altered in the Experimental Model of Multiple Sclerosis
- PMID: 34200023
- PMCID: PMC8229971
- DOI: 10.3390/biom11060837
Macrophage Plasticity and Polarization Are Altered in the Experimental Model of Multiple Sclerosis
Abstract
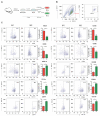
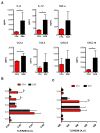
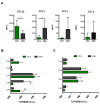
Multiple sclerosis (MS) is an immune-mediated demyelinating disease of the central nervous system. MS is characterized by infiltrations of leukocytes such as T and B lymphocytes and macrophages. Macrophages have been identified as major effectors of inflammation and demyelination in both MS and its animal model, experimental autoimmune encephalomyelitis (EAE). However, the activation and heterogeneity of macrophages in MS has been poorly investigated. Thus, in this study, we evaluated M1 and M2 macrophages immunophenotype from EAE and control mice by analyzing over 30 surface and intracellular markers through polychromatic flow cytometry, qRT-PCR, and ELISA assay. We showed that M1 macrophages possessed a higher proinflammatory profile in EAE compared to control mice, since they expressed higher levels of activation/co-stimulatory markers (iNOS, CD40, and CD80) and cytokines/chemokines (IL-6, IL-12, CCL2, and CXCL10), whereas M2 lost their M2-like phenotype by showing a decreased expression of their signature markers CD206 and CCL22, as well as a concomitant upregulation of several M1 makers. Furthermore, immunization of M1 and M2 macrophages with MOG35-55 led to a significant hyperactivation of M1 and a concomitant shift of anti-inflammatory M2 to pro-inflammatory M1 macrophages. Overall, we provide evidence for a phenotypic alteration of M1/M2 balance during MS, which can be of crucial importance not only for a better understanding of the immunopathology of this neurodegenerative disease but also to potentially develop new macrophage-centered therapeutic strategies.
Keywords: EAE; chemokines; cytokines; macrophages; multiple sclerosis; toll-like receptors.
Conflict of interest statement
The authors declare no conflict of interest.
Figures


Similar articles
-
The roles of macrophages and microglia in multiple sclerosis and experimental autoimmune encephalomyelitis.J Neuroimmunol. 2018 May 15;318:1-7. doi: 10.1016/j.jneuroim.2018.02.015. Epub 2018 Feb 27. J Neuroimmunol. 2018. PMID: 29606295 Review.
-
Adoptive transfer of immunomodulatory M2 macrophages suppresses experimental autoimmune encephalomyelitis in C57BL/6 mice via blockading NF-κB pathway.Clin Exp Immunol. 2021 May;204(2):199-211. doi: 10.1111/cei.13572. Epub 2021 Feb 1. Clin Exp Immunol. 2021. PMID: 33426702 Free PMC article.
-
Bu Shen Yi Sui Capsule Alleviates Neuroinflammation and Demyelination by Promoting Microglia toward M2 Polarization, Which Correlates with Changes in miR-124 and miR-155 in Experimental Autoimmune Encephalomyelitis.Oxid Med Cell Longev. 2021 Mar 16;2021:5521503. doi: 10.1155/2021/5521503. eCollection 2021. Oxid Med Cell Longev. 2021. PMID: 33815654 Free PMC article.
-
Targeting the shift from M1 to M2 macrophages in experimental autoimmune encephalomyelitis mice treated with fasudil.PLoS One. 2013;8(2):e54841. doi: 10.1371/journal.pone.0054841. Epub 2013 Feb 13. PLoS One. 2013. PMID: 23418431 Free PMC article.
-
Macrophages: a double-edged sword in experimental autoimmune encephalomyelitis.Immunol Lett. 2014 Jul;160(1):17-22. doi: 10.1016/j.imlet.2014.03.006. Epub 2014 Mar 31. Immunol Lett. 2014. PMID: 24698730 Free PMC article. Review.
Cited by
-
Expression profiling of cerebrospinal fluid identifies dysregulated antiviral mechanisms in multiple sclerosis.Brain. 2024 Feb 1;147(2):554-565. doi: 10.1093/brain/awad404. Brain. 2024. PMID: 38038362 Free PMC article.
-
The potential role of 1,25(OH)2D3 (Active vitamin D3) in modulating macrophage function; implications for chronic obstructive pulmonary disease (COPD).J Inflamm (Lond). 2025 Jul 1;22(1):26. doi: 10.1186/s12950-025-00452-y. J Inflamm (Lond). 2025. PMID: 40598381 Free PMC article. Review.
-
Sensor Array-Enabled Identification of Drugs for Repolarization of Macrophages to Anti-Inflammatory Phenotypes.Anal Chem. 2023 Aug 15;95(32):12177-12183. doi: 10.1021/acs.analchem.3c02551. Epub 2023 Aug 3. Anal Chem. 2023. PMID: 37535805 Free PMC article.
-
Ejection of damaged mitochondria and their removal by macrophages ensure efficient thermogenesis in brown adipose tissue.Cell Metab. 2022 Apr 5;34(4):533-548.e12. doi: 10.1016/j.cmet.2022.02.016. Epub 2022 Mar 18. Cell Metab. 2022. PMID: 35305295 Free PMC article.
-
Novel recombinant protein flagellin A N/C attenuates experimental autoimmune encephalomyelitis by suppressing the ROS/NF-κB/NLRP3 signaling pathway.Front Pharmacol. 2022 Nov 14;13:956402. doi: 10.3389/fphar.2022.956402. eCollection 2022. Front Pharmacol. 2022. PMID: 36452219 Free PMC article.
References
Publication types
MeSH terms
LinkOut - more resources
Full Text Sources
Medical
Research Materials

