. 2021 Jun 7;22(11):6147.
doi: 10.3390/ijms22116147.

Association of MALAT1 and PVT1 Variants, Expression Profiles and Target miRNA-101 and miRNA-186 with Colorectal Cancer: Correlation with Epithelial-Mesenchymal Transition

Affiliations

Association of MALAT1 and PVT1 Variants, Expression Profiles and Target miRNA-101 and miRNA-186 with Colorectal Cancer: Correlation with Epithelial-Mesenchymal Transition

Abdullah F Radwan et al. Int J Mol Sci. .

Abstract

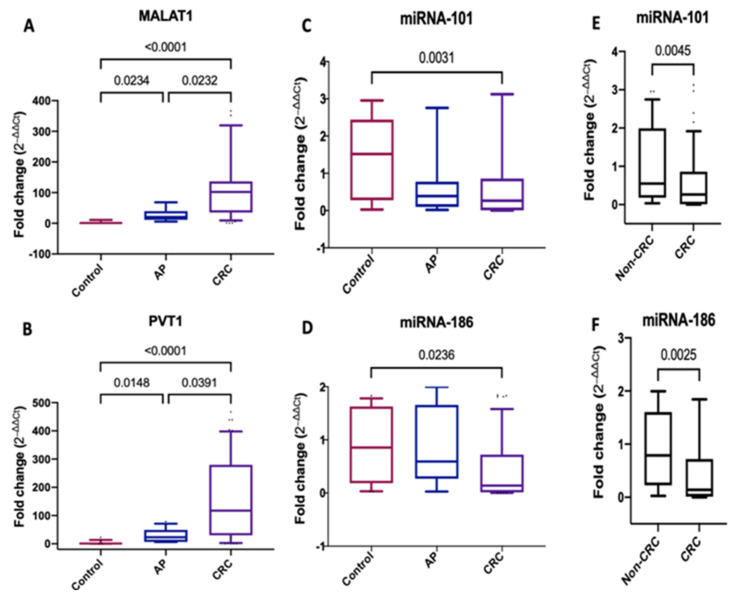
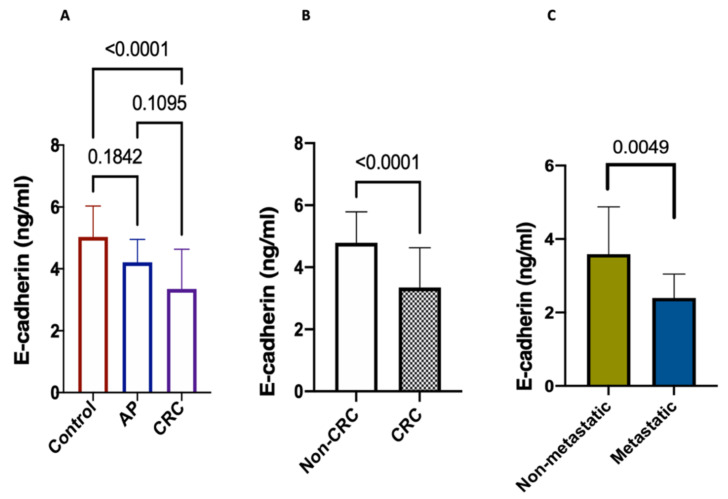
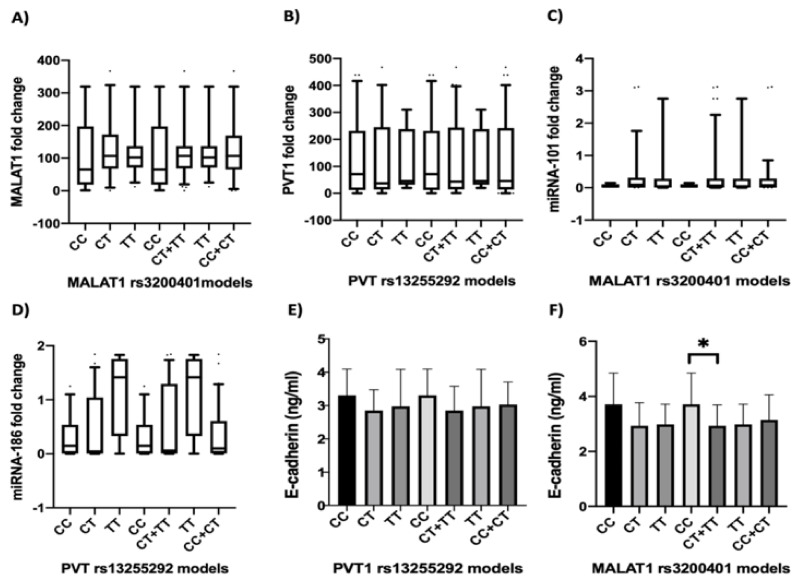
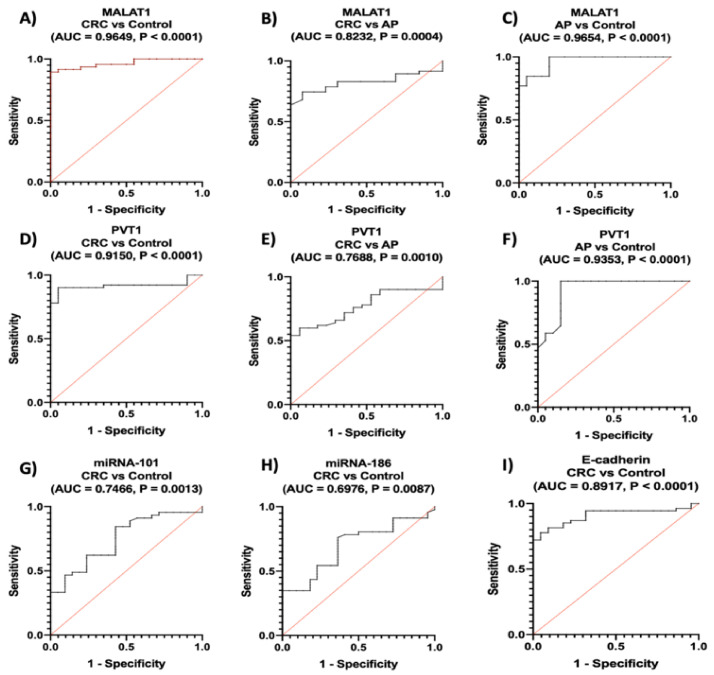
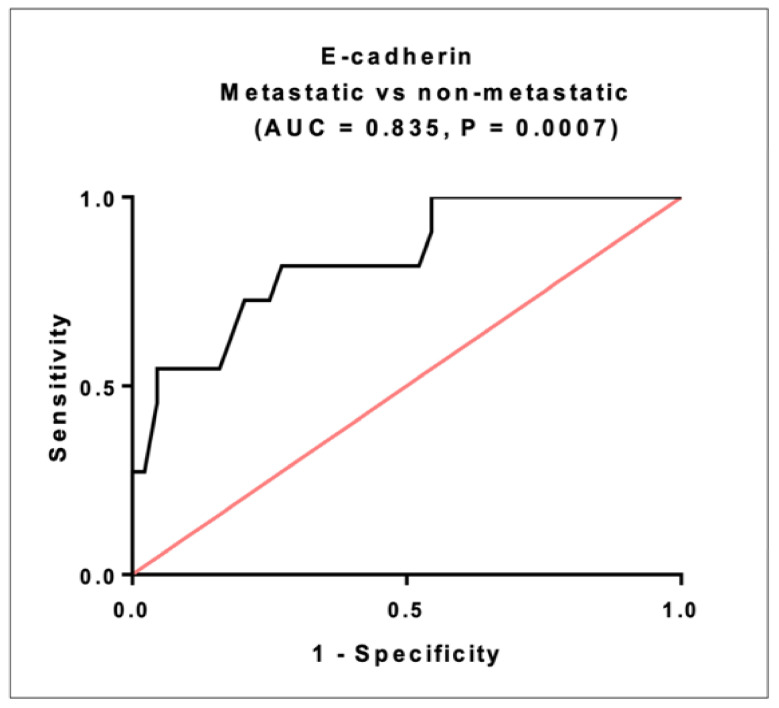
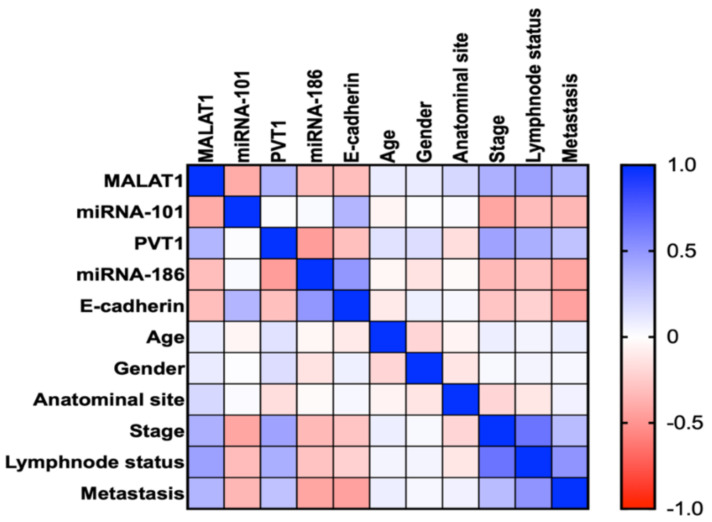
The influence of PVT1 and MALAT1 variants on colorectal cancer (CRC) susceptibility and their impact on PVT1/miRNA-186/epithelial-mesenchymal transition (EMT) and MALAT1/miRNA-101/EMT axes in CRC are unknown. We investigated the influence of PVT1 rs13255292 and MALAT1 rs3200401 on the risk of CRC and adenomatous polyps (AP), their impact on the long noncoding RNAs PVT1 and MALAT1 expression and their target miRNA-186, miRNA-101/E-cadherin pathways, along with their potential as early CRC biomarkers. Overall, 280 individuals were recruited: 140 patients with CRC, 40 patients with AP, and 100 healthy volunteers. Genotyping and serum expression profiles were assessed using qPCR. The EMT biomarker, E-cadherin, was measured by ELISA. rs3200401 was associated with increased CRC risk, whereas rs13255292 was protective. Serum PVT1 and MALAT1 were upregulated in CRC and AP patients versus healthy controls, whereas, miRNA-186, miRNA-101 and E-cadherin were downregulated in CRC versus non-CRC groups. MALAT1 showed superior diagnostic potential for CRC and predicted CRC risk among non-CRC groups in the multivariate logistic analysis. PVT1, MALAT1, miRNA-186 and miRNA-101 levels were correlated with E-cadherin, tumor stage, lymph node and distant metastasis. E-cadherin was lost in metastatic vs. non-metastatic CRC. rs3200401CC genotype carriers showed higher E-cadherin levels than CC + CT carriers. rs3200401 was correlated with lymph node status. For the first time, rs13255292 and rs3200401 are potential genetic CRC predisposition markers, with rs3200401 possibly impacting the EMT process. Serum PVT1, MALAT1, miRNA-186 and miRNA-101 are novel non-invasive diagnostic biomarkers that could improve the clinical outcome of CRC.

Keywords: CRC; SNPs; adenomatous polyps; diagnosis; long non-coding RNA; microRNAs.


Conflict of interest statement

The authors declare no conflict of interest.

Figures

Figure 1
Figure 1
Serum expression levels of MALAT1, PVT1, miRNA-101 and miRNA-186. (AD) Fold change of serum MALAT1, PVT1, miRNA-101 and miRNA-186 expression levels in patients with CRC (n = 140) and adenomatous polyps (n = 40) compared with healthy controls (n = 100). (E,F) Fold change of miRNA-101 and miRNA-186 expression levels in CRC (n = 140) versus non-CRC (n = 140). For the control samples, the 2−∆∆ct was calculated by subtracting each control value from the average control. Data were expressed as box blot; the box represents the 25–75% percentiles; the line inside the box represents the median and the upper and lower lines representing the 10–90% percentiles. p < 0.05 means statistical significance.
Figure 2
Figure 2
Serum levels of E-cadherin. Data expressed as mean ± SD. p < 0.05 means statistical significance. (A) CRC (n = 140), adenomatous polyps (n = 40) and healthy controls (n = 100), (B) CRC (n = 140) vs. non-CRC groups (n = 140), (C) metastatic (n = 24) vs. non-metastatic (n = 116).
Figure 3
Figure 3
Serum MALAT1, PVT1, miRNA-101, miRNA-186 and E-cadherin expression levels in CRC patients with different rs3200401 and rs13255292 genotypes. The box represents the 25%–75% percentiles; the line inside the box represents the median and the upper and lower lines representing the 10%–90% percentiles of the fold change of serum (A) MALAT1I, (B) PVT1, (C) miRNA-101 and (D) miRNA-186. (E,F) The bars represent the mean and SD of serum E-cadherin.* means statistical significance p < 0.05.
Figure 4
Figure 4
Diagnostic performance of serum (AC) MALAT1, (DF) PVT1, (G) miRNA-101, (H) miRNA-186 and (I) E-cadherin. Using ROC curve analysis, CRC (n = 140), AP (n = 40), healthy controls (n = 100).
Figure 5
Figure 5
The prognostic performance of serum E-cadherin. Using ROC curve analysis, metastatic patients (n = 24), non-metastatic patients (n = 116).
Figure 6
Figure 6
Correlations between studied serum markers with each other and with clinical data in CRC group. A correlation map with a blue-red (cold-hot) scale. The blue color corresponds to a correlation close to 1 and the red color corresponds to a correlation close to −1. White corresponds to a correlation close to 0. Correlations are made by spearman correlation.

Similar articles

Cited by

References

    1. Siegel R.L., Mph K.D.M., Sauer A.G., Fedewa S.A., Butterly L.F., Anderson J.C., Cercek A., Smith R.A., Jemal A. Colorectal cancer statistics, 2020. CA A Cancer J. Clin. 2020;70:145–164. doi: 10.3322/caac.21601. - DOI - PubMed
    1. Keum N., Giovannucci E. Global burden of colorectal cancer: Emerging trends, risk factors and prevention strategies. Nat. Rev. Gastroenterol. Hepatol. 2019;16:713–732. doi: 10.1038/s41575-019-0189-8. - DOI - PubMed
    1. Grillone K., Riillo C., Scionti F., Rocca R., Tradigo G., Guzzi P.H., Alcaro S., Di Martino M.T., Tagliaferri P., Tassone P. Non-coding RNAs in cancer: Platforms and strategies for investigating the genomic “dark matter”. J. Exp. Clin. Cancer Res. 2020;39:1–19. doi: 10.1186/s13046-020-01622-x. - DOI - PMC - PubMed
    1. Ji X., Zhang J., Liu L., Lin Z., Pi L., Lin Z., Tian N., Lin X., Chen S., Yu X., et al. Association of tagSNPs at lncRNA MALAT-1 with HCC Susceptibility in a Southern Chinese Population. Sci. Rep. 2019;9:1–7. doi: 10.1038/s41598-019-47165-w. - DOI - PMC - PubMed
    1. Zhuang M., Zhao S., Jiang Z., Wang S., Sun P., Quan J., Yan D., Wang X. MALAT1 sponges miR-106b-5p to promote the invasion and metastasis of colorectal cancer via SLAIN2 enhanced microtubules mobility. EBioMedicine. 2019;41:286–298. doi: 10.1016/j.ebiom.2018.12.049. - DOI - PMC - PubMed

MeSH terms