. 2021 Jun 7;11(6):363.
doi: 10.3390/metabo11060363.

Machine Learning Algorithms, Applied to Intact Islets of Langerhans, Demonstrate Significantly Enhanced Insulin Staining at the Capillary Interface of Human Pancreatic β Cells

Affiliations

Machine Learning Algorithms, Applied to Intact Islets of Langerhans, Demonstrate Significantly Enhanced Insulin Staining at the Capillary Interface of Human Pancreatic β Cells

Louise Cottle et al. Metabolites. .

Abstract

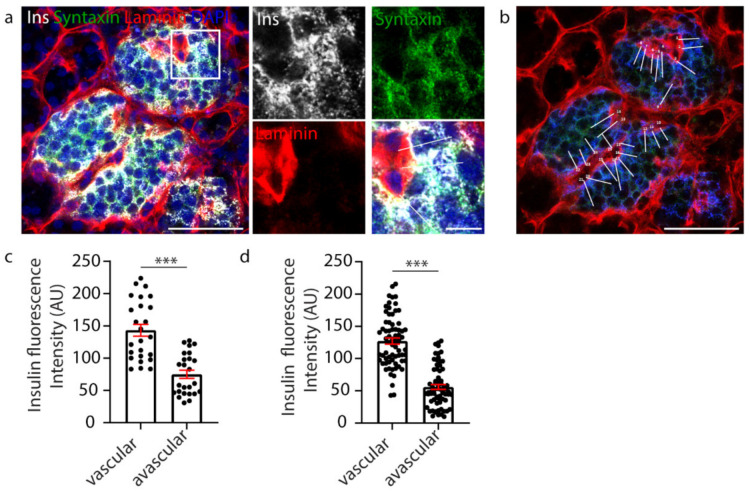
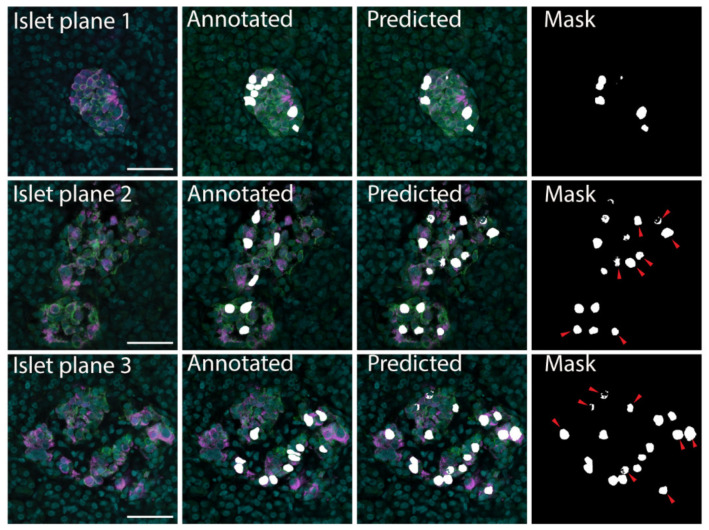
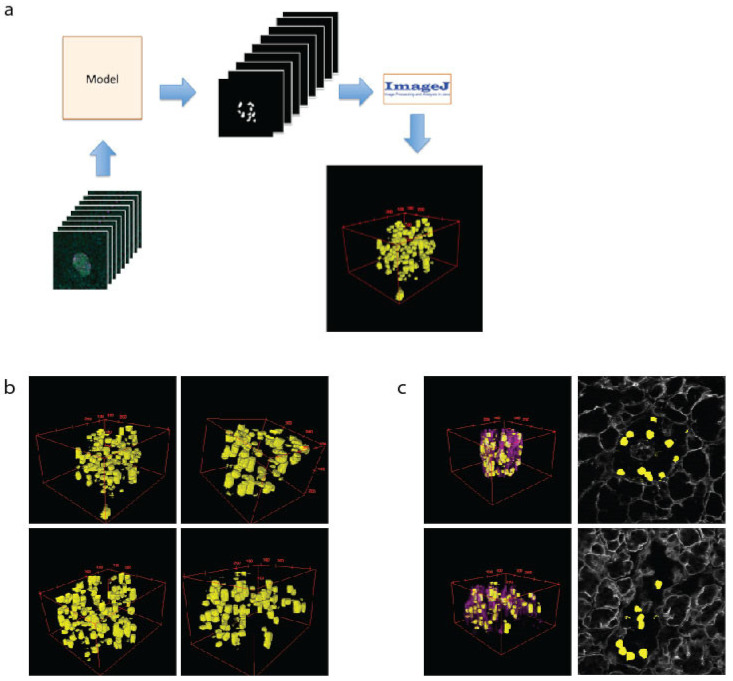
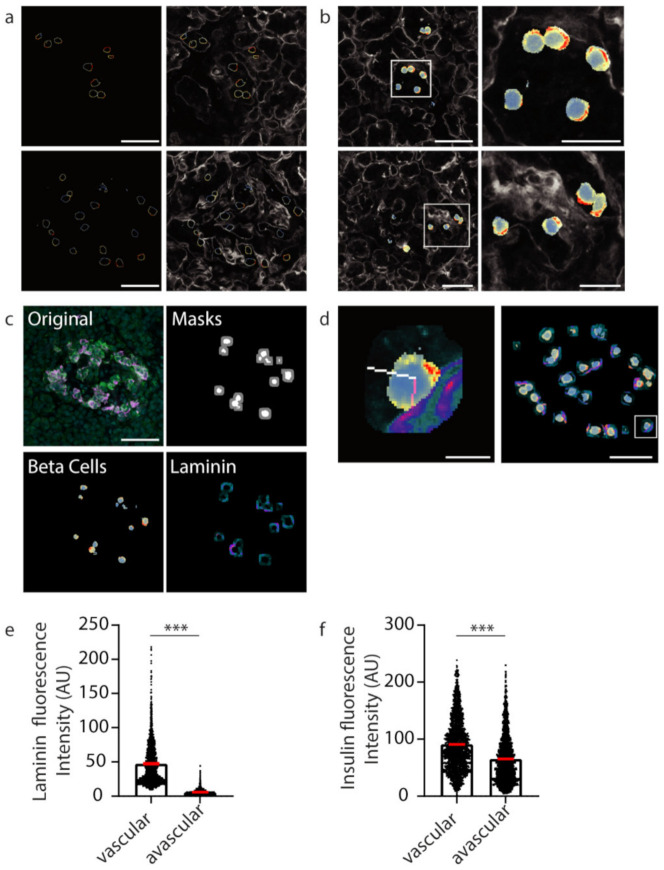
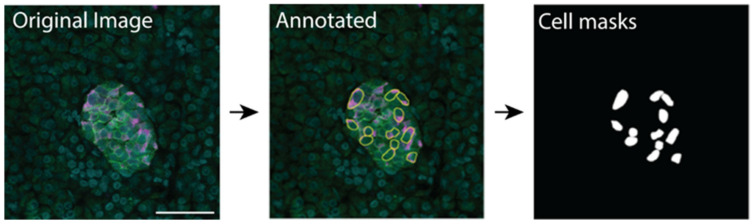
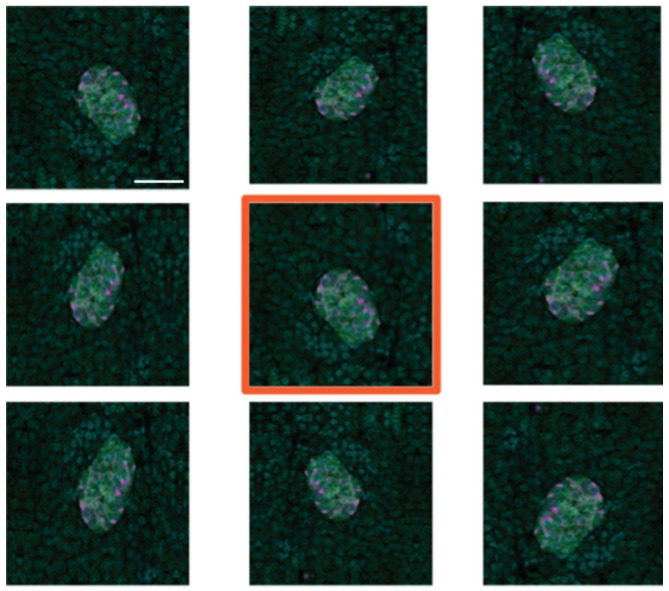
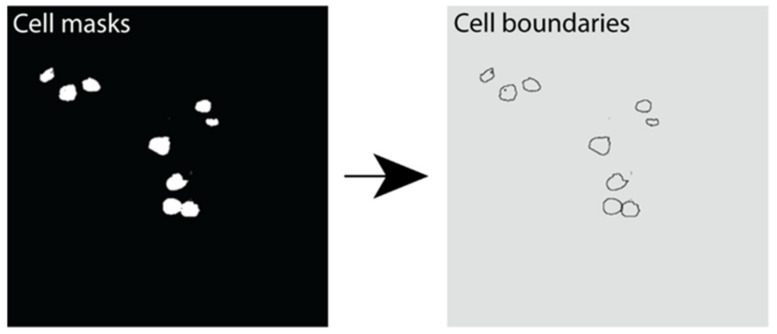
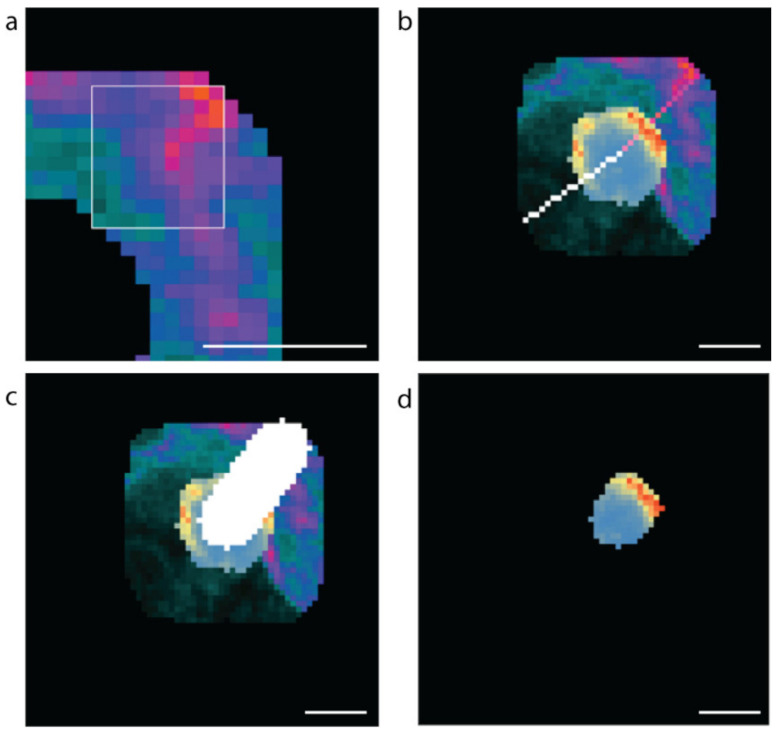
Pancreatic β cells secrete the hormone insulin into the bloodstream and are critical in the control of blood glucose concentrations. β cells are clustered in the micro-organs of the islets of Langerhans, which have a rich capillary network. Recent work has highlighted the intimate spatial connections between β cells and these capillaries, which lead to the targeting of insulin secretion to the region where the β cells contact the capillary basement membrane. In addition, β cells orientate with respect to the capillary contact point and many proteins are differentially distributed at the capillary interface compared with the rest of the cell. Here, we set out to develop an automated image analysis approach to identify individual β cells within intact islets and to determine if the distribution of insulin across the cells was polarised. Our results show that a U-Net machine learning algorithm correctly identified β cells and their orientation with respect to the capillaries. Using this information, we then quantified insulin distribution across the β cells to show enrichment at the capillary interface. We conclude that machine learning is a useful analytical tool to interrogate large image datasets and analyse sub-cellular organisation.

Keywords: automation; beta cell; cell segmentation; deep learning; human; insulin; islet; machine learning; polarisation.


Conflict of interest statement

The authors declare no conflict of interest.

Figures

Figure 1
Figure 1
Manual analysis of β cell insulin intensity. (a) Representative image of a whole human islet with inset. Ins-grey, Syntaxin 1A-green, Laminin-red, DAPI-blue. (b) Whole islet image with line-scans (white) over β cells contacting the vasculature. Ins-blue, Syntaxin 1A-green, Laminin-red. (c) Graph of insulin intensity analysis for the islet in a-b, cells n = 25 *** p < 0.0001. (d) Graph of insulin intensity analysis for all β cells analysed. Data are representative of n = 3 donors (1–2 islets per donor), cells n = 83 *** p < 0.0001. Scale bar 50 µm on whole islet images and 10 µm on insets.
Figure 2
Figure 2
β cell prediction using U-Net deep learning approaches. Examples of microscopy images (Islet plane), the related manually segmented mask overlayed on the original image (Annotated), and the predicted mask image overlayed on the original image (Predicted). The predicted mask (Mask) shows predicted β cells that were not labelled in the annotated image with red arrows. Insulin—magenta, Syntaxin 1A—green, DAPI—cyan, β cell masks—white. Scale bar represents 50 µm.
Figure 3
Figure 3
The 3D modelling of β cells within pancreatic islets. (a) Schematic of workflow used to create 3D representation of islets using cell masks. (b) Examples of 3D models of β cells (yellow) within islets. (c) The 3D models showing β cells and the vasculature (as labelled with laminin-magenta) and a single plane showing β cell location (yellow) and vasculature (grey).
Figure 4
Figure 4
Insulin intensity analyses using computational techniques. (a) Representative β cell boundaries with insulin fluoresce represented using a defined heatmap LUT in ImageJ with vasculature (laminin-grey). Heat map fluorescence low to high; blue to red. (b) Heat maps applied to whole β cells within islets (c) Original islet image with masks for cells (white) and cell boundaries (grey), heatmap for insulin (Beta cells; fluorescence low to high; blue to red) and laminin (Laminin; fluorescence low to high; teal to orange). (d) A 10 pixel-wide scan line from the vasculature (laminin high intensity) in pink was used to determine insulin florescence intensity. In white is the line used to measure insulin intensity from the avascular cell boundary (low laminin intensity). The location of the example cell in the whole islet image is shown using a white box. (e) Graph of laminin intensity at the vascular and avascular regions. (f) Graph of insulin intensity at the vascular and avascular regions. *** p < 0.001. Scale bar represents 50 µm for whole islets, 20 µm for insets in (b) and 5 µm for the inset in (d).
Figure 5
Figure 5
Manual annotation of images using ImageJ and resulting masks used for training the machine learning model. Scale bar represents 50 µm.
Figure 6
Figure 6
Example of image augmentation used to increase image numbers in the training dataset. The original image has an orange border. Scale bar represents 50 µm.
Figure 7
Figure 7
Instance segmentation output showing β cell boundaries. Example image outputs showing cell masks (white) and the resulting cell boundaries predicted using instance segmentation in Python.
Figure 8
Figure 8
Methods used to computationally assess vascular and avascular regions. (a) The 9 × 9-pixel window used for determining the high and low mean laminin points in the cell boundary region, (b) the software generated scan lines from the high (pink) and low (white) laminin concentration points to the cell centre. (c) The 10-pixel-wide scan-line and (d) the insulin concentrations along the 10-pixel-wide scan line within the β cell (blue low to red high insulin staining intensity). Scale bar represents 5 µm.

Similar articles

Cited by

References

    1. Ashcroft F.M., Rorsman P. Diabetes mellitus and the beta cell: The last ten years. Cell. 2012;148:1160–1171. doi: 10.1016/j.cell.2012.02.010. - DOI - PMC - PubMed
    1. Al-Kofahi Y., Zaltsman A., Graves R., Marshall W., Rusu M. A deep learning-based algorithm for 2-D cell segmentation in microscopy images. BMC Bioinform. 2018;19:365. doi: 10.1186/s12859-018-2375-z. - DOI - PMC - PubMed
    1. Sommer C., Gerlich D.W. Machine learning in cell biology—Teaching computers to recognize phenotypes. J. Cell Sci. 2013;126:5529–5539. doi: 10.1242/jcs.123604. - DOI - PubMed
    1. Xu C., Jackson S.A. Machine learning and complex biological data. Genome Biol. 2019;20:76. doi: 10.1186/s13059-019-1689-0. - DOI - PMC - PubMed
    1. Kraus O.Z., Ba J.L., Frey B.J. Classifying and segmenting microscopy images with deep multiple instance learning. Bioinformatics. 2016;32:i52–i59. doi: 10.1093/bioinformatics/btw252. - DOI - PMC - PubMed

LinkOut - more resources