. 2021 Jun 10;9(2):29.
doi: 10.3390/proteomes9020029.

Mining Proteome Research Reports: A Bird's Eye View

Affiliations

Mining Proteome Research Reports: A Bird's Eye View

Jagajjit Sahu. Proteomes. .

Abstract

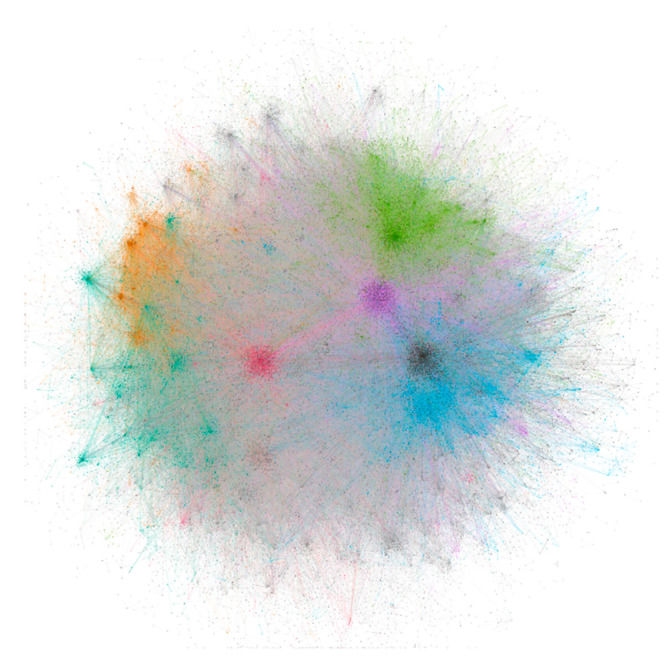
The complexity of data has burgeoned to such an extent that scientists of every realm are encountering the incessant challenge of data management. Modern-day analytical approaches with the help of free source tools and programming languages have facilitated access to the context of the various domains as well as specific works reported. Here, with this article, an attempt has been made to provide a systematic analysis of all the available reports at PubMed on Proteome using text mining. The work is comprised of scientometrics as well as information extraction to provide the publication trends as well as frequent keywords, bioconcepts and most importantly gene-gene co-occurrence network. Out of 33,028 PMIDs collected initially, the segregation of 24,350 articles under 28 Medical Subject Headings (MeSH) was analyzed and plotted. Keyword link network and density visualizations were provided for the top 1000 frequent Mesh keywords. PubTator was used, and 322,026 bioconcepts were able to extracted under 10 classes (such as Gene, Disease, CellLine, etc.). Co-occurrence networks were constructed for PMID-bioconcept as well as bioconcept-bioconcept associations. Further, for creation of subnetwork with respect to gene-gene co-occurrence, a total of 11,100 unique genes participated with mTOR and AKT showing the highest (64) number of connections. The gene p53 was the most popular one in the network in accordance with both the degree and weighted degree centrality, which were 425 and 1414, respectively. The present piece of study is an amalgam of bibliometrics and scientific data mining methods looking deeper into the whole scale analysis of available literature on proteome.

Keywords: NLP; bio-concepts; gene–gene network; proteome; scientometrics; text mining.


Conflict of interest statement

The author declares no conflict of interest.

Figures

Figure 1
Figure 1
Year-wise publication trend. Freq_Fractn represents the actual no of publications/1000 and the actual no of publications are presented on the top of the bars.
Figure 2
Figure 2
A plot for visualizing the intersections of PMIDs between 28 types of Mesh subheadings for the Mesh term Proteome. The input file contained a total of 24,350 unique PMIDs that are present under at least one of the subheadings. The matrix was of 24,350 rows and 28 columns for all subheadings (with the first column containing 24,350 PMIDs). All 28 subheadings have been labelled in the graph along with the number of PMIDs as a bar plot to the left. Right to the labels, there are black and grey circles representing the sets participating in the intersection and not participating, respectively. The black lines connecting the black circles represent the exclusive intersections.
Figure 3
Figure 3
Visualization of the Mesh keywords for all the articles with the help of VOSviewer. (a) and (b) are network and density visualizations for the frequent keywords, respectively. Keeping the co-occurrence links in mind, the number of keywords for the visualization was limited to 1000.
Figure 4
Figure 4
The PMID-bioconcept ID network created on R and visualized on Gephi using OpenOrd layout algorithm. The network was allowed to simulate to attain a stable layout.
Figure 5
Figure 5
The bioconcept–bioconcept network created on R and visualized on Gephi using OpenOrd layout algorithm. The network was allowed to simulate to attain a stable layout.
Figure 6
Figure 6
The gene–gene network extracted from the bioconcept–bioconcept network. The network was visualized on Gephi using OpenOrd layout algorithm and allowed to simulate to attain a stable layout. The node color depends on the modularity and the node size ranges from 20 to 50 based on the weighted degree.
Figure 7
Figure 7
The network for key nodes mined for biological insight. The top 10 genes and the most important disease, which is cancer, were taken as selected nodes, and a network was derived from the bioconcept–bioconcept co-occurrence network.

References

    1. Weeber M., Klein H., Aronson A.R., Mork J.G., Berg L.T.D.J.-V.D., Vos R. Text-based discovery in biomedicine: The architecture of the DAD-system. Proc. AMIA Symp. 2000;2000:903–907. - PMC - PubMed
    1. Cohen K.B., Hunter L. Artificial Intelligence Methods and Tools for Systems Biology. Volume 5. Springer; Dordrecht, The Netherlands: 2004. pp. 147–173. Natural language processing and systems biology.
    1. Raja K., Patrick M., Gao Y., Madu D., Yang Y., Tsoi L.C. A Review of Recent Advancement in Integrating Omics Data with Literature Mining towards Biomedical Discoveries. Int. J. Genom. 2017;2017:6213474. doi: 10.1155/2017/6213474. - DOI - PMC - PubMed
    1. Singha D.L., Sahu J. Gazing at The PubMed Reports on CRISPR Tools in Medical Research: A Text-Mining Study. Mol. Genet. Med. 2019;13:1.
    1. Yeh A.S., Hirschman L., Morgan A.A. Evaluation of text data mining for database curation: Lessons learned from the KDD Challenge Cup. Bioinformatics. 2003;19:i331–i339. doi: 10.1093/bioinformatics/btg1046. - DOI - PubMed